. 2025 Sep 12;23(9):e3003383.
doi: 10.1371/journal.pbio.3003383. eCollection 2025 Sep.

The modern expansion of Dscam1 isoform diversity in Drosophila is linked to fitness and immunity

Affiliations

The modern expansion of Dscam1 isoform diversity in Drosophila is linked to fitness and immunity

Haiyang Dong et al. PLoS Biol. .

Abstract

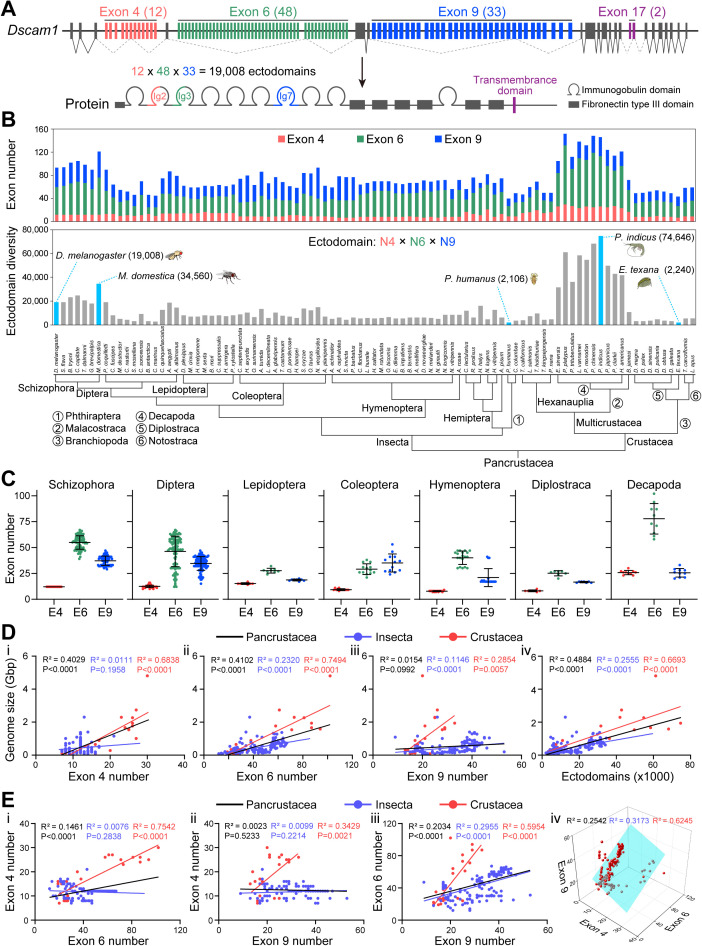
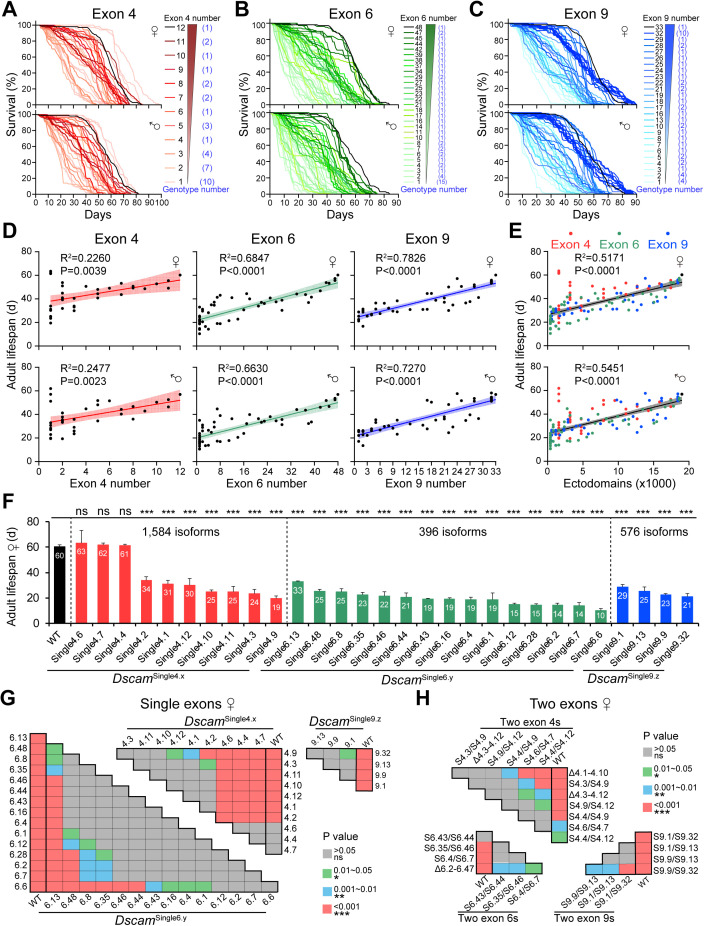
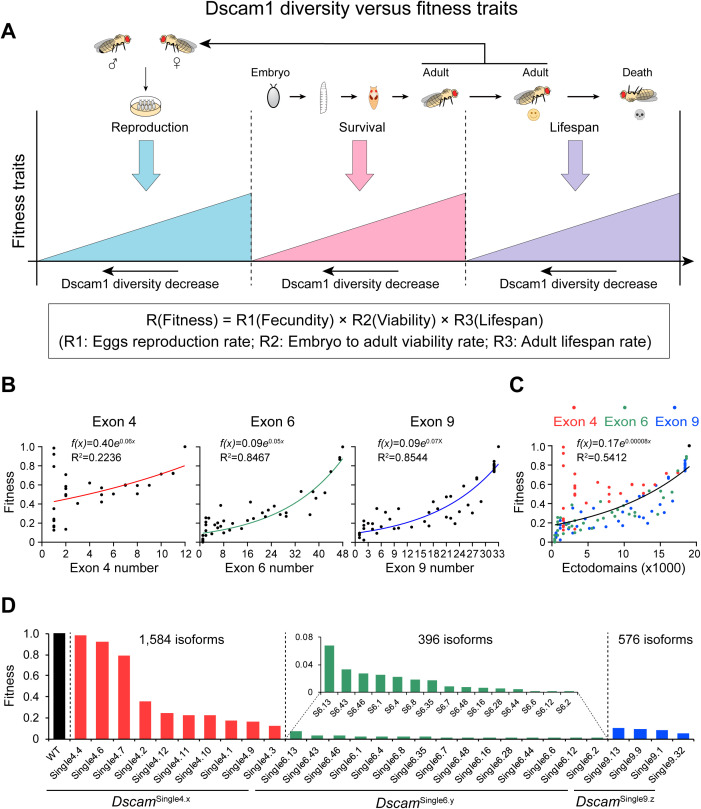
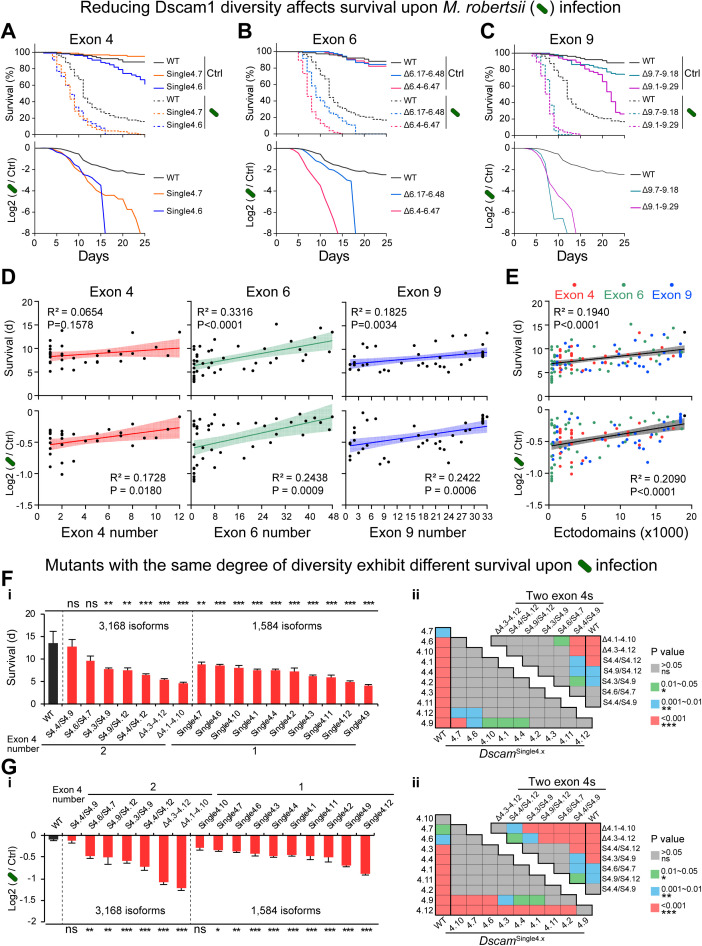
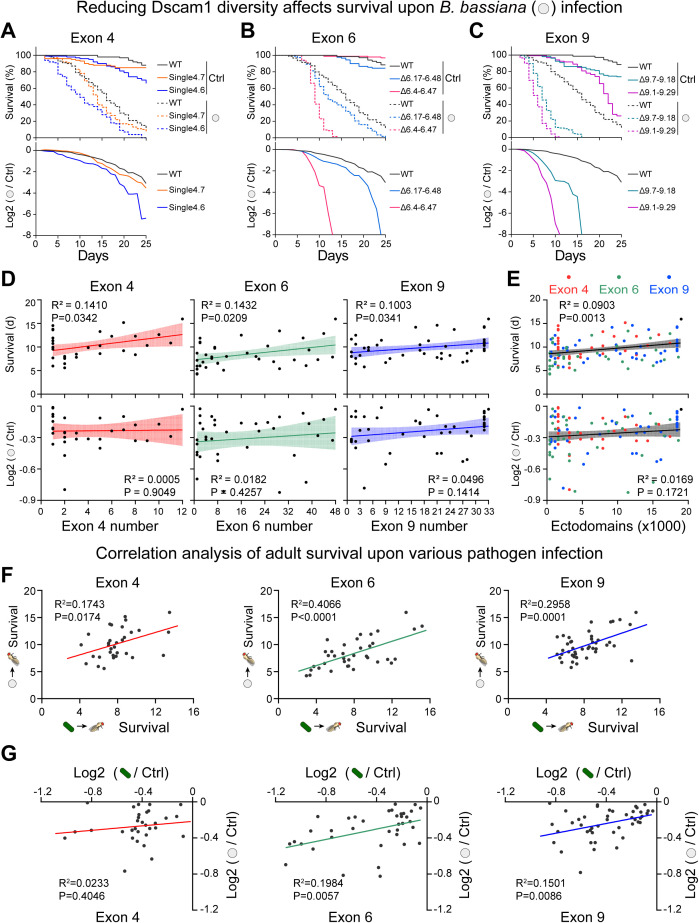
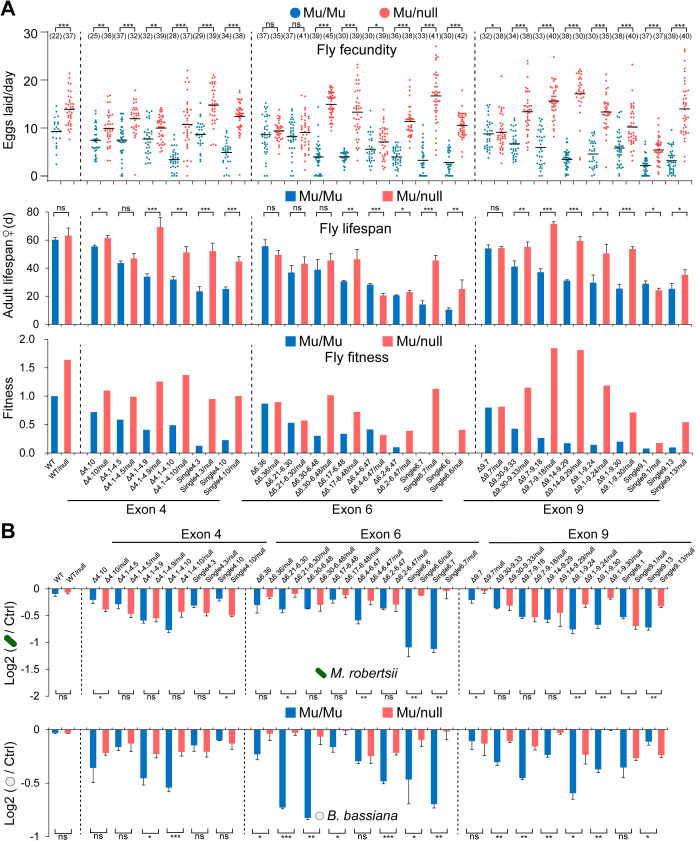
Drosophila melanogaster Down Syndrome cell adhesion molecule 1 (Dscam1) gene encodes 38,016 diverse cell surface receptor proteins via alternative splicing, which have both nervous and immune functions. However, it remains elusive why organisms have evolved such an astonishing diversity of isoforms. Here, we show that fitness and immunity properties have driven the modern evolution of Dscam1 isoform diversity. We assess multiple aspects of fly fitness in deletion mutants harboring exon 4, 6, or 9 clusters, respectively, reducing ectodomain isoform diversity stepwise from 18,612 to 396. All fitness-related traits generally improved as the potential number of isoforms increased; however, the magnitude of the changes varied remarkably in a variable cluster-specific manner. Correlation analysis revealed that fitness-related traits were much more sensitive to reductions in Dscam1 diversity compared to canonical neuronal self/non-self discrimination. We conclude that the role of Dscam1 isoforms in canonical neuronal self-avoidance and self/non-self discrimination is mediated by a small fraction of all isoforms (<1/10), whereas a separate role essential for other developmental contexts and resistances, likely in fitness and immunity, requires almost full isoform diversity. Thus, fitness and immunity properties, rather than canonical neuronal functions, are the dominant drivers during the modern diversification of the Dscam1 isoform. Our findings suggest that Dscam1 diversity is closely linked to adaptation and species diversification in arthropods.


Conflict of interest statement

The authors have declared that no competing interests exist.

Figures

Fig 1
Fig 1. Dscam1 gene structure and isoform diversity in pancrustacean species, also see S1 Fig.
(A) Schematic diagrams of Drosophila melanogaster Dscam1 gene and protein structure. The variable exons or domains are shown in color, while the constant exons or domains are shown in gray. (B) Phylogenetic distribution of Dscam1 isoform diversity. A phylogenetic tree of Pancrustacean species is shown in the lower panel. Upper panel: distribution of the number of exons in variable exon 4, exon 6, or exon 9 clusters in Pancrustacean species, with variable exon clusters shown in different colors. Middle panel: distribution of the number of potential ectodomains diversity, where species with a special number of diversities are highlighted. (C) The distribution of the number of variable exons 4, 6, and 9 in different evolutionary representative clades is shown, respectively. (D) Correlation analysis between the number of variable exons or the ectodomain diversity and the genome size in 178 species. (E) Pairwise correlation analysis of exon numbers between variable exon clusters, and three-dimensional correlation analysis of the number of exons 4, 6, and 9. The data underlying this figure can be found in S1 Data.
Fig 2
Fig 2. Reducing Dscam1 diversity affects fly fecundity in a cluster-specific manner, also see S2–S5 Figs.
(A) Schematic diagram of mutants with reduced Dscam1 diversity in exon 4, 6, or 9 clusters, respectively. The potential ectodomains diversity and the number of mutants are shown on the right. (B) Schematic diagrams of the phenotypes assessed in each mutant. Phenotypes were assessed in different development contexts and stressed conditions, including reproduction, viability, lifespan, and immune responses. (C–E) The fecundity of wild-type and Dscam1 mutants with deletion of variable exon 4 (C), exon 6 (D), and exon 9 (E) were assessed, respectively. The numbers in parentheses refer to the number of mating pairs of male and female flies that were analyzed. The number of remaining variable exons of each mutant is shown at the bottom. ns, not significant; *P < 0.05; **P < 0.01; ***P < 0.001 (one-way ANOVA with Dunnett’s test). (F) The mean egg laid per day in each genotype was linearly fitted to the number of variable exons 4, exon 6, or exon 9, respectively. The 95% confidence intervals for the linear fit are shown with shading. (G) The mean egg laid per day in each genotype was linearly fitted to the ectodomain diversity. Different variable clusters of mutants are shown as dots of different colors. (F, G) Pairwise comparisons (one-way ANOVA with Tukey’s test) were performed on the fecundity of a single variable exon mutants (F) or the two variable exon mutants (G), respectively. The data underlying this figure can be found in S1 Data.
Fig 3
Fig 3. Reducing Dscam1 diversity decreases adult lifespan in a cluster-specific manner, also see S6 and S7 Figs.
(A–C) The survival curves of male and female mutants of exon 4 (A), exon 6 (B), and exon 9 (C) are shown. The remaining number of variable exons are shown on the right. (D) The mean lifespan of adult flies was linearly fitted to the number of variable exons 4, exon 6, or exon 9, respectively. The 95% confidence intervals for the linear fit are shown with shading. (E) The mean lifespan of adult flies was linearly fitted to the ectodomain diversity. Different variable clusters of mutants are shown as dots of different colors. (F) The comparison of the mean female lifespan between the wild-type and DscamSingle4.x, DscamSingle6.y, and DscamSingle9.z mutants. ns, not significant; ***P < 0.001 (one-way ANOVA with Dunnett’s test). (G, H) Pairwise comparisons (one-way ANOVA with Tukey’s test) were performed on the lifespan of a single variable exon mutants (G) or the two variable exon mutants (H), respectively. The data underlying this figure can be found in S1 Data.
Fig 4
Fig 4. Reducing Dscam1 diversity affects fly fitness traits.
(A) Schematic diagram summarizing the correlation of Dscam1 diversity with fitness traits of fly viability, fecundity, and lifespan. (B) Correlation analysis between the fitness of genotypes and the number of variable exons in variable exon 4, 6, or 9 clusters, respectively. The fitness traits of Dscam1 mutants are normalized to wild-type which was set to 1. (C) Correlation analysis between the fitness of mutants and the potential ectodomain diversity. (D) The comparison of the fitness between the wild-type and DscamSingle4.x, DscamSingle6.y, and DscamSingle9.z mutants. The data underlying this figure can be found in S1 Data.
Fig 5
Fig 5. Reducing the Dscam1 diversity affects adult survival upon Metarhizium robertsii infection, also see S8 and S9 Figs.
(A–C) The survival curves after infection upon Triton or M. robertsii for wild-type and exon 4 (A), exon 6 (B), and exon 9 (C) mutants are shown, respectively. The Triton groups (control) are represented by solid lines, while the M. robertsii groups are represented by dashed lines. (D, E) The mean survival days in the first 25 days of the infection group and the log2-transformed survival rates of M. robertsii infection group/blank group were linearly fitted to the number of variable exons 4, exon 6, exon 9 (D), or ectodomains (E), respectively. The 95% confidence intervals for the linear fit are shown with shading. (F) The comparison of the mean survival days in the first 25 days of the infection group between the wild type and the exon 4 mutants. Pairwise comparisons (one-way ANOVA with Tukey’s test) of were performed on the survival days of a single variable exon 4 or two variable exon 4 mutants, respectively. (G) The comparison of the mean log2 value between the wild type and the exon 4 mutants. Pairwise comparisons (one-way ANOVA with Tukey’s test) were performed on the mean log2 value of a single variable exon 4 or the two variable exon 4 mutants, respectively. ns, not significant; *P < 0.05; **P < 0.01; ***P < 0.001. The data underlying this figure can be found in S1 Data.
Fig 6
Fig 6. Reducing the Dscam1 diversity affects adult survival upon Beauveria bassiana infection, also see S10 and S11 Figs.
(A–C) Survival curves after Triton or B. bassiana infection for wild-type and exon 4 (A), exon 6 (B), and exon 9 (C) mutants are shown, respectively. The Triton groups (control) are represented by solid lines, while the B. bassiana groups are represented by dashed lines. (D, E) The mean survival days in the first 25 days of the infection group and the log2-transformed survival rates of B. bassiana infection group/blank group were linearly fitted to the number of variable exons 4, exon 6, exon 9 (D) or ectodomains (E), respectively. The 95% confidence intervals for the linear fit are shown with shading. (F) Correlation analysis between the mean survival days in the first 25 days of exon 4, 6, or 9 mutants upon Metarhizium robertsii and B. bassiana infection, respectively. (G) Correlation analysis between the log2-transformed survival rates of infection group/blank group of exons 4, 6, or 9 mutants upon M. robertsii and B. bassiana infection, respectively. The data underlying this figure can be found in S1 Data.
Fig 7
Fig 7. Reducing the Dscam1 level rescues the phenotype defect caused by reducing Dscam1 diversity, also see S12 Fig.
(A) Comparison of the fly fecundity, the mean lifespan of adult flies, and fitness between the Dscam1 mutants carrying two copies (Mu/Mu) or one copy (Mu/null) of the mutant allele. The mutants of DscamΔ4.10, DscamΔ4.1-4.5, DscamΔ4.1-4.9, DscamΔ4.1-4.10, DscamSingle4.3, and DscamSingle4.10 in variable exon 4 cluster, DscamΔ6.36, DscamΔ6.21-6.30, DscamΔ6.30-6.48, DscamΔ6.17-6.48, DscamΔ6.4-6.47, DscamΔ6.2-6.47, DscamSingle6.6, and DscamSingle6.7 in variable exon 6 cluster, DscamΔ9.7, DscamΔ9.30-9.33, DscamΔ9.7-9.18, DscamΔ9.14-9.24, DscamΔ9.1-9.30, DscamSingle9.1, and DscamSingle9.13 in variable exon 9 cluster were examined. Reducing the Dscam1 expression level partially rescued the fly fecundity, lifespan, and fitness traits in homozygous mutants. (B) The comparisons of the log2-transformed survival rates of the infection group/blank group between the Dscam1 mutants with one copy or two copies of the mutant allele upon Metarhizium robertsii and Beauveria bassiana infection, respectively. Reducing the Dscam1 expression level partially rescued the survival rates upon M. robertsii and B. bassiana infection in homozygous mutants. ns, not significant; *P < 0.05; **P < 0.01; ***P < 0.001 (Student t test, two-tailed). The data underlying this figure can be found in S1 Data.
Fig 8
Fig 8. Fitness and immunity drive the modern expansion of Dscam1 diversity.
(A) Summary of correlation analysis for different phenotypes resulting from reduced Dscam1 diversity. Class I-III overlap phenotype–diversity correlation was from our previous studies [23,32]. Unexpectedly, correlation analysis revealed that fitness-related traits and immunity properties are much more sensitive to the reduction of Dscam1 diversity than nervous traits. (B) Comparison of the fitness and the canonical neuronal self/non-self discrimination in the sensitivity of the Dscam1 diversity. Phenotype–diversity correlation analysis from our previous study revealed that 2,000 isoforms are sufficient to sustain normal neuronal self/non-self discrimination in dendritic arborization (da) neurons [23]. Thus, we conclude that the role of Dscam1 isoforms in canonical neuronal self-avoidance is mediated by a small fraction of all isoforms (<1/10), whereas a separate role essential for other development contexts, likely in fitness, requires more isoform diversity. (C) A comparison of the fitness-diversity correlations in Dscam1 exon 4, 6, and 9 clusters showed a cluster-specific manner. (D) Reducing the Dscam1 level affected the fitness-diversity correlations. (E) Proposed evolutionary trajectories of Dscam1 in arthropod species. Exon 9 duplication originated before the divergence of Myriapoda and Pancrustacea, while variable exon 4 and 6 duplications emerged in the Pancrustacea ancestor. ~2,000 Dscam1 isoforms are sufficient to maintain neuronal self/non-self discrimination. During early pancrustacean evolution, it is likely that neuronal self/non-self discrimination might drive the duplication of exons 4, 6, and 9 of ancestral Dscam1 to attain 2,000 isoforms. When Dscam1 isoforms exceeded 2,000, neuronal self/non-self discrimination was no longer the main driver for Dscam1 isoform expansion. Instead, our data indicate that productivity-related traits and immunity are possibly the main drivers for the modern evolution of isoform diversity.

Update of

References

    1. Schmucker D, Clemens JC, Shu H, Worby CA, Xiao J, Muda M, et al. Drosophila Dscam is an axon guidance receptor exhibiting extraordinary molecular diversity. Cell. 2000;101(6):671–84. doi: 10.1016/s0092-8674(00)80878-8 - DOI - PubMed
    1. Dong H, Li J, Wu Q, Jin Y. Confluence and convergence of Dscam and Pcdh cell-recognition codes. Trends Biochem Sci. 2023;48(12):1044–57. doi: 10.1016/j.tibs.2023.09.001 - DOI - PubMed
    1. Wojtowicz WM, Wu W, Andre I, Qian B, Baker D, Zipursky SL. A vast repertoire of Dscam binding specificities arises from modular interactions of variable Ig domains. Cell. 2007;130(6):1134–45. doi: 10.1016/j.cell.2007.08.026 - DOI - PMC - PubMed
    1. Wu W, Ahlsen G, Baker D, Shapiro L, Zipursky SL. Complementary chimeric isoforms reveal Dscam1 binding specificity in vivo. Neuron. 2012;74(2):261–8. doi: 10.1016/j.neuron.2012.02.029 - DOI - PMC - PubMed
    1. Wojtowicz WM, Flanagan JJ, Millard SS, Zipursky SL, Clemens JC. Alternative splicing of Drosophila Dscam generates axon guidance receptors that exhibit isoform-specific homophilic binding. Cell. 2004;118(5):619–33. doi: 10.1016/j.cell.2004.08.021 - DOI - PMC - PubMed

MeSH terms

LinkOut - more resources