. 2025 Sep 12;11(37):eadz8980.
doi: 10.1126/sciadv.adz8980. Epub 2025 Sep 12.

Elucidating the mechanism by which HIV-1 nucleocapsid mutations confer resistance to integrase strand transfer inhibitors

Affiliations

Elucidating the mechanism by which HIV-1 nucleocapsid mutations confer resistance to integrase strand transfer inhibitors

Yuta Hikichi et al. Sci Adv. .

Abstract

Persons with HIV (PWH) receiving integrase (IN) strand transfer inhibitors (INSTIs) have been reported to experience virologic failure (VF) in the absence of resistance mutations in IN. We previously reported that mutations in the viral nucleocapsid (NC) are selected in the presence of the INSTI dolutegravir (DTG). Here, we show that these NC mutations accelerate the kinetics of viral DNA integration, suggesting that they limit the window of time available for INSTIs to block viral DNA integration. We find that in primary peripheral blood mononuclear cells, HIV-1 acquires mutations in the viral envelope glycoprotein, NC, and occasionally IN during selection for INSTI resistance. Notably, the selected NC and IN mutations act in concert to reduce the susceptibility of the virus to INSTIs. These results provide insights into the mechanism by which HIV-1 escapes the inhibitory activity of INSTIs and underscore the importance of genotypic analysis outside IN in PWH experiencing VF on INSTI-containing drug regimens.


Figures
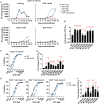
Fig. 1.
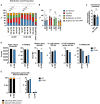
Fig. 1.. NC mutations reduce the susceptibility of HIV-1 to DTG in T cells.
(A) Replication kinetics of the indicated NL4-3 variants in the SupT1 T cell line in the absence or presence of DTG. Replication curves obtained in the presence of 0, 1, 3, and 10 nM DTG are shown. Data are representative of three independent experiments. (B) Fold changes in IC50 relative to the WT were calculated over a range of DTG concentrations (0.01 to 300 nM). IC50 values were calculated on the basis of the AUC of the replication kinetics. Fold changes in IC50 are shown above the graph. *P < 0.05, one-sample t test. (C and D) DTG sensitivity of the NC mutants in the SupT1 T cell line. SupT1 T cells were incubated with RT-normalized VSV-G–pseudotyped nanoLuc reporter HIV-1 in the presence of various concentrations of DTG. Nano luciferase activity was measured at 48 hours postinfection. Data from at least three independent experiments are shown as means ± SEM. Fold changes in IC50 are shown in (D). *P < 0.05, one-sample t test. (E) DTG sensitivity of the NC mutants in primary human CD4+ T cells. Primary CD4+ T cells from three healthy donors were incubated with RT-normalized VSV-G–pseudotyped nanoLuc reporter HIV-1 in the presence of varying concentrations of DTG. Nano luciferase activity was measured at 48 hours postinfection. Error bars indicate the SE of the duplicate infection. (F) Fold changes in IC50 based on the data in (E). Data are shown as means ± SEM. *P < 0.05, unpaired t test. ns, not significant.
Fig. 2.
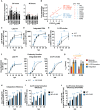
Fig. 2.. Sequencing analysis of NC-mutant 2-LTR junctions.
(A) Frequency distribution of 2-LTR junction categories (consensus GTAC, insertion, deletion, subsitutions in GTAC, and extended U3 with 3′PPT) in cells infected with WT HIV-1 or the indicated mutants. The chi-square test was used to compare overall trends in modified 2-LTR junction frequencies (*P < 0.05). (B) Comparison of specific 2-LTR junction categories between WT and NC-G19S mutant. Data represent means ± SEM from four to five independent experiments. Statistical significance was determined using unpaired t test (ns, not significant). (C) Fold increase in the consensus sequence frequency at 2-LTR circle junctions in IN-D116N variants compared to WT-IN variants. Statistical significance was evaluated using an unpaired t test (ns, not significant). (D) Integration site (IS) frequency in cells infected with WT or NC-G19S. The total number of unique ISs, gene density within a 1-Mb region surrounding each IS, and the frequency of integration within RefSeq genes (genes annotated in the National Center for Biotechnology Information Reference Sequence Database), CpG islands (±2 kb), transcription start sites (TSS) of RefSeq genes, speckle-associated domains (SPADs), and lamina-associated domains (LADs) are shown. The binomial test was used to compare WT and NC-G19S (*P < 0.05). (E) The frequency of the integration events with canonical and aberrant viral DNA ends at 5′LTR and 3′LTR. The binomial test was used to compare WT and NC-G19S (*P < 0.05).
Fig. 3.
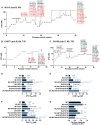
Fig. 3.. The NC-G19S mutant accelerates 2-LTR circle formation and viral DNA integration.
(A) RT-normalized WT and NC-mutant virus stocks were used to infect TZM-bl cells. Relative infectivity of the indicated NC mutants compared to WT at 24 and 48 hours is shown. Statistical significance is shown (*P < 0.05) as determined by a one-sample t test. (B) Correlation between the relative infectivity at the indicated time points and the DTG IC50. DTG IC50 was measured at 48 hours postinfection (hpi) [mean IC50 values were previously described (49)]. SupT1 T cells were exposed to Env(−), DNase I–treated, VSV-G–pseudotyped WT or NC-G19S virus particles, and the indicated viral DNA species were quantified by qPCR. The cellular DNA was extracted at the indicated time points and subjected to qPCR using U5/gag primers for (C) late reverse transcription products (late RT), (D) Alu-LTR primers for integrated DNA, and (E) 2-LTR junction for 2-LTR circles. (F) Kinetics of each postentry step. The values obtained by the qPCR experiments were normalized to the signals at 24 hpi. Time to complete 50% reactions are shown in (G). The data are shown as mean ± SEM from more than three independent experiments with statistical significance indicated (*P < 0.05) as per unpaired t test. (H) The ratio of integrated DNA to the total late RT product at the indicated time point. (I and J) The ratio of 2-LTR circles to the total late RT product at the indicated time point of (I) IN-WT and (J) IN-deficient (IN-D116N) viruses. The data are shown as means ± SEM from at least three independent experiments with statistical significance indicated (*P < 0.05) as per unpaired t test. R2, coefficient of determination; h, hours; t1/2, half-time.
Fig. 4.
Fig. 4.. NC mutants shorten the time between completion of reverse transcription and viral DNA integration.
(A and B) TOA assay using TZM-bl cells. Drugs were added at the indicated hpi. Luciferase signals were normalized to the signals at 24 hpi. Time to 50% loss of inhibition (t1/2) for the indicated drugs is shown in (B). The data are shown as means ± SEM from more than three independent experiments with statistical significance indicated (*P < 0.05) as per mixed-effects model with the two-stage step-up method of Benjamini, Krieger, and Yekutieli. (C) Differences in t1/2 for the indicated drugs between WT and the indicated NC mutants. (D) Differences in Δt1/2 (the difference in t1/2 between DTG and other drugs) between WT and the indicated NC mutants. Box plots show median, interquartile range, and minimum and maximum values. The mean value is indicated by a “+.” Statistical significance is shown (*P < 0.05) as determined by a one-sample t test. (E) Time of addition assay in the SupT1 T cell line. SupT1 cells were infected with VSV-G–pseudotyped mScarlet reporter virus, followed by the addition of RPV and DTG at the indicated time points. mScarlet expression at the indicated time points was normalized to the signals at 48 hpi. t1/2 for the indicated drugs is shown below the graph. (F) The difference between t1/2 (RPV) and t1/2 (DTG). The data are shown as means ± SEM from more than three independent experiments with statistical significance indicated (*P < 0.05) as per unpaired t test. (G) Percentage of nuclear HIV-1 cores that disappeared during live-cell imaging for the indicated virus in HeLa cells. (H) Time after infection until disappearance of GFP-CA in the nucleus. The total particle counts from three independent experiments are shown below the graph. Fischer’s exact and Mann-Whitney U tests were conducted for [(G) and (H)], respectively.
Fig. 5.
Fig. 5.. Selection of DTG-resistant variants in PBMCs.
Long-term passaging of (A) NL4-3, (B) CH077, and (C) CH185 molecular clones in the presence of DTG. Activated PBMCs were infected with the indicated viruses to initiate the passaging experiments. At the time points indicated by the arrows, genomic DNA was extracted from the drug-treated cultures, and the Gag-Pol and Env-Nef coding regions were sequenced. Mutations detected at frequencies greater than 25% in the bulk sequencing are shown. Mutations highlighted in bold are established DTG resistance mutations in IN. N.D., not determined. (D) DTG, (E) CAB, and (F) RAL sensitivity of the NL4-3 NC/IN variants identified during long-term passaging of NL4-3 in the presence of DTG (A). TZM-bl cells were incubated with RT-normalized viruses in the presence of various concentrations of the indicated INSTIs. (G) Cell-free infectivity of NL4-3 NC and IN variants in TZM-bl cells. Relative infectivity is shown, normalized to 1 for WT NL4-3. The data are shown as means ± SEM from >3 independent experiments. Statistical significance between variants with and without the NC mutation was determined using an unpaired t test, with significance indicated as *P < 0.05. For [(D) to (G)], (*) and (ns) indicate comparisons with the WT.

Update of

References

    1. Gandhi R. T., Bedimo R., Hoy J. F., Landovitz R. J., Smith D. M., Eaton E. F., Lehmann C., Springer S. A., Sax P. E., Thompson M. A., Benson C. A., Buchbinder S. P., Del Rio C., Eron J. J. Jr., Gunthard H. F., Molina J. M., Jacobsen D. M., Saag M. S., Antiretroviral drugs for treatment and prevention of HIV infection in adults: 2022 Recommendations of the international antiviral society-USA panel. JAMA 329, 63–84 (2023). - PubMed
    1. Clutter D. S., Jordan M. R., Bertagnolio S., Shafer R. W., HIV-1 drug resistance and resistance testing. Infect. Genet. Evol. 46, 292–307 (2016). - PMC - PubMed
    1. World Health Organization, HIV drug resistance: Brief report 2024, (2024); https://www.who.int/publications/i/item/9789240086319.
    1. Chen H., Wei S. Q., Engelman A., Multiple integrase functions are required to form the native structure of the human immunodeficiency virus type I intasome. J. Biol. Chem. 274, 17358–17364 (1999). - PubMed
    1. Hare S., Gupta S. S., Valkov E., Engelman A., Cherepanov P., Retroviral intasome assembly and inhibition of DNA strand transfer. Nature 464, 232–236 (2010). - PMC - PubMed