. 2025 Sep;13(17):e70514.
doi: 10.14814/phy2.70514.

The impact of Asic2 deletion on metabolic homeostasis in mice

Affiliations

The impact of Asic2 deletion on metabolic homeostasis in mice

Madison Hamby et al. Physiol Rep. 2025 Sep.

Abstract

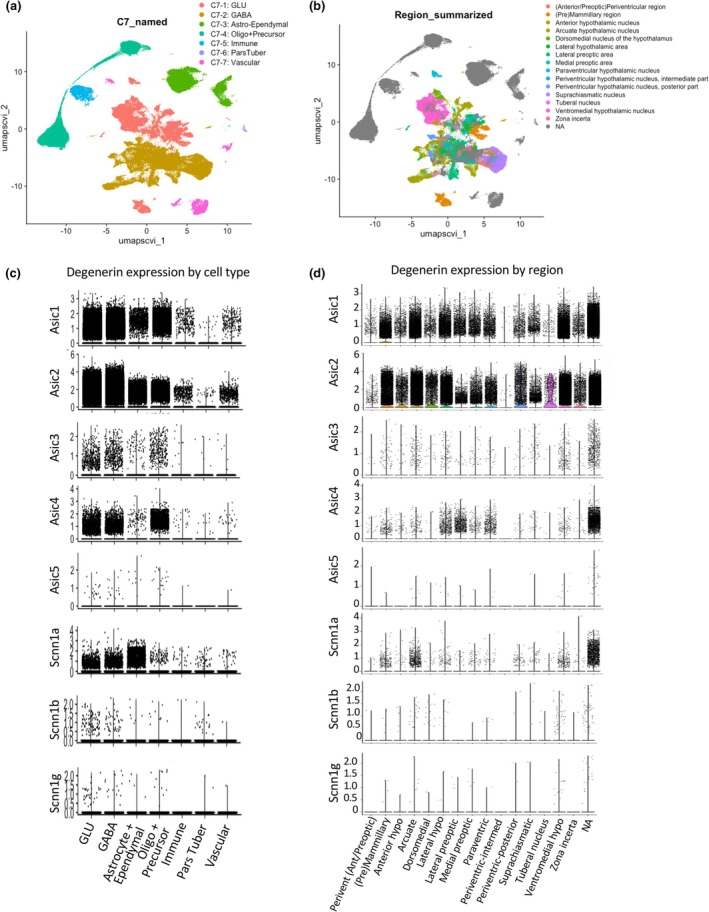
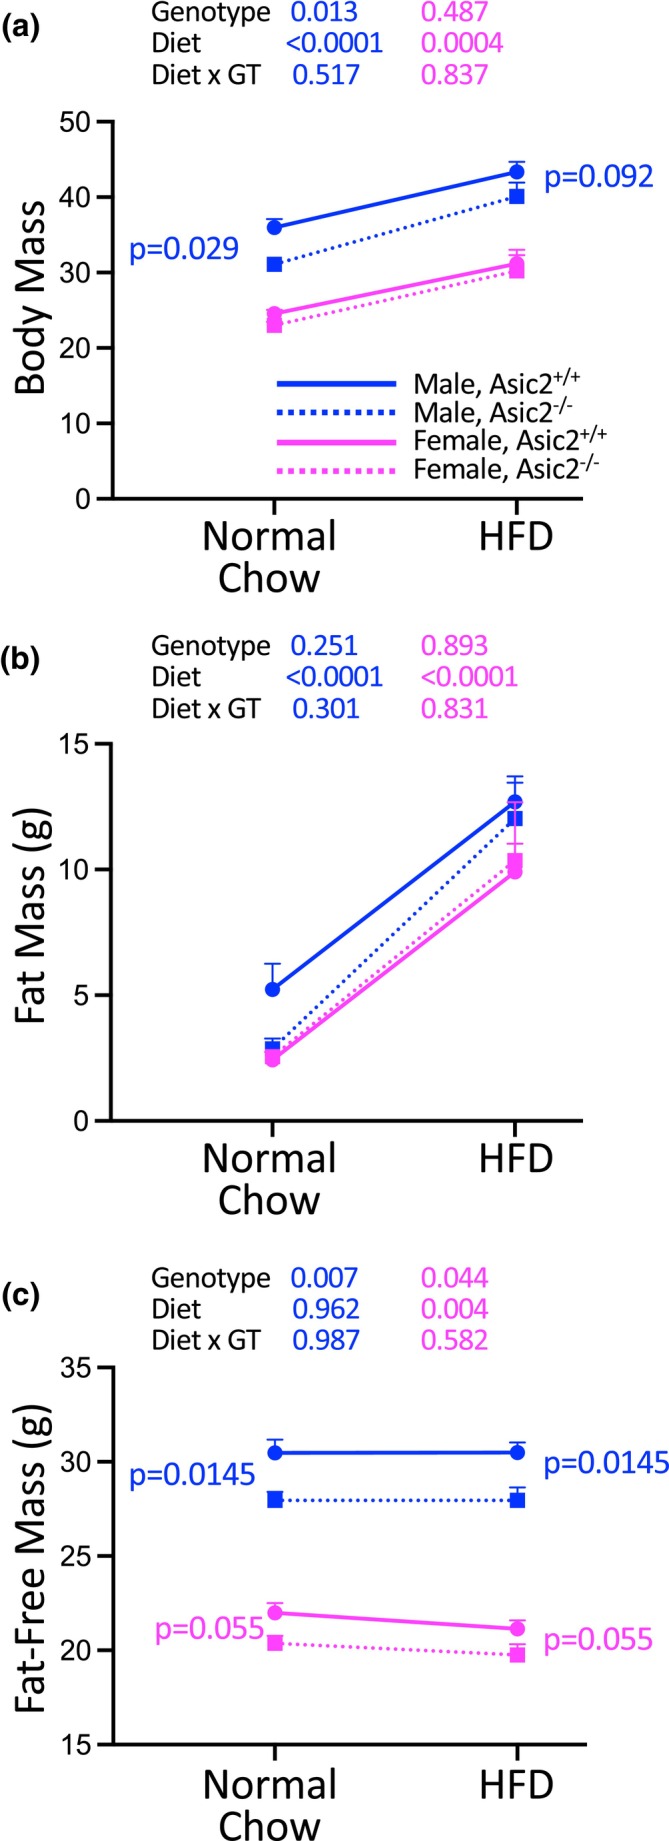
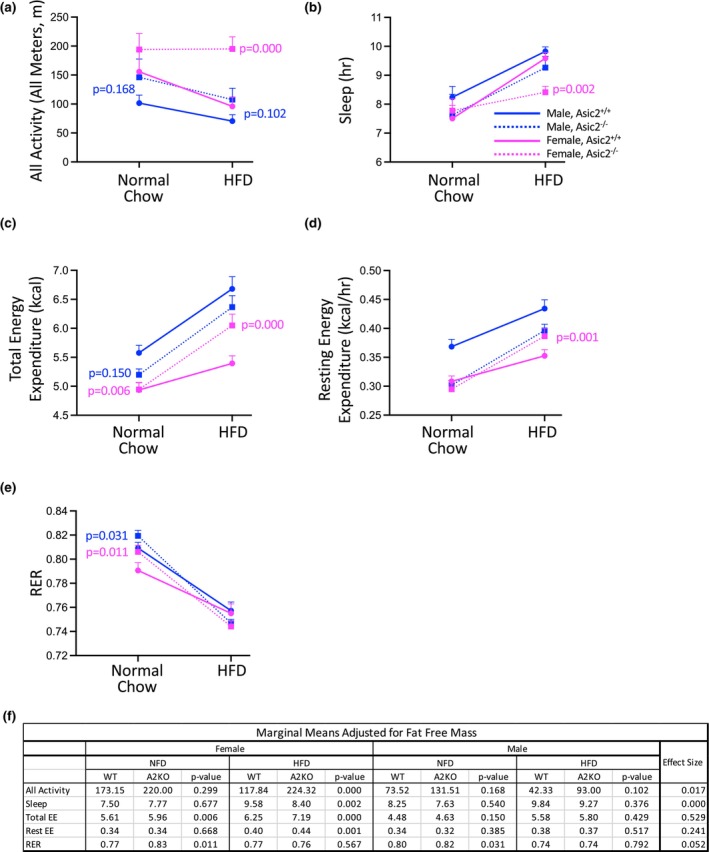
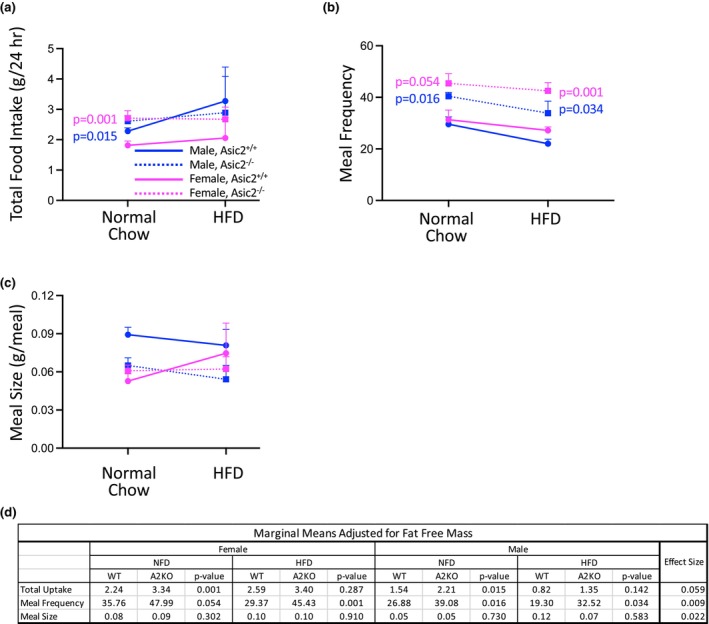
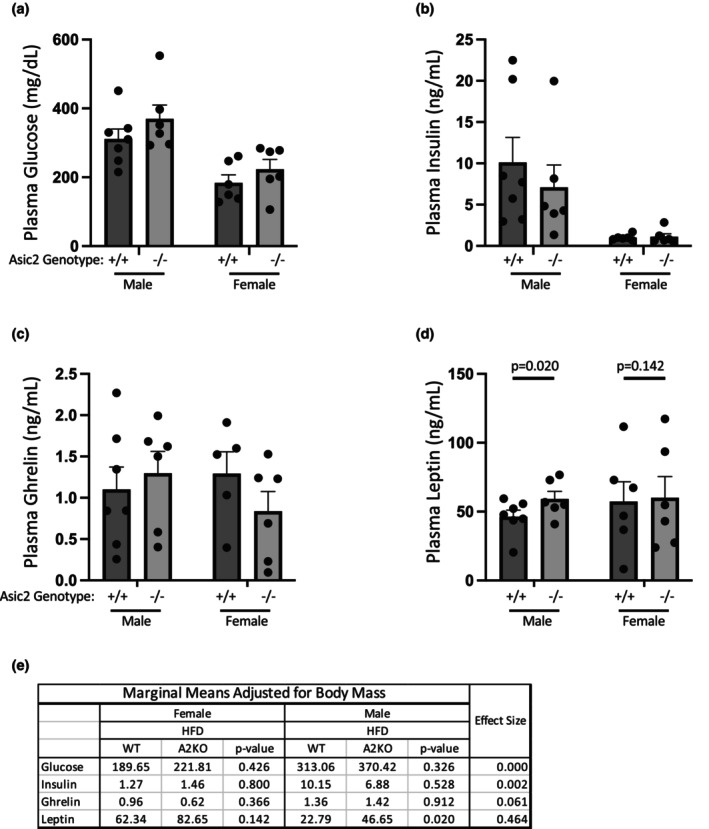
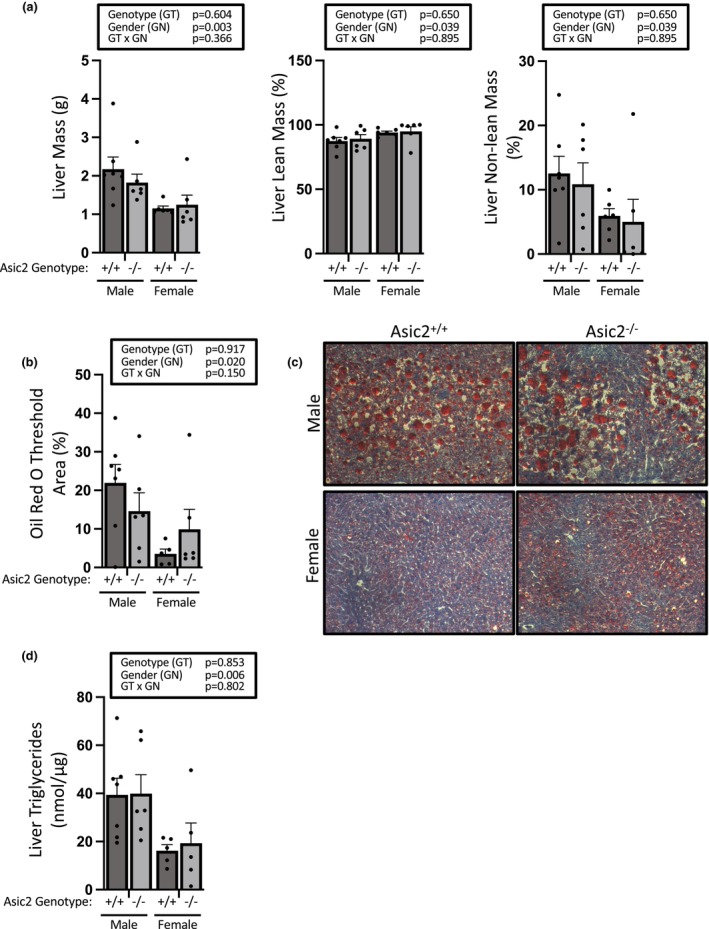
Acid-Sensing Ion Channel 2 (Asic2) is expressed in many brain regions, including the hypothalamus, the homeostatic center for hunger-satiety-energy expenditure. We used the HypoMap reference atlas of the mouse hypothalamus to localize Asic2 message in the specific hypothalamic regions and found that Asic2 is the predominant degenerin subunit expressed in mouse hypothalamic neurons in the ventromedial, lateral, and arcuate regions and is expressed in pro-opiomelanocortin (Pomc), agouti-related peptide (Agrp), as well as leptin (Lepr) and insulin receptors (Insr) positive neurons. Thus, we investigated if Asic2 plays an important role in body weight control and energy expenditure before and after high-fat diet (HFD). Asic2-/- male mice had lower lean body mass. On normal chow, Asic2-/- mice consumed more food, displayed elevated total energy expenditure, and a higher respiratory exchange ratio compared to WT mice. On the HFD, Asic2-/- female mice had greater motor activity and resting and total energy expenditure. We found no effect of genotype on plasma glucose, insulin, or ghrelin levels; however, leptin was elevated in male Asic2-/- mice following the HFD. Our findings suggest that Asic2 plays an important role in metabolic homeostasis, possibly through regulation of central pathways involved in energy balance.

Keywords: degenerin; diet induced obesity; energy balance.


Figures

FIGURE 1
FIGURE 1
Seurat analysis of HypoMap dataset to determine degenerin subunit expression in the mouse hypothalamus. The HypoMap data set and a user‐friendly explorer tool are available at https://cellxgene.cziscience.com/collections. RDS file was downloaded from the Apollo Repository hosted by Cambridge University (https://www.repository.cam.ac.uk/items/8f9c3683‐29fd‐44f3‐aad5‐7acf5e963a75). (a) Dimensional reduction plot of cluster identification by cell type (“C7_named”). (b) Dimensional reduction plot identifying region (“Region_summarized”). (c) Violin plot showing expression of mammalian degenerins in different cell types. These data show degenerins are expressed in all cell types but are expressed to the greatest extent in glutamatergic and gabaergic neurons, followed by astrocytes and oligodendrocytes. (d) Violin plots showing expression of mammalian degenerins in 16 regions. “NA” refers to cells where no marker was present to identify localization, that is, oligodendrocytes, astrocytes, tanycytes, and ependymal cells. UMAP, universal manifold approximation and projection. Script: (1A) DimPlot(hypoMap, group.by = “C7_named”, label = FALSE). (1B) DimPlot(hypoMap, group.by = “Region_summarized”, label = FALSE). (1C) VlnPlot(object = hypoMap, features = “Asic1”, group.by = “C7_named”). (1D) VlnPlot(object = hypoMap, features = “Asic1”, group.by = “Region_summarized”). #Other gene target names: Asic2, Asic3, Asic4, Asic5, Scnn1a, Scnn1b, Scnn1g.
FIGURE 2
FIGURE 2
(a) A dot plot showing the percent neurons expressing Asic1‐5 and Scnn1a, b, and g in hypothalamic regions. Asic2, followed by Asic1, is the most abundantly expressed degenerin message in the mouse hypothalamus, with both Asic1 and Asic2 predominantly expressed in the premammillary, arcuate, lateral hypothalamus, and ventromedial hypothalamus regions. The periventricular‐intermediate region has the fewest Asic1/2 positive cells. “NA” refers to cells where no marker was present to identify localization, that is, oligodendrocytes, astrocytes, tanycytes, and ependymal cells. (b) Feature plot of Asic2 expression in the hypothalamic cell population. (c) Feature plot of Asic2 expression in the arcuate neuron population. Argp and Pomc clusters are identified. Script: (2A) DotPlot(hypoMap, features = “Asic1”, split.by = “Author_Region”, cols = “Greys”). #Individual DotPlots also generated for Asic2, Asic3, Asic4, Asic5, Scnn1a, Scnn1b, Scnn1g. (2B) FeaturePlot(hypoMap, feature = “Asic2”, raster = TRUE, raster.dpi =c(512, 512), label = FALSE). (2C) hypoMap <‐ SetIdent(hypoMap, value = “Region_summarized”). AHN_subset <‐ subset(x = hypoMap, idents = “Arcuate hypothalamic nucleus”). FeaturePlot(AHN_subset, features = “Asic2”, raster = TRUE, raster.dpi =c(512, 512), label = FALSE).
FIGURE 3
FIGURE 3
Is leptin sensitivity reduced in Asic2−/− mice? (a) Overall, food consumption was greater in Asic2−/− mice (main effect of genotype p = 0.0141) and leptin suppressed food consumption (p < 0.0001). (b) The reduction in food consumption between leptin and saline was not different between groups. (c) However, Asic2−/− mice did not lose as much weight as WT mice measured 24 h following the leptin treatments. Sample sizes for the leptin study were n = 4 for both genotypes, females only. Food consumption data were analyzed using a three‐ or two‐way repeated measures ANOVA where appropriate. Body weight changes were analyzed using a two‐way repeated measures ANOVA. ANOVA tests were followed by a Fisher's LSD post hoc test; p values for main factors, interactions, and apriori group‐to‐group comparisons are shown for all graphs.
FIGURE 4
FIGURE 4
Asic2−/− mice have lower fat‐free mass before and after a 5‐week high‐fat diet. Body composition was measured by Echo MRI at 16 weeks of age and again following 5 weeks of a HFD (60% kcal fat). Body mass (a), fat mass (b), and fat‐free mass (c) are shown in male (blue) and female (magenta), and WT (solid line) and Asic2−/− (dashed line) animals, n = 6–7 animals/group. Body mass and fat‐free mass are lower in Asic2−/− male mice, regardless of diet. Fat‐free mass is also lower in Asic2−/− female mice, regardless of diet. Data are shown for male (blue) and female (magenta), and WT (solid line) and Asic2−/− (dashed line) animals, n = 6–7 animals/group. Data represent mean ± SEM were analyzed using a repeated two‐way ANOVA for male and female groups, followed by the Fisher Post Hoc test (p values for where p < 0.200 are shown on panel). HFD, high‐fat diet.
FIGURE 5
FIGURE 5
Effect of a normal chow and high fat diet on motor activity, sleep, total and resting energy expenditure, and RER in WT and Asic2−/− mice. Absolute values are shown in (a)–(e) and modified means adjusted for fat‐free mass, p values, and effect size are shown in (f). (a) Motor activity was quantified as all movement in X, Y, and Z planes at 16 weeks of age and after a 5‐week HFD. Asic2−/− mice are more active than WT on both diets. Motor activity was greater in male Asic2−/− mice on normal chow. The HFD suppressed motor activity in male and female WT and male Asic2−/− mice, but not in female Asic2−/− mice. (b) Sleep, quantified as lack of movement for >60 s, was not different overall. The HFD increased sleep in both genotypes. Sleep was reduced in female Asic2−/− mice compared to WT following the 5‐week HFD, consistent with the increased activity with HFD in this group. (c) Total energy expenditure was elevated in Asic2−/− females, and trended higher in males, compared to WT counterparts on normal chow. Following HFD total energy expenditure was increased to a greater extent in the Asic2−/− female group. (d) Resting energy expenditure, an estimate of basal metabolic rate, was identical in Asic2−/− female mice while on the normal chow. Resting energy expenditure was increased to in the Asic2−/− female group. (e) The RER was higher in Asic2−/− male and female mice on normal chow. RER was lowered in all groups following the HFD but was not different between genotypes. Data are shown for male (blue) and female (magenta), and WT (solid line) and Asic2−/− (dashed line) animals, n = 5–7 animals/group and represent mean ± SEM. (f) Modified means adjusted for fat‐free mass, p values, and effect size were calculated using covariate analysis. Fat‐free mass impacted marginal means than body mass. HFD, high‐fat diet; RER, respiratory exchange ratio.
FIGURE 6
FIGURE 6
Effect of a normal chow and high fat diet on 24‐h food consumption patterns in WT and Asic2−/− mice. Absolute values are shown in (a)–(c) and modified means adjusted for fat‐free mass, p values, and effect size are shown in (d). (a) Asic2−/− mice ate more food in a 24 h period than WT mice when fed normal chow, but not following HFD. (b/c) Meal frequency, but not size, was increased in Asic2−/− mice. Data are shown for male (blue) and female (magenta), and WT (solid line) and Asic2−/− (dashed line) animals, n = 5–7 animals/group. Data represent mean ± SEM. (d) Modified means adjusted for fat‐free mass, p values, and effect size were calculated using covariate analysis. HFD, high‐fat diet.
FIGURE 7
FIGURE 7
Plasma glucose, insulin, and ghrelin, but not leptin, were not different in WT versus Asic2−/− mice. Plasma samples were collected after 5 weeks on a 60% kcal HFD. Samples were analyzed for glucose (a), insulin (b), ghrelin (c), and leptin (d) using ELISA. Modified means adjusted for fat‐free mass, p values, and effect size were calculated using covariate analysis (e). Leptin trended higher in females and was higher in male Asic2−/− mice. Absolute data are represented as mean ± SEM. Samples: plasma + EDTA. Analyzed by Analytic and Assay Core. Plasma leptin was analyzed using Crystal Chem (Cat #90030) ELISA assay. Plasma Glucose was measured using vet axel chemistry analyzer. Plasma insulin was measured using Cat #90080. Plasma ghrelin was measured using Millipore/Sigma Cat #EZRGRT‐91K ELISA.
FIGURE 8
FIGURE 8
Are Asic2−/− mice protected from hepatic steatosis? (a) Liver mass and Echo MRI quantitation of liver fat content indicates no difference in liver fat content in WT and Asic2−/− mice. (b/c/d) Liver triglyceride content and Oil Red O staining also demonstrate loss of Asic2 does not afford protection. The presence of steatosis is indicated by the elevated liver fat mass, fat droplets visible by microscopy, and liver triglyceride content. Data are mean ± SEM, n = 6–7. Data analyzed using two‐way ANOVA, followed by Fishers LSD test, all p values shown. No statistical differences between genotypes were found. A covariate analysis was also performed for all data, and no differences were identified.

References

    1. Ahdut‐Hacohen, R. , Duridanova, D. , Meiri, H. , & Rahamimoff, R. (2004). Hydrogen ions control synaptic vesicle ion channel activity in torpedo electromotor neurones. The Journal of Physiology, 556(Pt 2), 347–352. - PMC - PubMed
    1. Badmus, O. O. , Kipp, Z. A. , Bates, E. A. , da Silva, A. A. , Taylor, L. C. , Martinez, G. J. , Lee, W. H. , Creeden, J. F. , Hinds, T. D., Jr. , & Stec, D. E. (2023). Loss of hepatic PPARalpha in mice causes hypertension and cardiovascular disease. American Journal of Physiology. Regulatory, Integrative and Comparative Physiology, 325(1), R81–R95. - PMC - PubMed
    1. Barbaro, N. R. , Foss, J. D. , Kryshtal, D. O. , Tsyba, N. , Kumaresan, S. , Xiao, L. , Mernaugh, R. L. , Itani, H. A. , Loperena, R. , Chen, W. , Dikalov, S. , Titze, J. M. , Knollmann, B. C. , Harrison, D. G. , & Kirabo, A. (2017). Dendritic cell Amiloride‐sensitive channels mediate sodium‐induced inflammation and hypertension. Cell Reports, 21(4), 1009–1020. - PMC - PubMed
    1. Bassilana, F. , Champigny, G. , Waldmann, R. , de Weille, J. R. , Heurteaux, C. , & Lazdunski, M. (1997). The acid‐sensitive ionic channel subunit ASIC and the mammalian degenerin MDEG form a heteromultimeric H+‐gated Na+ channel with novel properties. The Journal of Biological Chemistry, 272(46), 28819–28822. - PubMed
    1. Belgardt, B. F. , Okamura, T. , & Bruning, J. C. (2009). Hormone and glucose signalling in POMC and AgRP neurons. The Journal of Physiology, 587(Pt 22), 5305–5314. - PMC - PubMed

LinkOut - more resources