. 2025 Sep 12;16(1):8268.
doi: 10.1038/s41467-025-63669-8.

Temporal control of human DNA replication licensing by CDK4/6-RB signalling and chemical genetics

Affiliations

Temporal control of human DNA replication licensing by CDK4/6-RB signalling and chemical genetics

Anastasia Sosenko Piscitello et al. Nat Commun. .

Abstract

Cyclin-dependent kinases (CDKs) coordinate DNA replication and cell division, and play key roles in tissue homeostasis, genome stability and cancer development. The first step in replication is origin licensing, when minichromosome maintenance (MCM) helicases are loaded onto DNA by CDC6, CDT1 and the origin recognition complex (ORC). In yeast, origin licensing starts when CDK activity plummets in G1 phase, reinforcing the view that CDKs inhibit licensing. Here we show that, in human cells, CDK4/6 activity promotes origin licensing. By combining rapid protein degradation and time-resolved EdU-sequencing, we find that CDK4/6 activity acts epistatically to CDC6 and CDT1 in G1 phase and counteracts RB pocket proteins to promote origin licensing. Therapeutic CDK4/6 inhibitors block MCM and ORC6 loading, which we exploit to trigger mitosis with unreplicated DNA in p53-deficient cells. The CDK4/6-RB axis thus links replication licensing to proliferation, which has implications for human cell fate control and cancer therapy design.


Conflict of interest statement

Competing interests: T.D.H. is the founder and stockholder of FoRx Therapeutics. The remaining authors declare no competing interests.

Figures

Fig. 1
Fig. 1. CDC6 and CDT1 depletion abolishes DNA replication initiation while allowing cell cycle progression.
a–e Rapid degradation of CDC6 and CDT1 prevents MCM loading but not mitotic entry (a), overview of key DNA replication initiation steps, including CDC6 and CDT1-mediated loading of MCM double hexamers to license replication origins. b schematic overview of RPE CDC6d CDT1d cell model (left) and immunoblot validating rapid, ADN-induced depletion of endogenously tagged CDC6 and CDT1 (right). Western blot experiments were independently repeated twice with similar results. c Immunoblotting of nucleoplasmic and chromatin fractions of RPE CDC6d CDT1d cells and its parental RPE controls upon 16-h mock (hyphen) or ADN treatment (blue drug logo). Representative blots are shown, with the experiment repeated twice independently with consistent results. Source data are provided as a Source Data file. d QIBC analysis simultaneously monitoring DNA synthesis (EdU incorporation) and nuclear Cyclin A2 levels in single RPE CDC6d CDT1d cells upon 24-h mock (grey) or ADN treatment (blue); Figure axes depict integrated fluorescence intensities (arb. units) per nucleus; >2300 cells per condition; dotted line highlights expected burst of DNA synthesis in early S-phase cells. Right panels depict representative IF images of early S phase cells, demonstrating undetectable EdU levels upon ADN treatment and near-saturated EdU signals upon mock treatment while using identical imaging conditions (e), mitotic cell fates of mock- or ADN-treated RPE CDC6d CDT1d cells, left panels illustrate representative DAPI images (upper panels) and schematic interpretation (bottom panels), while right panels depict representative confocal images of mitotic cells stained for Pericentrin (PCNT) and counterstained with DAPI; arrows indicate extruding paired sister chromatids (control condition) or single chromosomes (ADN condition); Scale bars, 5 μm.
Fig. 2
Fig. 2. CDC6 and CDT1 are needed throughout G1 phase to establish origin activity genome-wide.
a–f CDC6 and CDT1 are required in early and late G1 phase to promote DNA replication initiation genome-wide, a Experimental outline (top) and line graph (bottom) depicting the mean percentage of EdU-positive cells after mitotic release determined by FACS (n = 3 technical replicates, error bars indicate SD). b Experimental outline (left) and bar graph (right) depicting the mean percentage of EdU-positive cells 14 h after mitotic release for each condition (n = 3 technical replicates, error bars indicate SD). CDC6 and CDT1 are needed in early and late G1 phase to promote origin activity; c Outline of the experiment and corresponding replication initiation profiles (EdUseq-HU) at a representative genomic region in mock (grey) or ADN-treated (blue) cell populations and collected 16 h after mitotic shake-off. Bin resolution, 10 kb; scale bar, 200 kb; σ, sigma (normalised number of sequence reads per bin divided by its SD), lower tick σ = 100, higher tick σ = 200. d Average origin activity (i.e. mean σ values) at 1 Kb resolution around 1000 predefined, most active early S-phase origins after different ADN treatments (as outlined in b), e Outline of the experiment and corresponding replication initiation profiles (EdUseq-HU) at a representative genomic region in mock (grey) or ADN-treated (blue) cell populations and collected 16 h after mitotic shake-off. Bin resolution, 10 kb; scale bar, 200 kb; σ, sigma (normalised number of sequence reads per bin divided by its SD), lower tick σ = 100, higher tick σ = 200. f scatter plot comparing EdUseq-HU (σ) values at 1000 individual early S-phase origins after treatment M→4 or 4→S (as outlined in e). Linear regression fit (purple line) with coefficient of determination (R²) indicating the proportion of variance explained between the two datasets; slope significance determined using a two-tailed t-test. No adjustment for multiple comparisons was performed. Source data are provided as a Source Data file.
Fig. 3
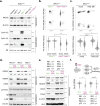
Fig. 3. CDK4/6 inhibitors prevent the completion of origin licensing via the RB protein family.
a–f The CDK4/6-RB axis controls origin licensing proficiency. a Immunoblot monitoring the effect of CDK4/6 inhibitors and/or mimosine on chromatin-bound MCM2 levels and corresponding cell cycle markers in nucleoplasm fractions. RB total and β-actin served as loading control (see Supplementary Fig. 4b) Representative blots are shown, with the experiment repeated twice. Values under immunoblots represent relative percentage of MCM2 signal compared to the Mimosine positive control. b QIBC analysis monitoring chromatin-bound MCM2 or MCM6 levels in single cells, relative to DNA content (DAPI), after expose to mimosine only or palbococlib and mimosine (analogous to the treatments in a). Scatterplots show MCM2/MCM6 levels in >1000 pre-extracted nuclei per condition. Violin plots depict distribution of MCM2/MCM6 signals in pre-extracted G1 phase nuclei (classified based on DAPI). The box shows the interquartile range (IQR) from 25th (Q1) to 75th (Q3) percentile; the white dot in the box corresponds to the median. Whiskers extend to the minimum and maximum values within 1.5 × IQR from Q1 and Q3, and dots outside this range represent potential outliers. Asterisks indicate a significant disparity between population means; *p = 0.0007; ** p = 0.0003; two-tailed paired t test; n = 4 technical replicates. c QIBC analysis monitoring total nuclear or chromatin-bound MCM2 levels in single cells, relative to DNA content (DAPI), after palbococlib expose. Scatterplots show MCM2 levels in >1000 nuclei per condition. Violin plots depict distribution of MCM2 signals in G1 phase nuclei (classified based on DAPI). The box shows the interquartile range (IQR) from 25th (Q1) to 75th (Q3) percentile; the white dot in the box corresponds to the median. Whiskers extend to the minimum and maximum values within 1.5 × IQR from Q1 and Q3, and dots outside this range represent potential outliers. Asterisk indicates a significant disparity between population means, p = 0.023; two-tailed paired t test; n = 4 technical replicates). d Immunoblot examining the effect of RB1 deficiency on palbociclib-induced licensing defects. The changes in chromatin-bound MCM2 are mirrored by chromatin-bound MCM4 and ORC6. Total RB protein and RB (S807/811) phosphorylation status is verified in nucleoplasm fractions. Ponceau S staining of bulk histones (10–25 kDa) and immunodetection of β-actin served as loading control. Nucleoplasmic CDC6 and CDT1 levels are shown in Supplementary Fig. 6a. e Immunoblot monitoring the effect of palbociclib and/or mimosine on origin licensing in RPE cells lacking all RB pocket proteins. d, e Cells were treated as in Fig. 4b and Supplementary Fig. 4b. Nucleoplasmic CDC6, CDT1 and RB phospho-RB (S807/811) phosphorylation levels are shown in Supplementary Fig. 6b. f QIBC analysis monitoring chromatin-bound MCM6 levels in single cells treated as in (e). Scatterplots show MCM6 levels in >1000 pre-extracted nuclei per condition. Violin plots depict distribution of MCM6 signals in pre-extracted G1 phase nuclei (classified based on DAPI). The box shows the interquartile range (IQR) from 25th (Q1) to 75th (Q3) percentile; the white dot in the box corresponds to the median. Whiskers extend to the minimum and maximum values within 1.5 × IQR from Q1 and Q3, and dots outside this range represent potential outliers. Asterisk indicates a disparity between population means; n = 5 technical replicates per condition, p = 0.00001 (two-tailed paired t test). Asynchr. asynchronous, Palb palbociclib, Tril Trilaciclub, Mim Mimosine, pre-X preextracted/chromatin bound. Mimosine only and Minosine+Palbociclib treatments are highlighted with green and purple labels, respectively, and performed as depicted in Supplementary Fig. 4b. Source data are provided as a Source Data file.
Fig. 4
Fig. 4. CDK4/6-inhibition causes an origin licensing defect upstream of CDC6/CDT1 function, which can be sustained to trigger replication failure and aberrant mitosis in p53-deficient cells.
a–f Sequential CDK4/6 and licensing inhibition triggers mitosis with unreplicated DNA. a outline of the experiment. b QIBC analysis simultaneously monitoring DNA synthesis (EdU incorporation) and nuclear Cyclin A2 levels in single RPE CDC6d CDT1d cells 12 h after palbociclib release (>1000 cells per condition). Figure axes depict integrated fluorescence intensities (arb. units) per nucleus; Upon release cells were either mock treated (grey) and exposed to ADN treatment (blue); dotted line box highlights mid S-phase cells (classified based on CyclinA2). c violin plots depict distribution of EdU signals in three independent mid S-phase populations per condition, treated and classified as in (a, b) (n = 300 mid-S phase cells per replicate). Asterisk indicates a significant disparity between population means; n = 3 technical replicates per condition, p = 0.00002 (two-tailed paired t test). d mitotic phenotypes upon treatment described in (a); compound DAPI images show representative mitotic nuclei; scale bars, 10 μm; bar graph depicts quantification of the percentage of anaphase nuclei among mitotic cells; bars indicate mean % of anaphase-like nuclei; error bars indicate SD of four independent replicates. Asterisk indicates p = 0.0002 (two-tailed paired t test). e Immunoblots examining the chromatin occupancy of indicated proteins and/or phosphorylated epitopes upon treatment described in (a); the reduction of PCNA as well as MCM4 and MCM2 serine 53 phosphoryation confirm a licensing defect. β-actin served as loading control. Representative blots are shown, with the experiment repeated twice independently with consistent results. f Top panel depicts outline of the experiment and bar graph below shows mean integrated intensity of nuclear EdU signals for each condition (arb. units); error bars indicate SEM of three independent experiments; black dots indicate replicate means. Asterisk indicates a significant disparity between population means; p = 0.0004 (two-tailed paired t test). Source data are provided as a Source Data file.
Fig. 5
Fig. 5. CDK4/6 activity is needed at the time of origin licensing.
a–c Time-resolved EdUseq upon CDK4/6 inhibition and/or CDC6/CDT1 degradation in early or late G1 phase. a Outline of the palbociclib treatment timings. b bar graph depicts the percentage of EdU-positive cells by FACS analysis after the treatments indicated in (a); error bars indicate SD; black dots indicate replicate means. Statistical significance was determined using a two-tailed paired t test; n = 3) and asterisks indicate p < 0.05 (* p = 0.00038; ** p = 0.00019). c Average origin activity (i.e., mean σ values) at 1 Kb resolution around 1000 predefined, most active early S-phase origins after indicated palbocilib and/or ADN treatments. Schematic experimental outlines are depicted above each graph. Dotted lines indicate the average origin activity of the respective ‘no palbociclib’ control. d, e Proposed working models, d FDA-approved CDK4/6 inhibitors impede origin licensing and cell cycle commitment via RB regulation. e The CDK4/6-RB axis coordinates origin licensing and cell cycle commitment. In cells with high CDK4/6 activity, pocket proteins such as RB are inhibited by phosphorylation, which promotes both origin licensing and cell cycle commitment, thus ensuring efficient genome replication. In cells with low CDK4/6 activity, pocket proteins such as RB remain active, which stalls origin licensing and cell cycle commitment, thus preventing energy-consuming licensing activities in cells exiting the cell cycle. Source data are provided as a Source Data file.

References

    1. Hu, Y. & Stillman, B. Origins of DNA replication in eukaryotes. Mol. Cell83, 352–372 (2023). - PMC - PubMed
    1. Moiseeva, T. N. & Bakkenist, C. J. Regulation of the initiation of DNA replication in human cells. DNA Repair72, 99–106 (2018). - PMC - PubMed
    1. Blow, J. J. & Hodgson, B. Replication licensing-defining the proliferative state?. Trends Cell Biol.12, 72–78 (2002). - PMC - PubMed
    1. Nguyen, V. Q., Co, C. & Li, J. J. Cyclin-dependent kinases prevent DNA re-replication through multiple mechanisms. Nature411, 1068–1073 (2001). - PubMed
    1. Wheeler, L. W., Lents, N. H. & Baldassare, J. J. Cyclin A-CDK activity during G1 phase impairs MCM chromatin loading and inhibits DNA synthesis in mammalian cells. Cell Cycle7, 2179–2188 (2008). - PubMed

MeSH terms

LinkOut - more resources