. 2025 Sep 12;16(1):8267.
doi: 10.1038/s41467-025-62996-0.

Matrix directs trophoblast differentiation in a bioprinted organoid model of early placental development

Affiliations

Matrix directs trophoblast differentiation in a bioprinted organoid model of early placental development

Claire Richards et al. Nat Commun. .

Abstract

Trophoblast organoids can provide crucial insights into mechanisms of placentation, however their potential is limited by highly variable extracellular matrices unable to reflect in vivo tissues. Here, we present a bioprinted placental organoid model, generated using the first trimester trophoblast cell line, ACH-3P, and a synthetic polyethylene glycol (PEG) matrix. Bioprinted or Matrigel-embedded organoids differentiate spontaneously from cytotrophoblasts into two major subtypes: extravillous trophoblasts (EVTs) and syncytiotrophoblasts (STBs). Bioprinted organoids are driven towards EVT differentiation and show close similarity with early human placenta or primary trophoblast organoids. Inflammation inhibits proliferation and STBs within bioprinted organoids, which aspirin or metformin (0.5 mM) cannot rescue. We reverse the inside-out architecture of ACH-3P organoids by suspension culture with STBs forming on the outer layer of organoids, reflecting placental tissue. Our bioprinted methodology is applicable to trophoblast stem cells. We present a high-throughput, automated, and tuneable trophoblast organoid model that reproducibly mimics the placental microenvironment in health and disease.


Conflict of interest statement

Competing interests: A.V. was an employee of Inventia Life Science at the time of the study. The remaining authors declare no competing interests.

Figures
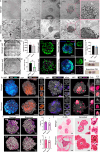
Fig. 1
Fig. 1. ACH-3P spontaneously differentiate within Matrigel and bioprinted organoids.
a Single cells embedded in Matrigel or synthetic matrix (bioprinted) formed organoids and grew over 12 days in culture across three independent replicates. Outer cell projections and surfaces are denoted by white arrows in the inset image; scale bar = 100 µm. b Montage of whole-well; scale bar = 1 mm. c Organoid size measured at day 11 and plotted as organoid area. Unpaired, two-tailed t-test, data presented as mean ± SEM, individual data points represent means from three experimental repeats. d Whole-well images acquired and analysed using an IncuCyte imaging system; scale bar = 800 µm. Area occupied by green fluorescence (live cells) was compared to the total area occupied by cells to determine viability (%). Data presented as mean ± SEM, individual data points represent means from three experimental repeats, unpaired two-tailed t-test, **p < 0.01 (p = 0.0038). e Organoids labelled with markers for live (green) and dead cells (magenta); scale bar = 100 µm. f Day 11, Alamar blue fluorescence intensity. Unpaired two-tailed t-test, n = 3 experimental repeats, data presented as mean ± SEM. g Over-the-counter pregnancy tests incubated with organoid conditioned medium (CM). h Organoids immunolabelled for DAPI (grey), cytokeratin 7 (Cyk7, cyan hot), E-cadherin (E-cad, orange), human leucocyte antigen G (HLA-G, purple) and beta human chorionic gonadotropin (β-hCG, pink) were assessed from three independent repeats. Images further processed using the NIS Elements denoise.ai algorithm. Maximum intensity projections of 60 µm z stacks alongside a single optical section. Scale bar = 50 µm. A YZ orthogonal view and XY single optical section of syncytiotrophoblasts (STB) in β-hCG labelled organoids. i Three-dimensional visualisation of z-stacks using Bitplane Imaris rendering. Number of nuclei compared to number of cells positive for either HLA-G or β-hCG in each setting. Unpaired, two-tailed t-test, n = 3 experimental repeats containing at least 10 whole-mounted organoids each, data presented as mean ± SEM. j Histologically sectioned and processed organoids stained by haematoxylin and eosin (H&E). Internal cavities denoted by asterisks; scale bar = 50 µm. D Day, Org. organoid. Source data are provided as a Source Data file.
Fig. 2
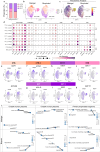
Fig. 2. Single-cell transcriptomic profiles of Matrigel and bioprinted ACH-3P organoids.
a Proportions of main trophoblast subtypes (CTB - cytotrophoblast, STB - syncytiotrophoblast, and EVT - extravillous trophoblasts) detected within Matrigel and bioprinted organoids. b Uniform manifold approximation and projection (UMAP) depicting an additional subcluster of CTBs and maturing EVTs. c UMAP plots of differentiation trajectory in organoids, depicted in pseudotime scale. d Dot plot representation of trophoblast lineage and subtype gene expression across the five distinguishable clusters. e UMAP plots of CTB markers, E-cadherin (CDH1) and epithelial cell adhesion molecule (EPCAM). f UMAP plot of metallothionein 2A (MT2A). g UMAP plot of human leucocyte antigen G (HLA-G). h UMAP plot of ornithine decarboxylase 1 (ODC1). i UMAP plot of Epstein-Barr virus-induced gene 3 (EBI3). j and k UMAP plots of STB markers, syndecan 1 (SDC-1) and growth differentiation factor 15 (GDF15). Single-cell RNA sequencing data are deposited in the GEO under accession number GSE279994. l Area under the receiver-operating-characteristic curve (AUROC) similarity networks between cell types from Matrigel or bioprinted organoid transcriptomic datasets compared to published data from human placenta or primary trophoblast organoids. Priori threshold AUROC > 0.88. Source data are provided as a Source Data file.
Fig. 3
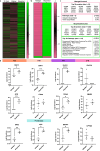
Fig. 3. Proteomic profiling of Matrigel and bioprinted ACH-3P organoids.
Organoids were digested and analysed by liquid chromatography with tandem mass spectrometry. a Heat map of mean protein z-score for 2D cells (2D), Matrigel organoids and bioprinted organoids. b Heat map of mean z-score for significantly differentially expressed proteins between Matrigel and bioprinted organoids. c Top proteins and pathways when ranked by significance for each group as determined by an unpaired, two-tailed Student’s t-test. d Differences in key trophoblast subtype marker expression between Matrigel and bioprinted organoid groups. Unpaired, two-tailed Student’s t-test, n = 3 experimental repeats, each containing 800 pooled organoids, *p < 0.05, **p < 0.01, ***p < 0.001, ****p < 0.0001, data plotted as experimental mean ± SEM. (ISG15 p = 0.0344; SCD p = 0.0033; SNX2 p = 0.0067; CDH1 p = 0.0089; Ki67 p = 0.0124; HLA-G p < 0.0001; ITGA5 p = 0.0274; QSOX1 p = 0.0161). All protein mass spectrometry raw data is available in a ProteomeXchange partner repository with identifier PXD056796.
Fig. 4
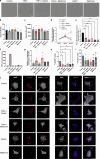
Fig. 4. Bioprinted organoid formation after treatment with TNFα, aspirin and metformin.
a Brightfield images of bioprinted organoids incubated with inflammatory cytokine tumour necrosis factor alpha (TNFα, 20 ng/ml) ± aspirin (0.5 mM) or metformin (0.5 mM). Images acquired using an IncuCyte. Organoids annotated with an orange outline. Scalebar = 500 µm. b Mean number of organoids counted across six bioprint units. Ordinary one-way ANOVA with Šídák’s multiple comparisons post-hoc test, data presented as mean ± SEM, individual data points represent mean per bioprint unit. c Mean 2D organoid area. Ordinary one-way ANOVA with Šídák’s multiple comparisons post-hoc test, data presented as mean ± SEM, individual data points represent mean per bioprint unit. d Alamar Blue fluorescence measured at 590 nm, normalised to the day 6 fluorescence intensity of each condition. Data presented as mean ± SEM, individual data points represent mean across three bioprint units. e Alamar Blue fluorescence on Day 12 normalised to the day 6 fluorescence intensity of each condition. Ordinary one-way ANOVA with Šídák’s multiple comparisons post-hoc test, data presented as mean ± SEM, individual data points represent mean per bioprint unit, **p < 0.01, ***p < 0.001 (Control vs. TNFα p = 0.0026; Control vs. TNFα + Aspirin p = 0.0002; Control vs. TNFα + Metformin p = 0.0009; Control vs. Aspirin p = 0.0002; Control vs. Metformin p = 0.0002). f C-reactive protein (CRP) concentration of condition medium from 3 pooled bioprint units per condition. Data plotted as individual data point from pooled sample. g Relative interleukin 6 (Il-6) mRNA expression of organoids harvested from each bioprint unit. Data presented as mean ± SEM, individual data points represent the mean per bioprint unit. Ordinary one-way ANOVA with Šídák’s multiple comparisons post-hoc test. h Number of β-hCG positive nuclei divided by total number of nuclei per organoid. Ordinary one-way ANOVA with Šídák’s multiple comparisons post-hoc test, data presented as mean ± SEM, data points represent individual organoids from pooled bioprint units, p*<0.05 (Control vs. TNFα p = 0.0496; Control vs. TNFα + Aspirin p = 0.012; Control vs. Aspirin p = 0.0281; Control vs. Metformin p = 0.0417). i Number of HLA-G positive nuclei divided by total number of nuclei per organoid. Ordinary one-way ANOVA with Šídák’s multiple comparisons post-hoc test, data presented as mean ± SEM, data points represent individual organoids from pooled bioprint units. j Immunofluorescence images labelled with DAPI (grey), β-hCG (pink) and HLA-G (purple) acquired using a Leica Stellaris confocal microscope at ×25, scale bar = 100 µm. Source data are provided as a Source Data file.
Fig. 5
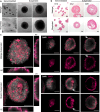
Fig. 5. Syncytiotrophoblasts form on the outer surface of trophoblast organoids in suspension culture.
Organoids grown in Matrigel or bioprinted conditions were harvested from the matrices after 3 days before transferring to a low-attachment plate for suspension culture. a Live cell images of gel-embedded and suspended organoids at days 12 (D12) and 28 (D28); scale bar = 100 µm. Suspension of organoids was independently repeated twice. b Images of harvested organoids cut at 5 µm thickness and stained by haematoxylin and eosin; scale bar = 100 µm. c Harvested organoids fixed, immunolabelled for syndecan-1 (SDC-1, pink) and co-stained with DAPI (grey). Confocal z-stacks of 60 µm depth were processed for visualisation using NIS Elements denoise.ai algorithm. Z-stack images of an organoid from each condition presented as maximum intensity projections (MIPs) with XY and XZ orthogonal views and optical z slices 30 µm apart. Arrows depict syncytialised areas on the outer surface of organoids. Scale bar = 100 µm. Suspension of organoids was independently repeated twice.
Fig. 6
Fig. 6. Trophoblast stem cell organoid formation in Matrigel and bioprinted conditions.
Matrigel-embedded or bioprinted trophoblast stem cell (CT29) organoids supported by trophoblast organoid medium (TOM), syncytiotrophoblast differentiation medium (STB-DM) or extravillous trophoblast differentiation medium (EVT-DM). Bioprinted organoids were additionally generated in a rich PEG matrix. a Day 12 brightfield images, Nikon Ti, ×4, scale bar = 500 µm. b Day 12 brightfield images, Nikon Ti, ×20, scale bar = 100 µm. c Over-the-counter pregnancy test result of conditioned medium from STB-DM organoids in Matrigel (M) or bioprinted (B). d Organoid formation efficiency calculated as the number of cells seeded per unit/number of organoids. Unpaired, two-tailed t-test, data plotted as mean ± SEM, data points represent the mean of each bioprint unit, ****p < 0.0001. e Number of organoids and organoid area of Matrigel-embedded organoids. Ordinary one-way ANOVA with Tukey’s post-hoc, data plotted as mean ± SEM, data points represent the mean of each bioprint unit. Violin plots display median ± interquartile range (IQR) in organoid size across bioprint units. f Number of organoids and organoid area of bioprinted organoids. Ordinary one-way ANOVA with Tukey’s post-hoc, data points represent the mean of each bioprint unit. Violin plots display media ± IQR in organoid size across bioprint units. *p < 0.05, **p < 0.01, ***p < 0.001, ****p < 0.0001 (Blank vs. Rich p = 0.0005; STB-DM vs. Rich p = 0.0144; EVT-DM vs. Rich p = 0.0072). g Immunofluorescence images of organoids labelled for key trophoblast subtype markers. Leica Stellaris confocal microscope, 25x, scale bar = 100 µm. Source data are provided as a Source Data file.

References

    1. Lancaster, M. A. & Knoblich, J. A. Organogenesis in a dish: modeling development and disease using organoid technologies. Science345, 1247125 (2014). - PubMed
    1. Kleinman, H. K. & Martin, G. R. Matrigel: basement membrane matrix with biological activity. Semin. Cancer Biol.15, 378–386 (2005). - PubMed
    1. Kim, J., Koo, B.-K. & Knoblich, J. A. Human organoids: model systems for human biology and medicine. Nat. Rev. Mol. Cell Biol.21, 571–584 (2020). - PMC - PubMed
    1. Matai, I., Kaur, G., Seyedsalehi, A., McClinton, A. & Laurencin, C. T. Progress in 3D bioprinting technology for tissue/organ regenerative engineering. Biomaterials226, 119536 (2020). - PubMed
    1. Napso, T., Yong, H. E. J., Lopez-Tello, J. & Sferruzzi-Perri, A. N. The role of placental hormones in mediating maternal adaptations to support pregnancy and lactation. Front. Physiol.9, 1091 (2018). - PMC - PubMed

MeSH terms

LinkOut - more resources