. 2025 Nov;31(11):3801-3812.
doi: 10.1038/s41591-025-03931-0. Epub 2025 Sep 12.

Genetic subtyping of obesity reveals biological insights into the uncoupling of adiposity from its cardiometabolic comorbidities

Affiliations

Genetic subtyping of obesity reveals biological insights into the uncoupling of adiposity from its cardiometabolic comorbidities

Nathalie Chami et al. Nat Med. 2025 Nov.

Abstract

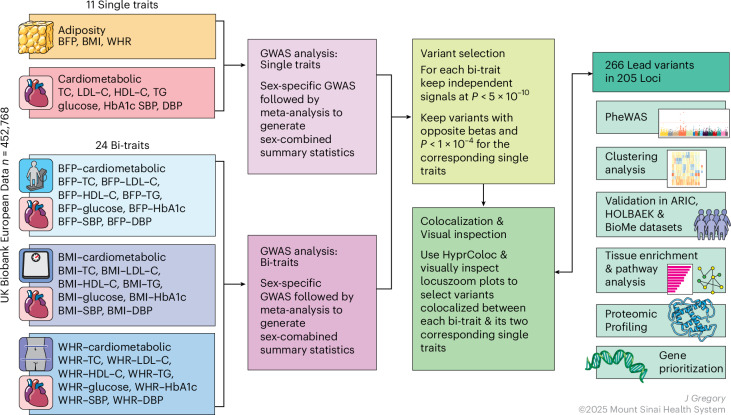
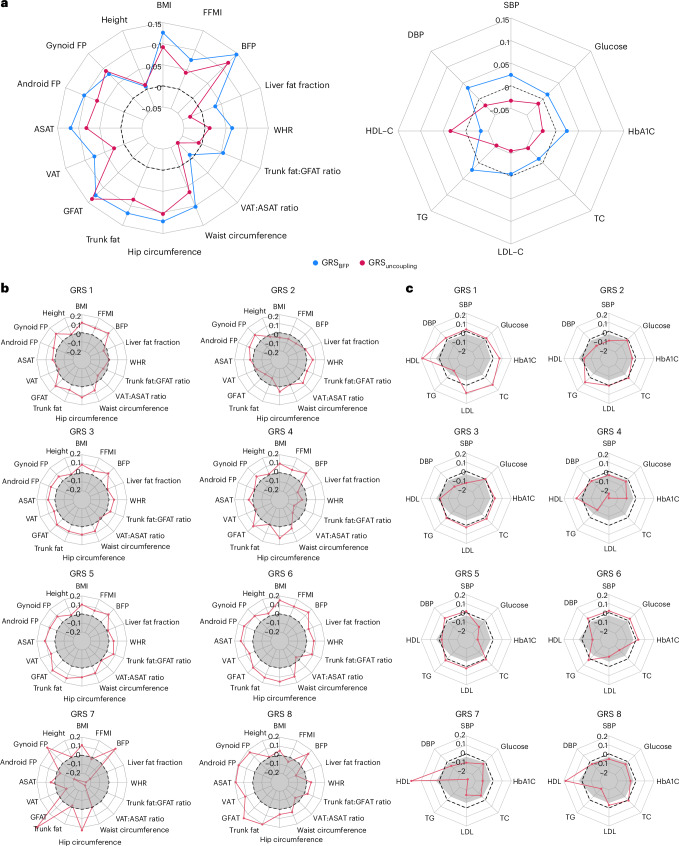
Obesity is a heterogeneous condition not adequately captured by a single adiposity trait. We conducted a multi-trait genome-wide association analysis using individual-level data from 452,768 UK Biobank participants to study obesity in relation to cardiometabolic health. We defined continuous 'uncoupling phenotypes', ranging from high adiposity with healthy cardiometabolic profiles to low adiposity with unhealthy ones. We identified 266 variants across 205 genomic loci where adiposity-increasing alleles were simultaneously associated with lower cardiometabolic risk. A genetic risk score (GRSuncoupling) aggregating these variants was associated with a lower risk of cardiometabolic disorders, including dyslipidemia and ischemic heart disease, despite higher obesity risk; unlike an adiposity score based on body fat percentage-associated variants (GRSBFP). The 266 variants formed eight genetic subtypes of obesity, each with distinct risk profiles and pathway signatures. Proteomic analyses revealed signatures separating adiposity- and health-driven effects. Our findings reveal new mechanisms that uncouple obesity from cardiometabolic comorbidities and lay a foundation for genetically informed subtyping of obesity to support precision medicine.


Conflict of interest statement

Competing interests: J.C.H. has received honoraria for expert roles from Novo Nordisk and Rhythm Pharmaceuticals and provides training and treatment of obesity. All the other authors declare no competing interests.

Figures

Fig. 1
Fig. 1. Study overview.
Overall steps and traits analyzed in the study. Bi-traits are obtained by subtracting standardized values of a cardiometabolic trait from an adiposity trait.
Fig. 2
Fig. 2. Associations of genetic risk scores with anthropometric and cardiometabolic traits in the UK Biobank.
a, Estimated per ten-allele change effect sizes of GRS–trait associations in UK Biobank European ancestry population for GRSuncoupling (in magenta) and GRSBFP (in blue). b,c, Estimated per ten-allele change effect sizes of GRS–trait associations in UK Biobank European ancestry population for each cluster-specific GRS (GRS 1–8, in red) and GRSBFP (in gray). Dashed circles indicate β = 0, indicating no association between each GRS and the trait. Points outside the circle represent positive GRS–trait associations, whereas those inside represent negative associations. The effect and reference alleles of GRS2, a cluster associated with lower WHR and higher blood pressure, were flipped to reflect a profile of higher adiposity and facilitate comparison with the other clusters.
Fig. 3
Fig. 3. Association of genetic risk scores with disease outcomes in the UK Biobank.
Phenome-wide association results of disease outcomes and GRSBFP (in blue) and GRSuncoupling (in magenta) performed using the PHEnome Scan ANalysis Tool (PHESANT) in 373,747 European participants. Data are presented as OR ± CI. ORs represent effect size estimates per ten risk-allele increments. Case–control sample sizes for each outcome are presented in Supplementary Table 8.
Fig. 4
Fig. 4. Heatmap of the association of the lead variants with adiposity and cardiometabolic traits.
Clustering of the 266 uncoupling lead variants using the NAvMix algorithm identified eight clusters. The color coding represents β values ranging from negative (blue) to positive (red). Associations are expressed by the BFP-increasing allele as the effect allele to enable comparison across traits.
Fig. 5
Fig. 5. Physiological systems, tissue and cell-type enrichment analyses for uncoupling loci and general body fat percentage loci.
DEPICT results were based on summary statistics generated from the association analyses of the 266 lead single-nucleotide polymorphisms (SNPs) with BFP. Tissues enriched after correction for multiple testing at significance threshold (FDR < 0.05) are highlighted in bright blue. The dashed line represents the nominal significance level (P < 0.05). For full results, see Supplementary Table 15.
Fig. 6
Fig. 6. Plasma proteins with directionally opposing associations with body fat percentage and uncoupling genetic risk scores in the UK Biobank.
Estimated per ten-allele change effect sizes of GRS–protein associations in UK Biobank European ancestry population for GRSuncoupling (in magenta) and GRSBFP (in blue), for rank-based inverse-normal transformed Olink-derived plasma protein concentrations (n = 32).
Extended Data Fig. 1
Extended Data Fig. 1. Schematic Representation of Bi-Trait Phenotype Derivation.
Pairwise difference between BMI and TC z-scores results in a new normally distributed bi-trait BMI–TC.
Extended Data Fig. 2
Extended Data Fig. 2. Sex-specific associations of genetic risk scores with anthropometric and cardiometabolic traits in the UK Biobank.
A. Estimated per 10 allele change effect sizes of GRS–trait associations in UK Biobank European ancestry population for GRSuncoupling (men in light magenta, women in dark magenta) and GRSBFP (men in light blue, women in dark blue). B-C. Estimated per 10 allele change effect sizes of GRS–trait associations in UK Biobank European ancestry population for each cluster-specific GRS (GRS 1–8, men in light magenta, women in dark magenta). The dashed circles are labeled ‘0’, indicating no association between each GRS and the trait. Points outside the circle represent positive GRS–trait associations, while those inside represent negative associations.
Extended Data Fig. 3
Extended Data Fig. 3. Associations of genetic risk scores with anthropometric and cardiometabolic traits in the ARIC study.
A. Estimated per 10 allele change effect sizes of GRS–trait associations in 9,240 unrelated European ancestry participants of the ARIC study for GRSuncoupling (in magenta) and GRSBFP (in blue). B-C. Estimated per 10 allele change effect sizes of GRS–trait associations in UK Biobank European ancestry population for each cluster-specific GRS (GRS 1–8, in red) and GRSBFP (in gray). Dashed circles indicate Beta=0, indicating no association between each GRS and the trait. Points outside the circle represent positive GRS–trait associations, while those inside represent negative associations. The effect and reference alleles of GRS2, a cluster associated with lower WHR and higher blood pressure, were flipped in order to reflect a profile of higher adiposity and facilitate comparison with the other clusters.
Extended Data Fig. 4
Extended Data Fig. 4. Associations of genetic risk scores with anthropometric and cardiometabolic traits in the HOLBAEK study.
A. Estimated per 10 allele change effect size of GRS-anthropometric trait associations for GRSuncoupling (in magenta) and GRSBFP (in blue). B-C. As A, but for associations with continuous and binary cardiometabolic traits, respectively. Continuous traits were standardized to mean 0 and SD 1. Dashed circles in A and B indicate Beta=0, and the dashed line in C indicates odds ratio=1. Points outside the dashed circles in A and B represent positive GRS–trait associations, while those inside represent negative associations. *analysis restricted to the population-based cohort only.
Extended Data Fig. 5
Extended Data Fig. 5. Pathways enriched for GRSuncoupling and GRSBFP loci.
REACTOME, GO, and KEGG results from DEPICT gene set enrichment analyses were used to group pathways into broader categories. DEPICT assigns gene scores reflecting their likelihood of belonging to specific gene sets, then tests enrichment by summing these scores across associated loci and comparing them to sums from matched random loci. Repeated sampling generates a null distribution used to compute adjusted Z-scores, P values, and FDRs. Pathways from REACTOME, GO, and KEGG enriched with nominal non-adjusted P < 0.01 were grouped into broad pathway categories to enable visualization and plotted for each of GRSuncoupling and GRSBFP. The width of each category is proportional to the number of pathways in that category. Redundant pathways were removed. Full results are presented in Supplementary Table 16.
Extended Data Fig. 6
Extended Data Fig. 6. Enriched pathways per cluster.
Cluster-specific DEPICT gene set enrichments specific to REACTOME, GO, and KEGG pathways were grouped into broad pathway categories. DEPICT assigns gene scores reflecting their likelihood of belonging to specific gene sets, then tests enrichment by summing these scores across associated loci and comparing them to sums from matched random loci. Repeated sampling generates a null distribution used to compute adjusted Z-scores, P values, and FDRs. To facilitate visualization of the mostly represented pathways per cluster, we considered pathways with nominal and non-adjusted P values < 1x10⁻³. FDR values adjusted for multiple testing and full results are presented in Supplementary Table 16.
Extended Data Fig. 7
Extended Data Fig. 7. Plasma proteins (n=176) with directionally consistent associations with the body fat percentage- and uncoupling genetic risk scores in the UK Biobank.
Estimated per 10 allele change effect sizes of GRS-protein associations in UK Biobank European ancestry population for GRSuncoupling (in magenta) and GRSBFP (in blue), for rank-based inverse-normal transformed Olink-derived plasma protein concentrations.
Extended Data Fig. 8
Extended Data Fig. 8. Plasma proteins (n=129) which associate with the uncoupling- but not the body fat percentage genetic risk score in the UK Biobank.
Estimated per 10 allele change effect sizes of GRS-protein associations in UK Biobank European ancestry population for GRSuncoupling (in magenta) and GRSBFP (in blue), for rank-based inverse-normal transformed Olink-derived plasma protein concentrations.

Update of

References

    1. Mokdad, A. H. et al. Prevalence of obesity, diabetes, and obesity-related health risk factors, 2001. JAMA289, 76–79 (2003). - PubMed
    1. Alberti, K. G. et al. Harmonizing the metabolic syndrome: a joint interim statement of the International Diabetes Federation Task Force on Epidemiology and Prevention; National Heart, Lung, and Blood Institute; American Heart Association; World Heart Federation; International Atherosclerosis Society; and International Association for the Study of Obesity. Circulation120, 1640–1645 (2009). - PubMed
    1. Hubert, H. B., Feinleib, M., McNamara, P. M. & Castelli, W. P. Obesity as an independent risk factor for cardiovascular disease: a 26-year follow-up of participants in the Framingham Heart Study. Circulation67, 968–977 (1983). - PubMed
    1. Must, A. et al. The disease burden associated with overweight and obesity. JAMA282, 1523–1529 (1999). - PubMed
    1. Loos, R. J. F. & Yeo, G. S. H. The genetics of obesity: from discovery to biology. Nat. Rev. Genet.23, 120–133 (2022). - PMC - PubMed

LinkOut - more resources