. 2025 Oct;26(20):4923-4949.
doi: 10.1038/s44319-025-00573-8. Epub 2025 Sep 12.

CDK1-mediated phosphorylation of LDHA fuels mitosis through LDHB-dependent lactate oxidation

Affiliations

CDK1-mediated phosphorylation of LDHA fuels mitosis through LDHB-dependent lactate oxidation

Mengting Liu et al. EMBO Rep. 2025 Oct.

Abstract

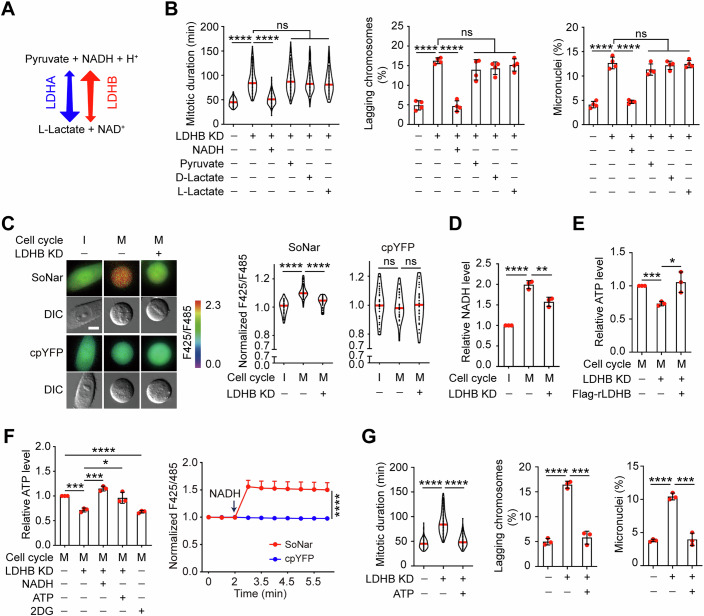
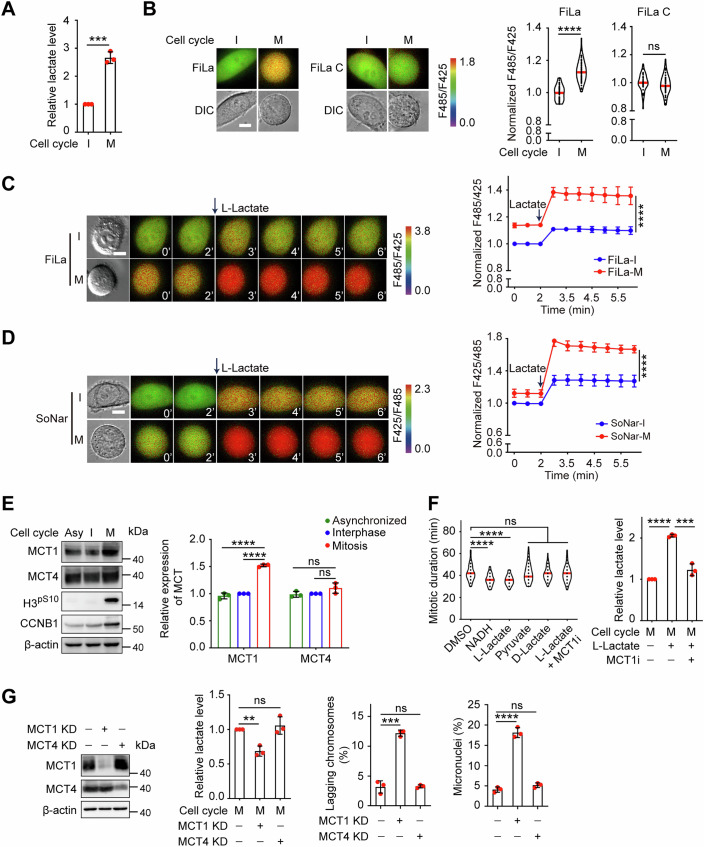
While cancer cells overexpress lactate dehydrogenase A (LDHA) to support glycolytic flux and lactate production, the role of LDHB-which preferentially catalyzes lactate oxidation-remains unclear. Here, we demonstrate that LDHB, but not LDHA, is essential for mitotic progression in cancers. During mitosis, CDK1 phosphorylates LDHA at threonine 18, reducing its incorporation into the lactate dehydrogenase (LDH) tetramer. This results in LDHB-enriched tetramers that shift catalytic activity toward lactate oxidation, converting lactate and NAD⁺ into pyruvate and NADH. The generated NADH fuels oxidative phosphorylation and ATP production, thereby sustaining mitosis. Notably, LDHA-T18 phosphorylation occurs exclusively in tumor tissues. Our findings reveal a tumor-specific mechanism in which CDK1 reprograms LDH isoenzyme composition to direct lactate toward NADH production, ensuring energy homeostasis during mitosis. This underscores the therapeutic necessity of targeting both LDHA and LDHB in cancer.

Keywords: ATP; Lactate; Lactate Dehydrogenase; Mitosis; NADH.


Conflict of interest statement

Disclosure and competing interests statement. The authors declare no competing interests.

Figures

Figure 1
Figure 1. LDHB, not LDHA, is required for proper chromosome segregation.
(A) Endogenous LDHA and LDHB were respectively knocked down (KD) in HeLa cells, and shRNA-resistant Flag-LDHBWT was expressed as described. Representative mitotic phenotypes of each group are presented. H2B–GFP-labeled chromosomes were monitored by time-lapse microscopy. Scale bar: 10 µm (left). The mitotic duration (min) starting from nuclear envelope breakdown to anaphase onset was quantified (n = 115, 121, 106, 119, 108 biologically independent cells; (not significant; ns) P  =  0.1993, ****P  <  0.0001) (top right). Quantification of lagging chromosomes and micronuclei is shown (n  =  3 biologically independent experiments for lagging chromosomes and micronuclei; (ns) P  =  0.2248, ***P  = 0.0005, (ns) P  =  0.9121, **P  = 0.0019, from left to right) (bottom). NT (non-targeting). (B) HeLa cells (H2B–GFP-labeled) treated with or without LDHA inhibitor GSK2837808A were monitored by time-lapse microscopy. The mitotic duration (min) starting from nuclear envelope breakdown to anaphase onset was quantified (n = 92, 94 biologically independent cells; (ns) P  =  0.1739). Quantification of lagging chromosomes is shown (n  =  3 biologically independent experiments; (ns) P  =  0.6450). (C) Human intestinal organoids treated with NT or LDHA/B knockdown were immunoblotted with the indicated antibodies (left). Representative images (middle) and quantitative analysis (right) of each group are presented. Scale bars: 200 µm. (n = 33, 33, 33 biologically independent organoids; ****P  <  0.0001). (D) HeLa cells were subcutaneously inoculated into BALB/c nude mice. Xenograft tumors (left) and tumor weights (middle) at the endpoint were collected and are shown. Scale bar: 1 cm. (n = 4 biologically independent tumors for each group; *P  = 0.0147, *P  = 0.0254, from left to right). Quantification of lagging chromosomes in xenograft tumor sections are also shown. (n = 4 biologically independent tumors for each group, ****P  <  0.0001) (right). (E) Relative changes in LDH bidirectional activities between interphase (I) and mitosis (M) were quantified in HeLa and DLD1 cells using the enzymatic activity assay kit. (n  =  3 biologically independent experiments; ***P  =  0.0002, *P  =  0.0123, ***P  =  0.0002, **P  =  0.0022, from left to right). (F) The functional LDH enzyme is a tetramer composed of varying ratios of LDHA and LDHB subunits. The composition of the five different LDH tetramers is illustrated (left). Interphase and mitotic HeLa cells were collected by double thymidine block and shake-off. LDH isozymes (LDH1-LDH5) were visualized on a gel after native gel electrophoresis (middle). The relative abundance of five distinct LDH tetramer isoforms during interphase and mitosis in HeLa cells is shown (n = 3 biologically independent experiments; ****P  <  0.0001, (ns) P  =  0.2116, (ns) P  =  0.2116, *P  = 0.0241, ***P  = 0.0003, from top to bottom) (right). (G) HeLa cells were transfected with either Flag-EV or Flag-tagged LDHB. The interaction between endogenous LDHA and exogenous LDHB during interphase and mitosis was confirmed by Co-IP and subsequent immunoblotting with the indicated antibodies (left). Quantified data are presented (n = 3 biologically independent experiments; ***P  = 0.0004) (right). Data Information: Data in (A) (top right), (B) (left), (C) are shown as violin plots. Data were presented as mean ± SD for (A) (bottom), (B) (right), (DG). P values were determined by unpaired two-tailed Student’s t-test. Source data are available online for this figure.
Figure 2
Figure 2. The LDHB-mediated increases in mitotic NADH and ATP are essential for accurate chromosome segregation.
(A) Diagram of the bidirectional reactions catalyzed by LDHA and LDHB. (B) In Hela-GFP-H2B cells, LDHB KD cells treated with 1 mM NADH, 1 mM pyruvate, 0.5 mM D-lactate, and 0.5 mM L-lactate were monitored using time-lapse microscopy. The mitotic duration was quantified (n = 195, 195, 195, 195, 182, 183 biologically independent cells; ****P  <  0.0001, (ns) P  =  0.2532, (ns) P  =  0.9214, (ns) P  =  0.1645, from left to right) (left). The quantification of lagging chromosomes is presented (n = 4 biologically independent experiments; ****P  <  0.0001, (ns) P  =  0.1400, (ns) P  =  0.0765, (ns) P  =  0.2666, from left to right) (middle). The quantification of micronuclei is shown (n = 4 biologically independent experiments; ****P  <  0.0001, (ns) P  =  0.1552, (ns) P  =  0.5410, (ns) P  =  0.7611, from left to right) (right). (C) The NADH/NAD+ sensor SoNar and cpYFP (control) were respectively transfected into HeLa cells as described. Cells were monitored by live-cell imaging, and images were pseudo-colored based on the F425/F485 ratio. Scale bar: 10 μm (left). Quantification of intracellular NADH/NAD+ ratio (calculated as F425/F485 ratio) is presented (n = 53, 53, 53 biologically independent cells for SoNar; n = 30, 30, 30 biologically independent cells for cpYFP; ****P  <  0.0001, (ns) P  =  0.6581, (ns) P =  0.7663, from left to right) (right). (D) Interphase and mitotic HeLa cells were collected using a double thymidine block and shake-off. Relative changes of intracellular NADH levels in interphase and mitotic cells with or without LDHB KD were measured with an NADH assay kit (n = 3 biologically independent experiments; ****P  <  0.0001, **P  =  0.0083). (E) Endogenous LDHB was knocked down in HeLa cells, followed by the expression of shRNA-resistant LDHBWT. Mitotic cells were collected as before, and relative changes of intracellular ATP levels were measured using an ATP assay kit (n = 3 biologically independent experiments; ***P  =  0.0002, *P  =  0.0243). (F) Relative changes of intracellular ATP levels in mitotic HeLa cells upon LDHB KD or NADH/ATP supplement were measured using an ATP assay kit (n = 3 biologically independent experiments; ***P  =  0.0003, ***P  =  0.0003, *P  =  0.0228, ****P  <  0.0001, from left to right) (left). The uptake of NADH was validated using the NADH/NAD+ sensor SoNar and cpYFP (control), and the quantified data are presented (n  =  8 biologically independent cells for SoNar and n  =  8 for cpYFP; ****P  <  0.0001) (right). (G) In Hela-GFP-H2B cells, LDHB KD cells treated with 1 mM ATP were monitored using time-lapse microscopy. The mitotic duration was quantified (n = 213, 214, 214 biologically independent cells; ****P  <  0.0001) (left). The quantification of lagging chromosomes and micronuclei is presented (n = 3 biologically independent experiments; ****P  <  0.0001, ***P  =  0.0002, ****P  <  0.0001, ***P  =  0.0005, from left to right) (right). Data Information: Data in (B) (left), (C), (G) (left) are shown as violin plots. Data were presented as mean ± SD for (B) (middle and right), (DF), (G) (middle and right). Statistical significance was assessed by two-way ANOVA for (F) (right), and other data were determined by unpaired two-tailed Student’s t-test. Source data are available online for this figure.
Figure 3
Figure 3. MCT1-mediated lactate import increases during mitosis to ensure accurate chromosome segregation.
(A) Interphase (I) and mitotic (M) HeLa cells were collected using a double thymidine block and shake-off. Relative change of intracellular lactate levels in interphase and mitotic HeLa cells was measured using a lactate assay kit (n = 3 biologically independent experiments; ***P  =  0.0002). (B) The plasmid encoding lactate sensor FiLa and FiLa C (control) were respectively transfected into HeLa cells. Interphase and mitotic HeLa cells were monitored by live-cell imaging and images were pseudo-colored based on the F485/F425 ratio. Scale bar: 10 μm (left). Quantification of intracellular lactate levels (calculated as F485/F425 ratio) is presented (n = 58, 58 biologically independent cells for FiLa, n = 43, 43 for FiLa C; ****P  <  0.0001, (ns) P  =  0.2301) (right). (C) Time-lapse microscopy was performed to monitor the relative changes of intracellular lactate levels using the FiLa sensor in interphase and mitotic HeLa cells, both before and after treatment with 10 mM lactate. Images were pseudo-colored based on the F485/F425 ratio. Scale bar: 10 μm (left). Data were quantified over time (n  =  6 biologically independent cells for interphase and n  =  6 for mitosis; ****P  <  0.0001) (right). (D) Time-lapse microscopy was conducted to measure the relative changes of intracellular NADH/NAD+ ratios using SoNar in interphase and mitotic HeLa cells, both before and after treatment with 10 mM lactate. Images were pseudo-colored based on the F425/F485 ratio. Scale bar: 10 μm (left). Data were quantified over time (n  =  5 biologically independent cells for interphase and n  =  6 for mitosis; ****P  <  0.0001) (right). (E) Western blot analysis was conducted to examine the expression of MCT1 and MCT4 during asynchronized (Asy), interphase (I) and mitotic (M) HeLa cells (left). Cyclin B1 (CCNB1) and H3pS10 were utilized as the mitotic markers. The relative expression of MCT was quantified (n = 3 biologically independent experiments; ****P  <  0.0001, (ns) P  =  0.1448, (ns) P  =  0.1355, from left to right) (right). (F) Hela-GFP-H2B cells treated with 1 mM NADH, 0.5 mM L-lactate, 1 mM pyruvate, 0.5 mM D-lactate, and 0.5 mM L-lactate in the presence of the MCT1 inhibitor AZD3965 were monitored using time-lapse microscopy. The mitotic duration was quantified (n = 93, 92, 93, 92, 91, 93 biologically independent cells; ****P  <  0.0001, (ns) P  =  0.7535, (ns) P  =  0.4067, (ns) P  =  0.3955, from left to right) (left). The relative changes of intracellular lactate levels in mitotic HeLa cells treated with or without 0.5 mM L-lactate and AZD3965 were measured using a lactate assay kit (n = 3 biologically independent experiments; ****P  <  0.0001, ***P  =  0.0007) (right). (G) Endogenous MCT1/4 were knocked down in HeLa-GFP-H2B cells, and their expression was examined by western blot (left). Mitotic cells were then collected via double thymidine block and shake-off and subjected to analysis of relative intracellular lactate levels after MCT1/4 KD using a lactate assay kit (n = 3 biologically independent experiments; **P  =  0.0018, (ns) P  =  0.4815) (middle). MCT1/4 KD cells were imaged using time-lapse microscopy, and the percentage of lagging chromosomes and micronuclei is shown (n = 3 biologically independent experiments; ***P  =  0.0002, (ns) P  =  0.8793, ****P  <  0.0001, (ns) P  =  0.0995, from left to right) (right). Data Information: Data in (B), (F) (left) are shown as violin plots. Data were presented as mean ± SD for (A, CE), (F) (right), (G). Statistical significance was assessed by two-way ANOVA for (C, D), other data were determined by unpaired two-tailed Student’s t-test. Source data are available online for this figure.
Figure 4
Figure 4. Phosphorylation of LDHA at T18 alters LDH tetramer formation during mitosis.
(A) Recombinant GST-CDK1 and Flag-LDHAWT or LDHAT18A mutant, Flag-LDHBWT were incubated with 32P-labeled ATP, followed by SDS-PAGE. The gel was then subjected to autoradiography. (B) Endogenous LDHA was knocked down and shRNA-resistant LDHAWT or mutants were expressed in HeLa cells. The cells were subsequently synchronized in mitosis using a double thymidine block and shake-off method to measure the relative LDH reverse reaction activity via an enzymatic activity kit (n = 3 biologically independent experiments; ***P  =  0.0001, (ns) P  =  0.3310). (C) Interphase and mitotic HeLa cells were stained with DAPI (blue) and either anti-LDHA or anti-LDHApT18 antibody (red). Scale bar: 10 μm. Immunofluorescence images are representative of three independent experiments with similar results. (D) Relative level of LDHApT18 signal in mitotic HeLa cells upon LDHA KD are shown (n  = 45, 45 biologically independent cells; ****P  <  0.0001) (top). Representative immunofluorescence images of LDHApT18 signal are shown. Scale bar, 10 μm (bottom). (E) Exogenous Flag-LDHAWT was expressed in HeLa cells, and then asynchronized (Asy), interphase (I) and mitotic (M) cells treated with or without RO3306 (CDK1 inhibitor), JNJ-7706621 (CDK inhibitor) and MG132 were collected by double thymidine block and shake-off. Flag-tagged LDHA were purified with anti-Flag beads and immunoblotted with the indicated antibodies. (F) Representative images of LDHApT18 signal in mitotic HeLa cells treated with inhibitors against CDK1, CDK, Aurora-A, and PLK1 for 30 min are shown. Scale bar: 10 μm (left). Relative changes of LDHApT18 signal in mitotic HeLa cells following treatment were quantified (n = 61, 58, 56, 57, 56 biologically independent cells; ****P  <  0.0001) (right). (G) His-LDHAWT, LDHAT18A or LDHAT18E proteins were purified and treated with or without disuccinimidyl suberate (DSS) for a protein cross-linking assay. The results were analyzed using WB (left), and quantitative data are presented (n = 3 biologically independent experiments; (ns) P  =  0.1688, ****P  <  0.0001) (right). (H) Exogenous Flag-LDHAWT or T18A/E mutants were expressed in HeLa cells, the interaction between endogenous LDHA and different exogenous LDHA in mitotic HeLa cells was confirmed by Co-IP and subsequent immunoblotting with the indicated antibodies (left). Quantitative data are presented (n = 3 biologically independent experiments; **P = 0.0067, **P  =  0.0024, from left to right) (right). (I) In HeLa cells, the endogenous LDHA was knocked down and replaced by shRNA-resistant Flag-LDHAWT or T18A/E mutants. The expressions of LDHA were examined by WB (left). Subsequently, Cells were imaged using time-lapse microscopy, and the percentage of lagging chromosomes and micronuclei is shown (n = 3 biologically independent experiments; ****P  <  0.0001, ***P  =  0.0001) (right). Data Information: Data in (D, F) are shown as violin plots. Data were presented as mean ± SD for (B, G, H, I). P values were determined by an unpaired two-tailed Student’s t-test. Source data are available online for this figure.
Figure 5
Figure 5. Phosphorylation of LDHA at T18 is essential for tumor progression.
(A) In HeLa cells, endogenous LDHA was knocked down, followed by expression of shRNA-resistant LDHAWT or LDHAT18A. A colony formation assay was conducted, and cells were fixed after culturing for 10 days. Crystal violet staining of the cells was shown (left). Additionally, a cell proliferation assay was performed with the HeLa cells, and the growth curves were plotted over seven days (n  =  3 biologically independent samples for each group; ****P  <  0.0001) (right). (B) Endogenous LDHA was knocked down and followed by expression of shRNA-resistant LDHAWT or LDHAT18A in HeLa cells. HeLa cells were subcutaneously inoculated into nude mice. Xenograft tumors were collected at the endpoint and shown (left). The weight of tumors at the endpoint was analyzed (n = 4 biologically independent tumors for each group; ****P  <  0.0001) (middle). The growth curve of the tumors was measured (n = 4 biologically independent mice for each group; ****P  <  0.0001) (right). (C) Immunofluorescence staining of DAPI in xenograft tumor sections is shown. Scale bar: 10 µm. Quantification of lagging chromosomes in xenograft tumors is presented (n = 4 biologically independent tumors for each group; ***P  =  0.0002). (D) Images of the paracancerous and colorectal cancer (CRC) samples stained with DAPI (blue) and antibodies for LDHApT18 (red) and H3pS10 (green) is shown. Scale bar, 20 μm (left). Relative fold change of LDHApT18 (mitosis/interphase) in paired CRC samples (n = 15 biologically independent samples; ***P  =  0.0001), P: paracancerous, T: tumor (right). (E) Working model of CDK1-mediated LDHA phosphorylation fuels mitosis through LDHB-dependent lactate oxidation. Our findings demonstrate that the mitotic kinase CDK1 phosphorylates LDHA T18 during mitosis, which reduces its incorporation into LDH tetramers and promotes the formation of LDHB-enriched tetramers. This modification facilitates increased NADH and ATP production, thereby driving mitotic progression and ensuring precise chromosome segregation (image created with https://biorender.com). Data Information: Data were presented as mean ± SD for (AC). Data in (D) are shown as symbols and lines. Statistical significance was assessed by two-way ANOVA for (A), (B) (right); by paired two-tailed Student’s t-test for (D); other data were determined by unpaired two-tailed Student’s t-test. Source data are available online for this figure.
Figure EV1
Figure EV1. LDHB, not LDHA, is required for proper chromosome segregation.
(A) The relative expression levels of LDHA and LDHB knockdown in Fig. 1A were analyzed (n = 3 biologically independent experiments; ****P < 0.0001). NT (non-targeting), KD (knockdown). (B) A colony formation assay was performed on the HeLa cells. After 10 days of culture, the cells were fixed and stained with crystal violet (left). A cell proliferation assay was conducted. Growth curves were plotted over a seven-day period (n = 3 biologically independent samples for each group; ****P < 0.0001) (right). (C) Cell lysates from DLD1 WT or LDHB KD cells were immunoblotted with the indicated antibodies, and the quantitative analysis is presented (n = 3 biologically independent experiments; ****P  <  0.0001) (left). The mitotic duration was quantified (n = 95, 95 biologically independent cells; ****P < 0.0001), and quantification of lagging chromosomes is depicted (n = 3 biologically independent experiments; **P = 0.0025) (right). (D) HeLa WT and LDHB KD cells were stained with DAPI (blue) and anti-centromere antibodies (ACA) (red). Representative fluorescence images of centromere-positive and centromere-negative micronuclei are shown. Scale bar, 10 μm (left). The quantification of centromere-positive and centromere-negative micronuclei (MN) is presented (n = 3 biologically independent experiments; ****P < 0.0001) (right). (E) Cells were synchronized using a double thymidine block procedure and then fixed for DAPI staining 9 h after release. The mitotic index of each group was quantified (n = 3 biologically independent experiments; (ns) P = 0.9679, ***P = 0.0001). (F) HCT116 cells (H2B–GFP-labeled) treated with or without LDHA inhibitor GSK2837808A were monitored by time-lapse microscopy. The mitotic duration (min) starting from nuclear envelope breakdown to anaphase onset was quantified (n = 71, 71 biologically independent cells; (ns) P = 0.0645). Quantification of lagging chromosomes is shown (n = 3 biologically independent experiments; (ns) P = 0.5313). (G) Lactate levels in the culture medium of control organoids were measured at different culture time points using a lactate assay kit, and the medium was refreshed on day 4. (n = 3 biologically independent experiments; ***P = 0.0005, **P = 0.0054). (H) Western blot analysis was conducted to examine the expression of LDHA and LDHB in interphase and mitotic HeLa cells. Cyclin B1 (CCNB1) and H3pS10 were utilized as mitotic markers. Immunoblots are representative of three independent experiments. Data Information: Data were shown as violin plots for (C) (middle), (F) (left), as mean ± SD for other data. Statistical significance was assessed by two-way ANOVA for (B); other data were determined by unpaired two-tailed Student’s t-test.
Figure EV2
Figure EV2. The LDHB-mediated increase in mitotic NADH and ATP is essential for accurate chromosome segregation.
(A) In HCT116-GFP-H2B cells, LDHA KD and LDHB KD cells treated with or without 1 mM NADH, 1 mM pyruvate were monitored using time-lapse microscopy. The mitotic duration was quantified (n = 89, 89, 89, 89, 89 biologically independent cells; (ns) P  =  0.0544, ****P  <  0.0001, (ns) P  =  0.0819, from left to right) (left). The quantification of lagging chromosomes is presented (n = 3 biologically independent experiments; (ns) P  =  0.8262, ***P  =  0.0006, **P  = 0.0015, (ns) P  =  0.3155, from left to right) (middle). The quantification of micronuclei is shown (n = 3 biologically independent experiments; (ns) P  =  0.4795, **P  =  0.0020, **P  =  0.0020, (ns) P  =  0.1592, from left to right) (right). (B) In DLD1-GFP-H2B cells, LDHB KD cells were treated with 1 mM NADH or 1 mM pyruvate and monitored using time-lapse microscopy. The mitotic duration was quantified (n = 116, 113, 100, 112 biologically independent cells; ****P  <  0.0001, (ns) P  =  0.0507) (left). The quantification of lagging chromosomes is presented (n = 3 biologically independent experiments; ***P  =  0.0002, ***P  =  0.0004, (ns) P  =  0.1812, from left to right) (right). (C) Relative changes of intracellular ATP levels in mitotic DLD1 cells upon LDHB KD or ATP supplementation were measured using an ATP assay kit (n = 3 biologically independent experiments; *P  =  0.0310, *P  =  0.0142) (left). Time-lapse microscopy was performed and mitotic duration was quantified (n = 80, 80, 80 biologically independent cells; ****P  <  0.0001) (middle). The quantification of lagging chromosomes is presented (n = 3 biologically independent experiments; ***P  =  0.0009, ***P  =  0.0008, from left to right) (right). (D) A schematic illustration of two mitochondrial NADH shuttles, the malate-aspartate shuttle (MAS) and glycerol-3-phosphate shuttle (G3PS), is presented. The cytosolic enzymes malate dehydrogenase 1 (MDH1) and glycerol-3-phosphate dehydrogenase 1-like (GPD1L) are key components of MAS and G3PS, respectively (left). Extracts of HeLa WT, LDHB KD or MDH1 and GPD1L DKO cells were immunoblotted with the indicated antibodies (middle). Cells were filmed via time-lapse microscopy, and the quantification of lagging chromosomes is presented (n = 3 biologically independent experiments; ****P  <  0.0001, ***P  =  0.0005, (ns) P  =  0.4001) (right). (E) Western blot analysis was conducted to examine the expression of MDH1 and GPD1L in interphase and mitotic HeLa cells. Cyclin B1 (CCNB1) and H3pS10 were utilized as mitotic markers. (F) In Hela-GFP-H2B cells, MDH1 and GPD1L were knocked out and treated with 0.5 mM D-lactate, 0.5 mM L-lactate, 1 mM NADH, and 1 mM ATP. Cells were subsequently monitored using time-lapse microscopy. Quantification of lagging chromosomes and micronuclei is shown (n = 3 biologically independent experiments; (ns) P  =  0.9543, (ns) P  =  0.6606, (ns) P  =  0.3659, **P  =  0.0046, (ns) P  =  0.4387, (ns) P  =  0.6970, (ns) P  =  0.5850, ***P  =  0.0009, from left to right). Data Information: Data in A (left), B (left), and C (middle) are shown as violin plots; as mean ± SD for other data. Statistical significance was assessed by an unpaired two-tailed Student’s t-test. Source data are available online for this figure.
Figure EV3
Figure EV3. MCT1-mediated lactate import increases during mitosis to ensure accurate chromosome segregation.
(A) Time-lapse microscopy was performed to monitor the relative changes of intracellular lactate levels using FiLa C (control) in interphase and mitotic HeLa cells, both before and after treatment with 10 mM lactate. Images were pseudo-colored based on the F485/F425 ratio. Scale bar: 10 μm (left). Data were quantified over time (n  =  10 biologically independent cells for interphase and n  =  11 for mitosis; (ns) P  =  0.8637) (right). (B) Time-lapse microscopy was conducted to measure the relative changes of intracellular NADH/NAD+ ratios using cpYFP (control) in interphase and mitotic HeLa cells, both before and after treatment with 10 mM lactate. Images were pseudo-colored based on the F425/F485 ratio. Scale bar: 10 μm (left). Data were quantified over time (n  =  9 biologically independent cells for interphase and n  =  8 for mitosis; (ns) P  =  0.3218) (right). (C) The plasmid of NADH/NAD+ sensor SoNar and control sensor cpYFP were respectively transfected into HeLa cells. Cells were synchronized at interphase and mitosis using a double thymidine block procedure. Interphase and mitotic HeLa cells underwent live-cell imaging for 5–10 min in DMEM medium (Gibco, A1443001) supplemented with 10% FBS and 1% P/S. Subsequently, 10 mM lactate was added for an additional 5–10 min of imaging. Images were pseudo-colored based on the F425/F485 ratio. Scale bar: 10 μm (left). The relative intracellular NADH/NAD+ ratios of each group are quantified (n = 50, 50, 50, 50 biologically independent cells for SoNar, n = 34, 34, 34, 34 biologically independent cells for cpYFP; **P  =  0.0083, ****P  <  0.0001, (ns) P  =  0.5419, (ns) P  =  0.6498, from left to right) (right). (D, E) Interphase and mitotic HeLa cells were obtained using a double thymidine block and shake-off. When cells progressed into interphase and mitosis, cells were treated with 10 µM MG132 or 100 µg/mL CHX for varying durations, followed by western blot analysis to examine the translational or protein stability regulation of MCT1. (F) SiHa/U-2OS (H2B–GFP-labeled) cells treated with 0.5 mM D-lactate, 0.5 mM L-lactate, 1 mM ATP were monitored using time-lapse microscopy. The mitotic duration was quantified (n = 69, 69, 69, 69 biologically independent cells for SiHa cells and n = 74, 74, 85, 85 for U-2OS cells; (ns) P  =  0.7957, ***P  =  0.0005, *P  =  0.0125, (ns) P  =  0.8086, ****P  <  0.0001, from left to right). (G) DLD1/HCT116-GFP-H2B cells treated with 0.5 mM D-lactate, 0.5 mM L-lactate, and 1 mM ATP were monitored using time-lapse microscopy. The mitotic duration was quantified (n = 90, 90, 90, 90 biologically independent cells for DLD1 cells and n = 89, 89, 89, 89 for HCT116 cells; (ns) P  =  0.5033, ***P  =  0.0004, ***P  =  0.0001, (ns) P  =  0.3690, ****P  <  0.0001, from left to right). (H) MDA-MB-231/T47D (H2B–GFP-labeled) cells treated with 0.5 mM D-lactate, 0.5 mM L-lactate, 1 mM ATP were monitored using time-lapse microscopy. The mitotic duration was quantified (n = 67, 68, 68, 79 biologically independent cells for MDA-MB-231 cells and n = 71, 72, 72, 74 for T47D cells; (ns) P  =  0.7768, (ns) P  =  0.8532, ***P  =  0.0002, (ns) P  =  0.5361, (ns) P  =  0.7743, **P  =  0.0029, from left to right). Data Information: Data in (C, FH) are shown as violin plots; as mean ± SD for (A, B). Statistical significance was assessed by two-way ANOVA for (A, B); by unpaired two-tailed Student’s t-test for (C, FH).
Figure EV4
Figure EV4. Phosphorylation of LDHA at T18 alters LDH tetramer formation during mitosis.
(A) An alignment of the 1–20 amino acid sequences of LDHA and LDHB proteins is presented. (B) The LDHAT18-phosphorylated peptide and non-phosphorylated peptide were added to the NC membrane, followed by a dot blot assay with anti-LDHApT18 antibody. (C) Representative images of interphase and mitotic HeLa cells stained with anti-LDHApT18 antibody or pre-immune antibody. Scale bar, 10 μm (left). Relative fold change of LDHApT18 (mitosis/interphase) is shown (n = 43, 39 biologically independent cells; ****P  <  0.0001) (right). (D) Quantified mitotic LDHApT18 level across various cancer cell lines and two non-cancer cells are shown (n = 34, 34, 34, 32, 34, 34, 38, 32, 35, 33, 33, 34, 31, 35 biologically independent cells, from left to right). (E) The root-mean-square deviation (RMSD) of LDHAWT, LDHApT18 and LDHApY10 was analyzed over a 250 ns timeframe during molecular dynamics simulations, with their RMSD values represented in blue, red, and green, respectively (left). Additionally, the distance between residue T18 or pT18 of LDHA and residue Q297 of another LDHA monomer was measured over a 400 ns timeframe during molecular dynamics simulations (right). (F) Molecular dynamics simulations revealed the dynamic conformational changes of LDHA T18 or pT18 and Q297 of another LDHA monomer in 70 ns. The residues Q297 and T18 or pT18 of LDHA were highlighted in color. Data Information: Data in (C, D) are shown as violin plots. Statistical significance was assessed by an unpaired two-tailed Student’s t-test. Source data are available online for this figure.
Figure EV5
Figure EV5. Phosphorylation of LDHA at T18 is essential for tumor progression.
(A) Representative images of paracancerous and colorectal cancer (CRC) samples stained with DAPI (blue) and antibodies for LDHA (green) and LDHB (red). Scale bar, 50 μm (left). Quantification of relative expression levels of LDHA and LDHB in paired CRC samples is shown (n  =  15 biologically independent samples; ***P  =  0.0007, **P  =  0.0034), P: paracancerous, T: tumor (right). Data Information: Data in (A) is shown as violin plots. Statistical significance was assessed by an unpaired two-tailed Student’s t-test.

References

    1. Bolhaqueiro ACF, van Jaarsveld RH, Ponsioen B, Overmeer RM, Snippert HJ, Kops GJPL (2018) Live imaging of cell division in 3D stem-cell organoid cultures. Method Cell Biol 145:91–106 - PubMed
    1. Brisson L, Banski P, Sboarina M, Dethier C, Danhier P, Fontenille MJ, Van Hee VF, Vazeille T, Tardy M, Falces J et al (2016) Lactate dehydrogenase B controls lysosome activity and autophagy in cancer. Cancer Cell 30:418–431 - PubMed
    1. Bussi G, Donadio D, Parrinello M (2007) Canonical sampling through velocity rescaling. J Chem Phys 126:014101 - PubMed
    1. Chen M, Cen KL, Song YJ, Zhang XC, Liou YC, Liu P, Huang JY, Ruan J, He J, Ye WY et al (2023) NUSAP1-LDHA-glycolysis-lactate feedforward loop promotes Warburg effect and metastasis in pancreatic ductal adenocarcinoma. Cancer Lett 567:216285 - PubMed
    1. Cheng A, Zhang P, Wang B, Yang D, Duan X, Jiang Y, Xu T, Jiang Y, Shi J, Ding C et al (2019) Aurora-A mediated phosphorylation of LDHB promotes glycolysis and tumor progression by relieving the substrate-inhibition effect. Nat Commun 10:5566 - PMC - PubMed

LinkOut - more resources