. 2025 Nov;17(11):2966-2994.
doi: 10.1038/s44321-025-00310-7. Epub 2025 Sep 12.

Dietary supplementation of arachidonic acid promotes humoral immunity

Affiliations

Dietary supplementation of arachidonic acid promotes humoral immunity

Shengyong Feng et al. EMBO Mol Med. 2025 Nov.

Abstract

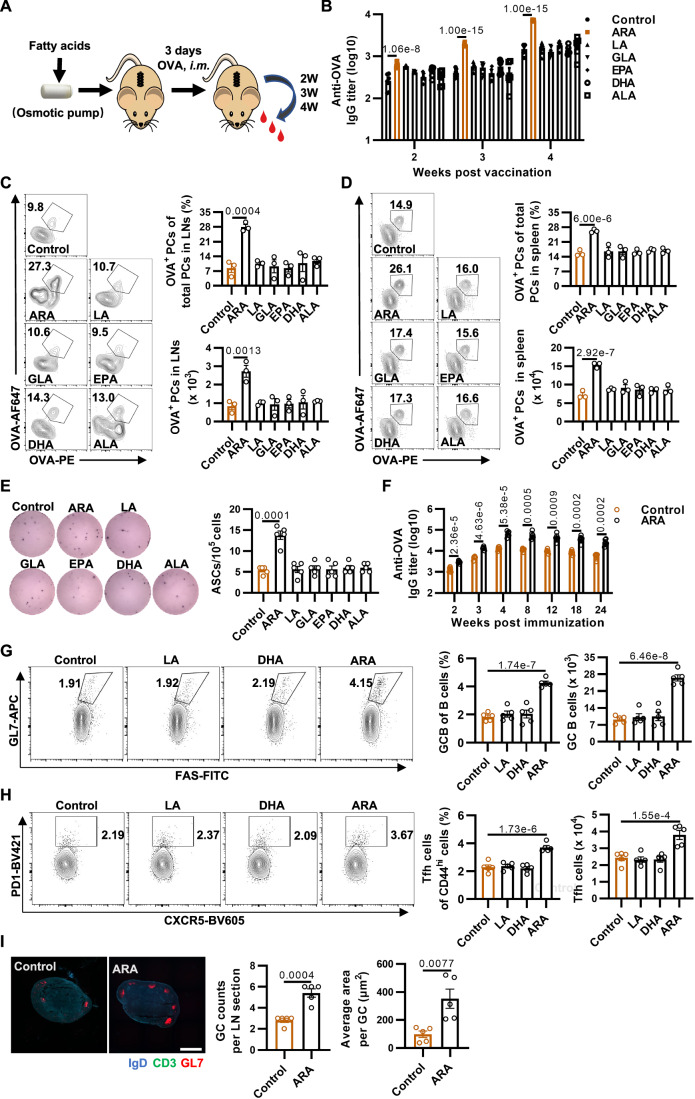
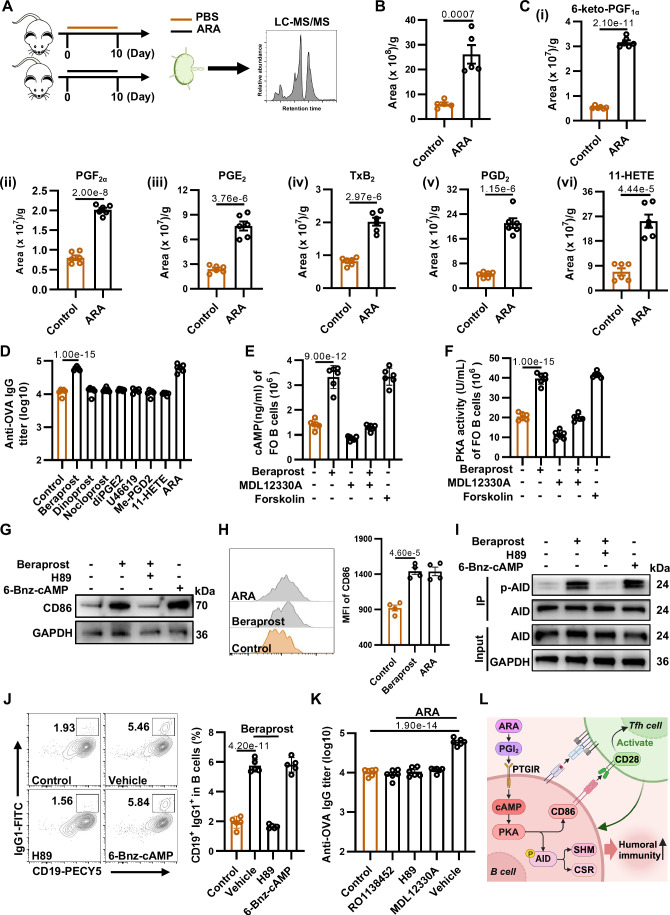
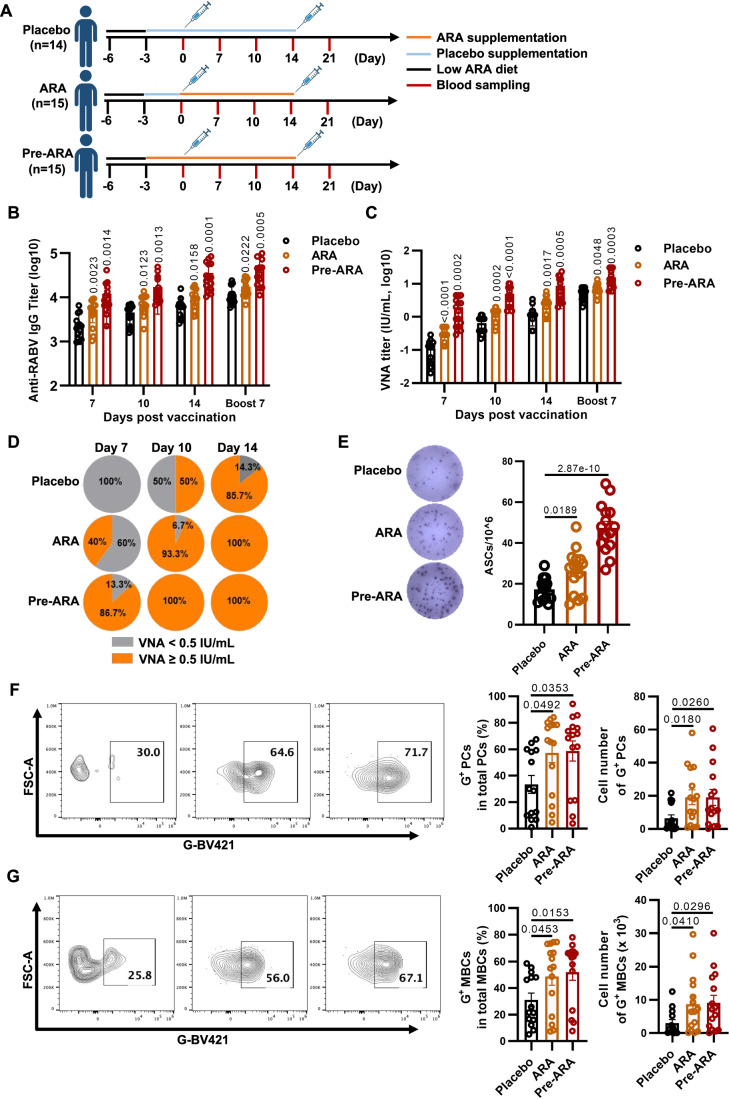
Vaccination offers the most effective protection against contagious infectious diseases primarily by inducing humoral immunity. Vaccination efficacy is influenced by various factors. We report that dietary administration of arachidonic acid (ARA) significantly boosts rabies vaccine-induced production of neutralizing antibodies and protection against lethal rabies virus (RABV) infection in mice. In human volunteers, oral supplementation of ARA accelerates the expression of neutralizing antibodies to the levels sufficient for protection against RABV as early as one week after primary immunization. Mechanistically, ARA is enriched in lymph nodes and metabolized into immune modulators there. One of the ARA metabolites, prostaglandin I2 (PGI2), via the cyclic adenosine monophosphate (cAMP)-protein kinase A (PKA) axis, upregulates the expression of costimulatory molecule CD86, and activates activation-induced cytidine deaminase (AID) in B cells. These results suggest that ARA can be a potent dietary adjuvant to foster germinal center (GC) B cell response and humoral immunity.

Keywords: Arachidonic Acid; Germinal Center Response; Humoral Immunity.


Conflict of interest statement

Disclosure and competing interests statement. The authors declare no competing interests.

Figures

Figure 1
Figure 1. Screening for long-chain polyunsaturated fatty acids (PUFAs) that promote antibody production.
(A) Schematic diagram of the study design. An osmotic pump containing 10 mg PUFAs was implanted subcutaneously in mice (6–8 weeks BALB/c strain if not otherwise specified), and the mice were i.m. immunized with 20 μg OVA (with 500 μg alum, if not otherwise specified) 3 days later. Blood samples were collected on at 2 weeks, 3 weeks, and 4 weeks after i.m. immunization to measure the OVA-specific immunoglobulin (IgG) titers. (B) OVA-specific IgG titers of mice at 2 weeks, 3 weeks, and 4 weeks after i.m. immunization with OVA under subcutaneous pump supplementation of PUFAs (n = 6). (C, D) Flow cytometry analysis of PCs (OVA+ B220low CD138+) from draining lymph nodes (C) and spleen (D) at 3 weeks after i.m. immunization with OVA (n = 3). Left: Representative flow cytometry plots of OVA-specific PCs. Right: Statistical data of the percentages and cell numbers of OVA-specific PCs. (E) Representative photograph of ELISpot plate and quantification of OVA-specific IgG ASCs from draining lymph nodes at 3 weeks post-immunization (n = 5). (F) OVA-specific antibody titers from 2 weeks throughout 24 weeks after vaccination with OVA under an experimental setting that 3-day ARA pretreatment (5 mg/day) before immunization (n = 6). (G) Flow cytometry analysis of GC B cells (CD19+ B220+ GL7+ Fas+) on day 10 after immunization with OVA. Left: Representative flow cytometry plots of GC B cells. Right: Statistical data of the percentages and cell numbers of GC B cells (n = 5). (H) Flow cytometry analysis of Tfh cells (B220 CD3+ CD8 CD4+ CD44hi CXCR5+PD-1+) in the draining lymph nodes on day 10 post-OVA immunization. Left: Representative flow cytometry plots of Tfh cells. Right: Statistical data of the percentages and cell numbers of Tfh cells (n = 5). (I) Representative images of whole lymph node sections. Lymph node sections were stained with monoclonal antibodies against IgD (blue), GL7 (red), CD3 (green). Scale bars were 500 µm. The left-hand plot shows GC numbers per lymph node, and the right-hand plot shows the average area of GC (n = 5). Data are representative of two or three independent experiments. All graphs represent mean ± SEM, and each data points represent individual mice or individual samples. Statistical significance was calculated by one-way ANOVA with Tukey’s multiple comparisons test (BE, G, H) and unpaired two-tailed t test (F, I). Source data are available online for this figure.
Figure 2
Figure 2. ARA-metabolized eicosanoid promotes the germinal center response via the cAMP–PKA axis.
(A) Schematic diagram of the study design. After supplementing ARA by gavage to mice for 10 days, lipids were extracted from the inguinal lymph nodes for liquid chromatography-tandem mass spectrometry (LC-MS/MS) analysis. (B) Quantification of ARA in the inguinal lymph nodes of the mice dietary administration of ARA by LC-MS/MS (n = 5). (C) Quantification of the significantly enhanced ARA-metabolized eicosanoids in mice’s lymph nodes with dietary ARA administration by LC-MS/MS (n = 6). (D) OVA-specific IgG titers of mice supplemented with the upregulated analogs of the eicosanoids on day 28 after i.m. immunization with OVA (n = 6). Beraprost is the analog of PGI2; Dinoprost is the analog of PGF; Nocloprost, a PGE2 analog targeting EP1 and EP3; Di-PGE2 (16,16-Dimethyl prostaglandin E2) is a PGE2 analog targeting EP2/EP4. U-46619 (9,11-Methanoepoxy PGH2) is an analog of TXA2; Me-PGD2(15(R)-15-methyl PGD2) is a metabolically stable analog of PGD2. (E, F) The intracellular cAMP levels (E) and PKA activity (F) of FO B cells were stimulated with indicated compounds: Beraprost (500 nM); MDL12330A (20 μM), the adenylyl cyclase (AC) inhibitor; Forskolin (10 μM), the AC activator, was used as the positive control (n = 6). (G) The expression level of CD86 in FO B cells stimulated with indicated compounds by immunoblotting analysis. Beraprost (500 nM); H89 (10 μM), the PKA inhibitor; 6-Bnz-cAMP (200 μM), the PKA activator, was the positive control. (H) Mean fluorescence intensity (MFI) of CD86 on FO B cells from lymph nodes of mice 10 days post-immunization with OVA (n = 4). Left: Representative flow cytometry plots. Right: Statistical data of MFI of CD86. (I) The phosphorylation level of AID in FO B cells stimulated with indicated compounds by IP assay. Beraprost (500 nM); H89 (10 μM); 6-Bnz-cAMP (200 μM). (J) Flow cytometry analysis of IgG1 expression in activated murine B cells treated with the Beraprost or Beraprost and H89, under stimulation with LPS plus IL-4. 6-Bnz-cAMP (200 μM) was the positive control (n = 5). Left: Representative flow cytometry plots of CD19+ IgG1+ B cells. Right: Statistical data of the percentages of CD19+ IgG1+ B cells. (K) OVA-specific IgG titers of mice supplemented with ARA under various inhibitors treatment on day 28 after immunization with OVA. RO1138452, inhibitor of PTGIR. MDL12330A, inhibitor of adenyl cyclase. H89, inhibitor of protein kinase A (n = 6). (L) A mechanical scheme of supplementing ARA to promote humoral immunity. Data are representative of two or three independent experiments. All graphs represent mean ± SEM, and all data points represent individual mice or individual samples. Statistical significance was calculated by unpaired two-tailed t test (B) and one-way ANOVA with Tukey’s multiple comparisons test (DF, H, J, K). Source data are available online for this figure.
Figure 3
Figure 3. ARA supplementation protects mice against virulent RABV challenge by enhancing humoral immunity.
(A) Schematic diagram of the study design. BALB/c mice were orally administered 1.25 mg or 5 mg of ARA, 5 mg of DHA, 5 mg of LA, or PBS daily for 3 days in advance. Mice were immunized with 100 μL of the solution containing 107 FFU of inactivated rabies vaccine on day 0 and administered different PUFAs or PBS orally daily for an additional 7 days. The serum was collected on days 7, 10, 14, and 21 after immunization. (B, C) The anti-RABV IgG titer (B) and RABV-specific VNA titer (C) in serum were measured by ELISA and fluorescent antibody virus neutralization (FAVN) assay, respectively (n = 8). Vaccine+ARA-L, supplementing mice with 1.25 mg ARA daily; Vaccine+ARA-H, supplementing mice with 5 mg ARA daily. (DF) On day 21 post-vaccination, the mice were challenged by 100LD50 of RABV, and body weight changes (D), clinical scores (E), and survival ratios (F) were monitored daily for 21 days. Unvaccinated mice as mock group (n = 8). (G) In a parallel group of mice, the brains were collected on day 8 and 12 post-infection. The mRNA levels of RABV-N in the whole brain, cerebral cortex, brain stem, and cerebellum were analyzed by qPCR on days 8 and 12 post-infection (n = 5). (H) Immunofluorescence stain of cerebral cortex, brain stem and cerebellum. The brain on day 12 post-infection was stained with polyclonal antibody against RABV-P and AF488-conjugated goat anti-rabbit IgG (green), and the nucleus was stained with DAPI (blue) (n = 3): scale bars were 50 µm. Data are representative of two independent experiments. All graphs represent mean ± SEM, and all data points represent individual mice or individual samples. Significance was calculated by one-way ANOVA with Tukey’s multiple comparisons test (BE, G) or log rank (Mantel–Cox) test (F). The arrows (D, E) indicate a significant difference between the group of vaccine+ARA-H and vaccine. Source data are available online for this figure.
Figure 4
Figure 4. Dietary ARA administration enhanced the anti-RABV humoral immune response in vaccinated humans.
(A) Schematic diagram of the study design. This study included three periods: washout (days −6 to −4), supplementation (days −3/0–13), and post-supplementation (days 14–21). In the washout period, participants in all three groups were required to follow an ARA-restricted to minimize the individual variation of ARA intake at a baseline. The supplementation period had no further dietary restrictions. The placebo group received capsules containing sunflower seed oil daily (n = 14); the Pre-ARA group received capsules containing 512.4 mg of ARA daily from days −3 to 13 (n = 15) and the ARA group received the same supplementation as from day 0 to13 (n = 15). However, they received a placebo in the first 3 days of supplementation (days −3 to −1) to prevent unblinding. The RABV vaccine was injected on days 0 and 14. The blood samples were collected on days 0, 7, 10, 14, and 21. The serum was separated for the detection of rabies virus-specific antibodies and neutralizing antibodies. In addition, peripheral blood mononuclear cells were isolated for subsequent flow cytometry analysis. (B, C) The anti-RABV IgG titer (B) and RABV-specific VNA titer (C) in serum were measured by ELISA and FAVN assay (n = 14 in the Placebo group; n = 15 in ARA and Pre-ARA group, respectively). (D) The proportion of volunteers with seroconversion induced by ARA. VNA values greater than 0.5 IU/ml were considered positive. (E) Representative images of ELISpot assays. On the 13 days after the first shot vaccination, PBMCs were prepared and seeded, and then the RABV-specific ASCs were counted by an ELISpot assay (n = 14 in the Placebo group; n = 15 in ARA and Pre-ARA group, respectively). (F, G) Flow cytometry analysis of RABV-specific PCs (F) and RABV-specific MBCs (G) in PBMCs 13 days after the first shot vaccination. Left: Representative flow cytometry plots of RABV-specific PCs and RABV-specific MBCs in PBMCs. Right: Statistic data of the percentages and cell numbers of RABV-specific PCs and RABV-specific MBCs (n = 14 in the Placebo group; n = 15 in ARA and Pre-ARA group, respectively). All graphs represent mean ± SEM, and all data points represent individual volunteers. Significance was calculated by one-way ANOVA with Tukey’s multiple comparisons test. Source data are available online for this figure.
Figure EV1
Figure EV1. Exploring optimal settings for oral supplementation of ARA.
(A) Fatty acid composition in murine plasma following supplementation with various PUFAs (n = 6 or n = 5). (B) OVA-specific IgG titers in mice orally administered serial doses of ARA at 2, 3, and 4 weeks post-immunization with OVA. DHA and LA were supplemented as unrelated controls (n = 6). (C) OVA-specific IgG titers in mice subjected to varying durations of ARA administration prior to immunization. DHA and LA were supplemented as unrelated controls (n = 6). (D) Changes in body weight of mice during ARA supplementation. (E) The levels of alanine aminotransferase (ALT) and aspartate aminotransferase (AST) of the mice supplemented with ARA under the optimal oral supplementation settings (n = 6). Data are representative of two independent experiments. Data are shown as mean ± SEM and each point represents an individual mouse. Significance was calculated by one-way ANOVA with Tukey’s multiple comparisons test (AC) and unpaired two-tailed t test (D, E); ns, no statistical significance.
Figure EV2
Figure EV2. The immune homeostasis was not influenced by daily ARA diet in mice spleen and lymph nodes.
(A) Schematic diagram of the study design. Mice supplemented with ARA for 10 days, and lymph nodes and spleen were collected on day 3 and day 10 for flow cytometry analysis, respectively. Mice supplemented with PBS as control. (B) Representative flow cytometry plots of lymph nodes (LNs) and spleen from mice supplemented with ARA for 3 days and 10 days to identify total B cells (B220+CD19+), CD4 T cells (CD3+ CD4+) and CD8+ T cells (CD3+ CD8+). (C, D) Percentages and absolute cell counts of B cells, CD4 T cells and CD8 T in LNs (C) and spleen (D) from mice supplemented with ARA for 3 days and 10 days (n = 6). Data are representative of two independent experiments. Data are shown as mean ± SEM and each point represents an individual mouse. Significance was calculated by unpaired two-tailed t test; ns, no statistical significance.
Figure EV3
Figure EV3. PGI2 derived from ARA promotes CD86 expression and enhances the activity of AID in FO B cells.
(A) Quantification of PGI2 from inguinal lymph nodes of mice supplemented with various PUFAs (n = 3). (B) Western Blotting analysis of PTGIR expression in lymph nodes of mice supplemented with ARA. (C) CD86 expression on activated B cells treated with vehicle, Beraprost, Beraprost plus H89, or 6-Bnz-cAMP alone (n = 6). Left: Representative flow cytometry plots. Right: Statistic data of the mean fluorescence intensity (MFI) of CD86. (D) Expression levels of CD86 on stimulated FO B cells following treatment with varying concentrations of Beraprost (n = 5). Left: Representative flow cytometry plots. Right: Statistic data MFI of CD86. (E) Flow cytometry analysis of the percentage of CD19+ IgG1+ B cells under stimulations of different concentrations of Beraprost (n = 3). Left: Representative flow cytometry plots. Right: Statistic data of the CD19+ IgG1+ B cells. (F) Flow cytometry analysis of GC B cells (B220+ GL7+ FAS+) from mice supplemented with ARA under various inhibitors treatment on day 10 after immunization with OVA (n = 4). Left: Representative flow cytometry plots of GC B cells. Right: Statistic data of the percentages and cell numbers of GC B cells. (G, H) B Cell and T cell proliferation measured by CellTrace Violet (CTV) dye in LPS/IL-4-activated murine B cells treated with Beraprost (500 nM) and ARA (1 μM) (n = 6). Left: Representative flow cytometry plots. Right: Statistic data of the proliferation index of B cells and T cells. Data are representative of two or three independent experiments. All graphs represent mean ± SEM and all data points represent individual mice. Significance was calculated by one-way ANOVA with Tukey’s multiple comparisons test; ns, no statistical significance.
Figure EV4
Figure EV4. Humoral immunity enhanced by ARA supplementation protects immunized mice against RABV challenge.
(A) Quantitative analysis of ARA, DHA and LA concentrations in murine plasma two weeks following cessation of dietary supplementation (n = 3). (B) Virus titers in mouse brain. The mice brains were collected at day 8 and day 12 post-infection and virus titers were calculated and expressed as focus-forming units per ml (FFU/mL) (n = 5). LOD, limit of detection. (C, D) Clinical scores and survival curves of mice that received immune sera before challenge (n = 8). The mice were intraperitoneally (i.p.) administrated with 200 μL sera. One day later, mice were i.m. challenged with 100 LD50 of RABV. Sera-Mock, the mice were received sera from mice without vaccination. Sera-PBS, the mice were received sera from immunized mice that supplemented with PBS. Sera-ARA, the mice were received sera from immunized mice that supplemented with ARA. RABVac, the mice were immunized with the inactivated rabies vaccine without receiving any sera. (E, F) Clinical scores and survival curves of mice received PBS or ARA (n = 8). The mice were administered with ARA (5 mg) or PBS control for 10 days. Fourteen days later, the animals were i.m. challenged with 100 LD50 of RABV, and clinical scores and survival were monitored. The arrows (C) indicate a significant difference between the group of Sera-PBS and Sera-ARA. Data are representative of two independent experiments. Data are shown as mean ± SEM and all data points represent individual mice. Significance was calculated by one-way ANOVA with Tukey’s multiple comparisons test (A, B), unpaired two-tailed t test (C, E) and log rank (Mantel–Cox) test (D, F); ns, no statistical significance.
Figure EV5
Figure EV5. The effects of ARA supplementation on PBMCs sourced from volunteers.
(A) Flow diagram of the study. Placebo, taking 512.4 mg sunflower seed oil daily (n = 14). Pre-ARA, taking 512.4 mg of ARA daily on day −3–13 (n = 15); ARA, taking 512.4 mg of ARA daily on day 0–13 (n = 15); (B) Quantitative analysis of PUFA concentrations in plasma obtained from volunteers supplemented with ARA (n = 14 in Placebo group; n = 15 in ARA and Pre-ARA group). (C) Statistic data of the percentages and cell numbers of granulocytes, monocytes, total lymphocytes, CD4 T cells, and CD8 T cells in the PBMCs on day 14 after the first shot immunization (n = 14 in Placebo group; n = 15 in ARA and Pre-ARA group). All graphs represent mean ± SEM, and all data points represent individual volunteers. Significance was calculated by one-way ANOVA with Tukey’s multiple comparisons test; ns, no statistical significance.

References

    1. Almoshari Y (2022) Osmotic pump drug delivery systems—a comprehensive review. Pharmaceuticals 15:1430 - PMC - PubMed
    1. Andorko JI, Tostanoski LH, Solano E, Mukhamedova M, Jewell CM (2014) Intra-lymph node injection of biodegradable polymer particles. J Vis Exp 83:e50984 - PMC - PubMed
    1. Barbier AJ, Jiang AY, Zhang P, Wooster R, Anderson DG (2022) The clinical progress of mRNA vaccines and immunotherapies. Nat Biotechnol 40:840–854 - PubMed
    1. Barreto V, Reina-San-Martin B, Ramiro AR, McBride KM, Nussenzweig MC (2003) C-terminal deletion of AID uncouples class switch recombination from somatic hypermutation and gene conversion. Mol Cell 12:501–508 - PubMed
    1. Borriello F, Sethna MP, Boyd SD, Schweitzer AN, Tivol EA, Jacoby D, Strom TB, Simpson EM, Freeman GJ, Sharpe AH (1997) B7-1 and B7-2 have overlapping, critical roles in immunoglobulin class switching and germinal center formation. Immunity 6:303–313 - PubMed

LinkOut - more resources