. 2025 Aug 30;14(17):1352.
doi: 10.3390/cells14171352.

Targeting Diabetic Retinopathy with Human iPSC-Derived Vascular Reparative Cells in a Type 2 Diabetes Model

Affiliations

Targeting Diabetic Retinopathy with Human iPSC-Derived Vascular Reparative Cells in a Type 2 Diabetes Model

Sergio Li Calzi et al. Cells. .

Abstract

Purpose: To investigate the therapeutic potential of inducible pluripotent stem cell (hiPSC)-based vascular repair, we evaluated two vascular reparative cell populations, CD34+ cells derived from hiPSC (hiPSC-CD34+) and endothelial colony forming cells (ECFCs) derived from hiPSC (iPS-ECFCs), alone and in combination, in a type 2 diabetic (db/db) mouse model of DR. Methods: hiPSC-CD34+ cells (1 × 10⁴) or iPSC- ECFCs (1 × 10⁵) alone or in combination (1.1 × 10⁵) were injected into the vitreous of immunosuppressed db/db mice with six months of established diabetes. One month post-injection, mice underwent electroretinography (ERG) and optical coherence tomography (OCT) to evaluate functional and structural retinal recovery with iPSC administration. Immunohistochemistry (IHC) was used to assess recruitment and incorporation of cells into the retinal vasculature. Retinas from the experimental groups were analyzed using Functional Proteomics via Reverse Phase Protein Array (RPPA). Results: Functional assessment via ERG demonstrated significant improvements in retinal response in the diabetic cohorts treated with either hiPSC-derived CD34+ cells or hiPSC-ECFCs. Retinal thickness, assessed by OCT, was restored to near-nondiabetic levels in mice treated with hiPSC-CD34+ cells alone and the combination group, whereas hiPSC-ECFCs alone did not significantly affect retinal thickness. One month following intravitreal injection, hiPSC-CD34+ cells were localized to perivascular regions, whereas hiPSC-ECFCs were observed to integrate directly into the retinal vasculature. RPPA analysis revealed interaction-significant changes, and this was interpreted as a combination-specific, non-additive host responses (m6A, PI3K-AKT-mTOR, glycolysis, endothelial junction pathways). Conclusions: The studies support that injection of hiPSC-CD34+ cells and hiPSC-ECFCs, both individually and in combination, showed benefit; however, iPSC combination-specific effects were identified by measurement of retinal thickness and by RPPA.

Keywords: CD34 cells; KNA cells; diabetic retinopathy; endothelial colony forming cells; inducible pluripotent stem cells; vascular repair.


Conflict of interest statement

The authors declare no conflicts of interest.

Figures

Figure 1
Figure 1
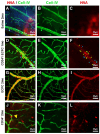
KNA+ cells migrate to areas of retinal injury in db/db mice and become pericytes. Representative confocal images of retinal flat mounts from db/db mice injected with KNA+ cells from healthy donors. KNA+ cells migrate deep into the retina of db/db mice and accumulate next to the damaged blood vessels (AC). Conversely, in db/m (non-diabetic mice), the cells remain on the retinal surface (D). Retinas are stained with collagen IV (A,B,D) or agglutinin (AGG) (C) for the detection of blood vessels (green), and with human nuclear antigen (HNA, red) to identify the iPSC-derived KNA+ cells of human origin. Confocal images of retinal flat mounts (E,G,I) and cross sections (F,H,J) from db/db mice injected with KNA+ iPSC. The retinas are stained with NG2 for the detection of pericytes (green), and with human nuclear antigen (HNA, red) to identify cells of human origin. Arrows highlight human cells. Nuclei were stained with DAPI (blue). The number of injected mice in each group was as follows: db/db iPSC-KNA+: n = 8; db/m iPSC-KNA+: n = 8.
Figure 2
Figure 2
One- and two-month time points after stem cell injections. iPSC-CD34+ cells migrate to injured blood vessels while iPS-ECFCsincorporate into the damaged vessel walls of diabetic mice. Representative confocal images of retinal flat mounts from diabetic mice injected with Saline (AC) or the combination of iPSC-ECFC and iPSC-CD34+ cells (DF) or iPSC-ECFC (GI) or iPSC-CD34+ cells (JL). Retinas are stained with collagen-IV for the detection of blood vessels (green), and with HNA (red) to identify cells of human origin. Yellow arrowheads (D,F) highlight iPSC ECFCs incorporated in the blood vessels, while blue arrowheads (D,F) indicate iPSC-CD34+ cells with perivascular localization. Yellow arrowhead (J) indicates an acellular capillary, the hallmark of diabetic retinopathy. The number of injected db/db mice in each group was as follows: Saline: n = 7; iPSC-CD34+: n = 5; iPSC-ECFCs: n = 4; iPSC-CD34+/iPSC-ECFCs: n = 5.
Figure 3
Figure 3
ERG and OCT changes in hiPSC-treated mice. Whole animal dark-adapted (A) and light-adapted (B) flash ERGs were performed on db/db mice. Mean waveforms in response to the 10dB light flash intensity evaluated and quantification of Scotopic a-wave amplitudes (C), Scotopic b-wave amplitudes (D), and Photopic b-wave amplitudes (E). Quantification of retinal thickness by OCT (F). En-face view of the posterior segment with the optic nerve head. The green line indicates the area of the retina where the B-scan image was taken (G,I,K,M). Representative OCT B-scan images of mouse retina from cross-sectional scan of en-face images from db/db mice injected with saline (H), iPSC-CD34+ cells (J), iPSC-ECFC (L), and the combination of iPSC-CD34+ cells and iPSC-ECFCs (N). Retinal thickness was assessed by OCT. When compared to saline-injected mice, total retinal thickness significantly improved in mice injected with hiPSC-CD34+, hiPSC-ECFCs, and the combination of cells. * p ≤ 0.05, ** p ≤ 0.005, and *** p ≤ 0.0005. The number of injected db/db mice in each group was as follows: Saline: n = 7; iPSC-CD34+: n = 5; iPSC-ECFCs: n = 4; iPSC-CD34+/iPSC-ECFCs: n = 5. Injected db/m mice: Saline: n = 5.
Figure 4
Figure 4
Trajectory analysis using the RPPA data and Phase Protein Array. Trajectory-Associated Pathway enrichment analysis (A) showing signaling pathways significantly associated with the pseudotime trajectory derived from principal curve analysis. The chart displays the top 10 signaling pathways (filtered for terms containing “signaling”) ranked by statistical significance. Protein expression changes along the trajectory were tested for association with canonical pathways using pathfindR. This identifies key biological processes that are dynamically regulated along the inferred treatment progression pathway. Principal Component Analysis (PCA) (B) of reverse-phase protein array (RPPA) data from 15 samples across four treatment groups: saline control (n = 5), iPSC-CD34+ cells (n = 4), iPSC-ECFC (n = 3), and combination treatment (combo, n = 3). Each point represents a sample, colored by treatment group. The plot shows the first two principal components, which capture the major sources of variation in the protein expression data. Polygon frames outline the boundaries for each group. The analysis reveals distinct clustering patterns among treatment groups, with a clear separation between the combination treatment and other conditions. Principal curve analysis was fitted to the first two principal components of the RPPA data. Blue points represent individual samples projected onto the principal curve (pink line, smoothed using smooth spline method with stretch parameter = 2). Dark red points show the projection of each sample onto the fitted curve. Sample labels indicate cell types. The principal curve represents a trajectory through the data that captures the major pattern of variation, potentially representing a treatment progression pathway. This analysis provides a pseudotime ordering of samples based on their position along the curve.
Figure 5
Figure 5
Heatmap of gene expression profiles in iPSC-ECFC versus Combination treatment conditions. Heatmap showing expression patterns of 70 significant protein forms across samples grouped by treatment conditions in a 2 × 2 experimental design (CD34+/CD34 and ECFC+/ECFC). Rows represent individual proteins (including total and phosphorylated forms), and columns represent individual samples. Expression values were z-score normalized across rows to show relative expression differences within each protein. The color scale reflects z-scores, with blue indicating below-average expression and red indicating above-average expression for each protein across all samples. Hierarchical clustering grouped proteins by similarity in expression patterns and organized samples based on treatment status.

References

    1. Moss S.E., Klein R., Klein B.E. The 14-year incidence of visual loss in a diabetic population. Ophthalmology. 1998;105:998–1003. doi: 10.1016/S0161-6420(98)96025-0. - DOI - PubMed
    1. Antonetti D.A., Barber A.J., Bronson S.K., Freeman W.M., Gardner T.W., Jefferson L.S., Kester M., Kimball S.R., Krady J.K., LaNoue K.F., et al. Diabetic retinopathy: Seeing beyond glucose-induced microvascular disease. Diabetes. 2006;55:2401–2411. doi: 10.2337/db05-1635. - DOI - PubMed
    1. Klein B.E. Overview of epidemiologic studies of diabetic retinopathy. Ophthalmic Epidemiol. 2007;14:179–183. doi: 10.1080/09286580701396720. - DOI - PubMed
    1. Cheung N., Mitchell P., Wong T.Y. Diabetic retinopathy. Lancet. 2010;376:124–136. doi: 10.1016/S0140-6736(09)62124-3. - DOI - PubMed
    1. Yau J.W., Rogers S.L., Kawasaki R., Lamoureux E.L., Kowalski J.W., Bek T., Chen S.J., Dekker J.M., Fletcher A., Grauslund J., et al. Global prevalence and major risk factors of diabetic retinopathy. Diabetes Care. 2012;35:556–564. doi: 10.2337/dc11-1909. - DOI - PMC - PubMed

LinkOut - more resources