. 2025 Sep 4;17(17):2905.
doi: 10.3390/cancers17172905.

PIAS1 Shapes a Tumor-Suppressive Microenvironment by Suppressing Immune Evasion in Oral Squamous Cell Carcinoma

Affiliations

PIAS1 Shapes a Tumor-Suppressive Microenvironment by Suppressing Immune Evasion in Oral Squamous Cell Carcinoma

Parisa Ghahremanifard et al. Cancers (Basel). .

Abstract

Background: The SUMO E3 ligase PIAS1 (Protein Inhibitor of Activated STAT1) regulates pathways such as TGFβ signaling and has been implicated in multiple cancers. However, its role in the tumor microenvironment (TME), particularly in non-malignant stromal and immune cells, remains poorly understood. This study aimed to characterize the expression and functional relevance of PIAS1 within the TME of oral squamous cell carcinoma (OSCC).

Methods: PIAS1 protein expression was assessed via immunohistochemistry (IHC) on OSCC tissue microarrays. Single-cell RNA-sequencing (scRNA-seq) datasets from OSCC tumors and normal tissues were analyzed to map cell-type-specific PIAS1 expression. Downstream effects were evaluated using differential gene expression, Ingenuity Pathway Analysis (IPA), gene set enrichment analysis (GSEA), and cell-cell communication inference.

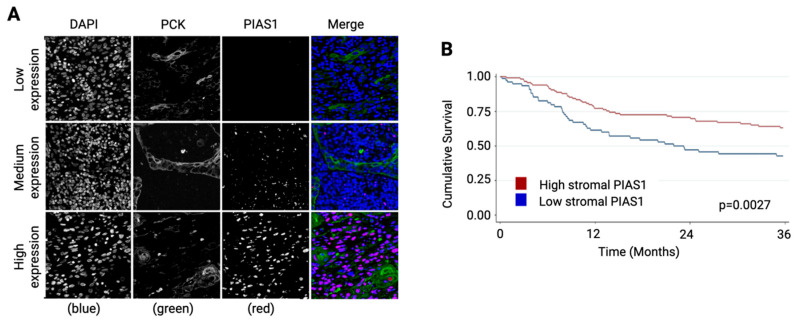
Results: IHC analysis revealed that higher stromal PIAS1 levels correlated with improved survival. scRNA-seq analysis showed an increase in the proportion of PIAS1-expressing cells across most stromal and immune cell populations within OSCC-derived tumors compared to their counterparts in adjacent normal tissue. However, when comparing PIAS1-positive cells, expression levels were significantly reduced in cancer cells, CAFs, TAMs, T cells, and endothelial cells within the TME. PIAS1-positive CAFs, TAMs, and T cells exhibited activation of apoptotic and tumor-suppressive pathways, while PIAS1-negative counterparts showed enrichment of immunosuppressive signaling and immune checkpoint expression. Cell-cell communication analyses indicated that PIAS1 fosters an immune-activated TME by promoting pro-inflammatory signaling, M1-like TAM polarization, and T cell activation.

Conclusions: PIAS1 expression in stromal and immune cells is associated with tumor-suppressive reprogramming of the OSCC microenvironment. These findings position PIAS1 as a potential modulator of anti-tumor immunity and candidate target for therapeutic intervention.

Keywords: PIAS1; oral squamous cell carcinoma; single-cell RNA-seq; tumor microenvironment.


Conflict of interest statement

The authors declare no conflicts of interest. The funders had no role in the design of the study; in the collection, analyses, or interpretation of data; in the writing of the manuscript; or in the decision to publish the results.

Figures

Figure 1
Figure 1
Fluorescence immunohistochemistry analysis of OSCC TMAs. (A) Representative immunofluorescence images of stromal PIAS1 staining in OSCC patient samples from the Ohlson cohort, demonstrating DAPI-stained nuclei (blue), anti-pan-cytokeratin-stained tumor epithelial cells (green), and anti-PIAS1 staining (red). (B) Kaplan–Meier curve comparing overall survival (OS) between patients with high versus low stromal PIAS1 expression, dichotomized at the median.
Figure 2
Figure 2
Single-cell RNAseq analysis of OSCC samples. UMAP visualization of cells from (A) OSCC tissues, indicating assigned cell types; (B) normal tissues, indicating assigned cell types; (C) integrated normal (in blue) and OSCC tissue (in red); (D) integrated normal and OSCC data, indicating assigned cell type.
Figure 3
Figure 3
Transcriptomic differences between PIAS1+ versus PIAS1-cells in the TME. (A) Bar plot showing the percentage of cells expressing PIAS1 across major cell types in normal (NL) and OSCC (CA) tissues. (B) Boxplots comparing normalized PIAS1 expression levels between normal and cancer-associated cells across major cell types. Statistical significance was assessed using the Wilcoxon rank-sum test (****, adjusted p < 0.0001). (C) UMAP visualization of integrated single-cell RNA-seq data from HPV-negative OSCC samples across three cohorts (Choi [10], Kürten [13], Quah [14]), colored by cell type. (D) UMAP visualization of integrated single-cell RNA-seq data from HPV-negative OSCC samples across three cohorts (Choi [10], Kürten [13], Quah [14]), colored by study cohort. (E) Ingenuity Pathway Analysis (IPA) “Diseases and Bio Functions” enriched in differentially expressed genes between PIAS1+ and PIAS1-cells within CAFs, TAMs, and T cells from the integrated data. Displaying top activated (positive z-scores, red) and top inhibited (negative z-scores, blue) biological functions per cell type.
Figure 4
Figure 4
Gene set enrichment analysis of cytokine and checkpoint protein encoding genes in PIAS1+ versus PIAS1-cells in the TME. Gene set enrichment analysis (GSEA) demonstrating enrichment of anti-inflammatory cytokines in (A) CAFs and (B) TAMs comparing PIAS1+ and PIAS1-cells from tumor samples. Immune checkpoint gene expression comparisons between PIAS1+ and PIAS1–cells across T cells (C), cancer cells (D), CAFs (E), and TAMs (F). Statistical significance was assessed using Wilcoxon rank-sum test: **** p < 0.0001, *** p < 0.001, ** p < 0.01, * p < 0.05, ns = not significant.
Figure 5
Figure 5
Cell–cell communication analysis between cancer cells and other cells in the TME stratified by PIAS1 expression. (A) Outgoing signals from CAFs to cancer cells. (B) Incoming signals to CAFs from cancer cells. (C) Outgoing signals from TAMs to cancer cells. (D) Incoming signals to TAMs from cancer cells. (E) Outgoing signals from T cells to cancer cells. (F) Incoming signals to T cells from cancer cells. Arrows represent ligand–receptor pairs, with directionality pointing toward the receiver cell type. Line thickness reflects the magnitude of the interaction change (Δ Interaction Probability), with red lines indicating increased interactions in PIAS1+ cells and blue lines indicating increased interactions in PIAS1-cells.

References

    1. Bellantoni M.I., Picciolo G., Pirrotta I., Irrera N., Vaccaro M., Vaccaro F., Squadrito F., Pallio G. Oral Cavity Squamous Cell Carcinoma: An Update of the Pharmacological Treatment. Biomedicines. 2023;11:1112. doi: 10.3390/biomedicines11041112. - DOI - PMC - PubMed
    1. Babu S., Manavalan M.J., Hifza Jasmine S., Krishnan M. Tumor microenvironment in oral squamous cell carcinoma: Implications for novel therapies. [(accessed on 27 May 2025)];Oral Oncol. Rep. 2024 12:100666. doi: 10.1016/j.oor.2024.100666. Available online: https://www.sciencedirect.com/science/article/pii/S2772906024005120?ref=.... - DOI
    1. Li X., Rasul A., Sharif F., Hassan M. PIAS family in cancer: From basic mechanisms to clinical applications. Front. Oncol. 2024;14:1376633. doi: 10.3389/fonc.2024.1376633. - DOI - PMC - PubMed
    1. Puhr M., Hoefer J., Eigentler A., Dietrich D., van Leenders G., Uhl B., Hoogland M., Handle F., Schlick B., Neuwirt H., et al. PIAS1 is a determinant of poor survival and acts as a positive feedback regulator of AR signaling through enhanced AR stabilization in prostate cancer. Oncogene. 2015;35:2322–2332. doi: 10.1038/onc.2015.292. - DOI - PMC - PubMed
    1. Dadakhujaev S., Salazar-Arcila C., Netherton S.J., Chandhoke A.S., Singla A.K., Jirik F.R., Bonni S. A novel role for the SUMO E3 ligase PIAS1 in cancer metastasis. Oncoscience. 2014;1:229–240. doi: 10.18632/oncoscience.27. - DOI - PMC - PubMed

LinkOut - more resources