. 2025 Sep 3;26(17):8587.
doi: 10.3390/ijms26178587.

Integrated Multi-Omics Analysis Reveals the Role of Resveratrol in Regulating the Intestinal Function of Megalobrama amblycephala via m6A Methylation

Affiliations

Integrated Multi-Omics Analysis Reveals the Role of Resveratrol in Regulating the Intestinal Function of Megalobrama amblycephala via m6A Methylation

Zhengyan Gu et al. Int J Mol Sci. .

Abstract

Resveratrol (RES), a natural polyphenol with lipid metabolism-regulating properties, also demonstrates remarkable efficacy in strengthening intestinal barrier integrity. In order to elucidate the mechanism by which RES ameliorates intestinal damage and lipid metabolism disturbances in Megalobrama amblycephala under a high-fat (HF) diet, a conventional diet (CON), an HF diet (HF), or an HF diet supplemented with 0.6, 3, or 6 g/kg RES (HF + 0.06%, 0.3%, or 0.6% RES) was fed to fish. After 8 weeks, RES supplementation in the HF diet significantly improved the growth performance and alleviated hepatic lipid deposition. Microbiota profiling revealed RES improved intestinal barrier function by reducing α-diversity, Actinobacteria and Bosea abundances, and enriching Firmicutes abundance. RES also maintained the integrity of the intestinal physical barrier and inhibited the inflammatory response. MeRIP-seq analysis indicated that RES modulated intestinal mRNA m6A methylation by upregulating methyltransferase-like 3 (mettl3) and downregulating fat mass and obesity-associated gene (fto) and Alk B homolog 5 (alkbh5). Combined RNA-seq and MeRIP-seq data revealed that RES alleviated endoplasmic reticulum stress (ERS) by upregulating the m6A methylation and gene level of heat shock protein 70 (hsp70). Correlation analyses identified significant associations between intestinal microbiota composition and ERS, tight junction, and inflammation. In summary, RES ameliorates lipid dysregulation via a synergistic mechanism involving intestinal microbiota, m6A modification, ERS, barrier function, and inflammatory response.

Keywords: endoplasmic reticulum stress; high lipid metabolism; intestinal barrier function; m6A methylation; resveratrol.


Conflict of interest statement

The authors declare no conflicts of interest.

Figures

Figure 1
Figure 1
Effects of RES on the growth performance and lipid metabolism of juveniles fed with an HF diet. (AC) Growth performance indicators: weight gain rate (WGR), specific growth rate (SGR), and feed conversion ratio (FCR). (DF) Plasma biochemical parameters: alanine aminotransferase (ALT), total cholesterol (TC), and low-density lipoprotein (LDL). (G,H) Nile Red staining of hepatic tissues; red fluorescence (white arrows) indicates lipid droplets, and blue fluorescence marks nuclei. (IL) Hepatic mRNA levels of peroxisome proliferator-activated receptor alpha (ppar-α), peroxisome proliferator-activated receptor beta (ppar-β), lipoprotein lipase (lpl), and cholesterol 7-alpha hydroxylase (cyp7a1). HF-RES group stands for HF + 0.06% RES group. Data are expressed as mean ± standard error mean (SEM). Significant differences in Independent t-test are denoted by asterisks, * p < 0.05, ** p < 0.01, and ns indicates no significant difference. While differences in Duncan’s test are labeled with distinct lowercase letters (p < 0.05).
Figure 1
Figure 1
Effects of RES on the growth performance and lipid metabolism of juveniles fed with an HF diet. (AC) Growth performance indicators: weight gain rate (WGR), specific growth rate (SGR), and feed conversion ratio (FCR). (DF) Plasma biochemical parameters: alanine aminotransferase (ALT), total cholesterol (TC), and low-density lipoprotein (LDL). (G,H) Nile Red staining of hepatic tissues; red fluorescence (white arrows) indicates lipid droplets, and blue fluorescence marks nuclei. (IL) Hepatic mRNA levels of peroxisome proliferator-activated receptor alpha (ppar-α), peroxisome proliferator-activated receptor beta (ppar-β), lipoprotein lipase (lpl), and cholesterol 7-alpha hydroxylase (cyp7a1). HF-RES group stands for HF + 0.06% RES group. Data are expressed as mean ± standard error mean (SEM). Significant differences in Independent t-test are denoted by asterisks, * p < 0.05, ** p < 0.01, and ns indicates no significant difference. While differences in Duncan’s test are labeled with distinct lowercase letters (p < 0.05).
Figure 2
Figure 2
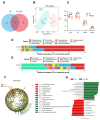
Intestinal microbiota analysis of juveniles M. amblycephala. HF-RES group stands for HF + 0.06% RES group. (A) Venn diagram of OTUs in the intestinal microbiota of juvenile M. amblycephala. (B) PCA of intestinal microbiota in juvenile M. amblycephala. (C) Alpha diversity indices (Shannon, Simpson, Chao1, and ACE) of intestinal microbiota; values above the error bars indicate p-values. (D) Differential microbiota at the phylum classification. (E) Differential microbiota at genus classification. (F) Evolutionary branching diagram. (G) Histogram of LDA scores distribution (LDA > 2). LEfSe was performed using the OmicStudio tools at https://www.omicstudio.cn/tool/ accessed on 20 May 2025.
Figure 3
Figure 3
RES role in maintaining intestinal barrier health in juveniles M. amblycephala fed with an HF diet. HF-RES group stands for HF + 0.06% RES group. (AC) H&E staining of the intestinal tissues, (a) Villus length, (b) muscular layer thickness. (DF) Gene expression levels of junctional adhesion molecule 2 (jam2), zonula occludens 1 (zo1), and claudin41. (GI) Glutathione (GSH), lipid peroxide (LPO), and malondialdehyde (MDA) levels as indicators of intestinal antioxidant status. (JL) Expression levels of inflammatory markers: toll-like receptor 4 (tlr4), nuclear factor kappa-B (nf-κb), and interleukin-1beta (il-1β). Data are presented as mean ± Standard Error Mean (SEM). Significant differences determined by Independent t-test are indicated by asterisks: * p < 0.05, ** p < 0.01, and ns indicates no significant difference.
Figure 4
Figure 4
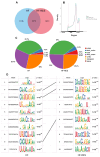
MeRIP-seq analysis of the intestinal tissues. HF-RES group stands for HF + 0.06% RES group. (A) Venn diagram of mRNA m6A peaks in HF and HF-RES groups. (B) Distribution of m6A peaks across mRNA CDS, 5′ UTR, and 3′ UTR regions in HF and HF-RES groups. (C) Pie charts illustrating the regional distribution of m6A peaks in the HF and HF-RES group. (D) Sequence motifs enriched in m6A-modified region in both groups.
Figure 5
Figure 5
Analysis of GO and KEGG enrichment for differential m6A peaks. (A) GO enrichment scatter plot. (B) KEGG enrichment scatter plot.
Figure 6
Figure 6
Relationship between DEGs and differential m6A peaks. HF-RES group stands for HF + 0.06% RES group. (A) DEGs Volcano plot between HF and HF-RES group. (B) Four-quadrant plot illustrating the association between DEGs and differential m6A peaks. Red represents significant upregulation, blue represents significant downregulation, and gray represents insignificant differences. (C) GO enrichment scatter plot for DEGs under an integrated analysis of MeRIP-seq and RNA-seq. (D) KEGG enrichment scatter plot for DEGs under an integrated analysis of MeRIP-seq and RNA-seq.
Figure 7
Figure 7
Expression analysis of intestinal m6A methylation and ERS-related genes. HF-RES group stands for HF + 0.06% RES group. (AI) Intestinal gene expression levels of mettl3, fto, alkbh5, YTH N6-methyladenosine RNA binding protein 2 (ythdf2), hsp70, mammalian target of rapamycin (mtor), activating transcription factor 6 (atf6), C/EBP-homologous protein (chop) and B-cell lymphoma-2 (bcl-2). Data are presented as mean ± standard error mean (SEM). Significant differences determined by Independent t-test are indicated by asterisks: * p < 0.05, ** p < 0.01, and ns indicates no significant difference.
Figure 8
Figure 8
Intestinal microbiota, m6A methylation, intestinal barrier, and lipid metabolism correlation analysis. (A) Pearson correlation heatmap. Red and blue indicate positive and negative correlations, respectively. Color intensity and square size reflect the strength of associations. * p < 0.05, ** p < 0.01. (B) Combined Pearson correlation heatmap and Mantel test-based network analysis. The network diagram illustrates significant correlations with solid lines (p < 0.05); line thickness corresponds to the absolute value of the correlation coefficient.

References

    1. Fu S., Xie X., Zhang W., Cao Z. The nuntrition of Silurus meridionalis: III. protein-sparing effect og dietary lipid. Acta Hydrobiol. Sin. 2001;25:70–75. doi: 10.3724/issn1000-3207-2001-1-70-3. - DOI
    1. Lu K., Xu W., Li J., Li X., Huang G., Liu W. Alterations of liver histology and blood biochemistry in blunt snout bream Megalobrama amblycephala fed high-fat diets. Fish. Sci. 2013;79:661–671. doi: 10.1007/s12562-013-0635-4. - DOI
    1. Wei M., Song L., Yuan X., Li H., Ji H., Sun J. Dietary supplementation with a PPARγ agonist promotes adipocyte hyperplasia and improves high-fat diet tolerance and utilization in grass carp (Ctenopharyngodon idellus) Aquaculture. 2023;578:740081. doi: 10.1016/j.aquaculture.2023.740081. - DOI
    1. Wei M., Yuan X., Song L., Li H., Ji H., Sun J. Comparative proteomic analysis of pathological characterization of adipose tissue remodeling induced by high-fat diet and high-carbohydrate diet in grass carp (Ctenopharyngodon idellus) Aquaculture. 2024;590:741079. doi: 10.1016/j.aquaculture.2024.741079. - DOI
    1. Yu C., Zhang J., Qin Q., Liu J., Xu J., Xu W. Berberine improved intestinal barrier function by modulating the intestinal microbiota in blunt snout bream (Megalobrama amblycephala) under dietary high-fat and high-carbohydrate stress. Fish Shellfish Immunol. 2020;102:336–349. doi: 10.1016/j.fsi.2020.04.052. - DOI - PubMed

MeSH terms

LinkOut - more resources