. 2025 Sep 7;26(17):8728.
doi: 10.3390/ijms26178728.

Lignin-Derived Oligomers as Promising mTOR Inhibitors: Insights from Dynamics Simulations

Affiliations

Lignin-Derived Oligomers as Promising mTOR Inhibitors: Insights from Dynamics Simulations

Sofia Gabellone et al. Int J Mol Sci. .

Abstract

The mammalian target of rapamycin pathway, mTOR, is a crucial signaling pathway that regulates cell growth, proliferation, metabolism, and survival. Due to its dysregulation it is involved in several ailments such as cancer or age-related diseases. The discovery of mTOR and the understanding of its biological functions were greatly facilitated by the use of rapamycin, an antibiotic of natural origin, which allosterically inhibits mTORC1, effectively blocking its function. In this entirely computational study, we investigated mTOR's interaction with seven ligands: two clinically established inhibitors (everolimus and rapamycin) and five lignin-derived oligomers, a renewable natural polyphenol recently used for the drug delivery of everolimus. The seven complexes were analyzed through all-atom molecular dynamics simulations in explicit solvent using a high-performance computing platform. Trajectory analyses revealed stable interactions between mTOR and all ligands, with lignin-derived compounds showing comparable or enhanced binding stability relative to reference drugs. To evaluate the stability of the molecular complex and the behavior of the ligand over time, we analyzed key parameters including root mean square deviation, root mean square fluctuation, number of hydrogen bonds, binding free energy, and conformational dynamics assessed through principal component analysis. Our results suggest that lignin fragments are a promising, sustainable scaffold for developing novel mTOR inhibitors.

Keywords: MM/PBSA binding free energy; everolimus; high-performance computing (HPC); hydrophobic and hydrogen bond interactions; lignin-derived oligomers; mTOR; mTOR inhibitors; molecular dynamics (MD) simulations; rapamycin.


Conflict of interest statement

The authors declare no conflicts of interest.

Figures
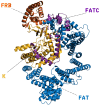
Figure 1
Figure 1
Cartoon representation of mTOR’s domain architecture: the extended N-terminal FAT α-helical scaffold (residues 1–629, blue) supports the FRB regulatory segment (residues 630–763, orange), followed by the catalytic kinase (K) domain of the PIKK family (residues 764–1045, yellow) and the short C-terminal FATC motif (residues 1046–1164, purple). Dashed leaders mark the labeled domains; the contiguous arrangement of FAT–FRB–K–FATC shown here illustrates how regulatory inputs are structurally transmitted to the active site.
Figure 2
Figure 2
RMSD plot of the mTOR protein (blue) and everolimus ligand (red) over a 1000 ns molecular dynamics simulation. The protein structure shows a gradual increase from around 0.50 nm (400–600 ns) to approximately 0.55 nm (800–1000 ns) after the initial equilibration phase, while the ligand maintains a lower and relatively stable RMSD around 0.43 nm, indicating persistent binding stability within the mTOR active site.
Figure 3
Figure 3
RMSD of the mTOR backbone (blue) and the rapamycin ligand (red) over the course of a 1000-nanosecond molecular dynamics simulation. The mTOR protein reaches structural stability after approximately 150 ns, maintaining RMSD values around 0.75–0.85 nm for the remainder of the trajectory. The rapamycin ligand exhibits a more gradual stabilization, with a distinct conformational transition occurring around 350 ns, after which its RMSD plateaus near 0.40 nm.
Figure 4
Figure 4
RMSD plot of the mTOR protein (blue) and mol10 ligand (red) over a 1000 ns molecular dynamics simulation. The ligand exhibits a consistently low and stable RMSD around 0.2 nm, suggesting a strong and persistent interaction with the binding site. In contrast, the mTOR protein undergoes a gradual increase in RMSD, stabilizing around 0.5 nm, indicative of conformational flexibility upon ligand binding.
Figure 5
Figure 5
RMSD plot of the mTOR protein (blue) and mol11 ligand (red) over a 1000 ns molecular dynamics simulation. While the mTOR protein reaches stability after approximately 200 ns with an RMSD around 0.48 nm, the mol11 ligand exhibits high variability throughout the simulation, indicating an unstable binding mode and possible repositioning within the binding pocket.
Figure 6
Figure 6
RMSD plot of the mTOR protein (blue) and mol12 ligand (red) over a 1000 ns molecular dynamics simulation. The mTOR protein exhibits stable behavior after approximately 130 ns with RMSD values around 0.6 nm. The mol12 ligand displays notable variability, especially around 600 ns, suggesting a potential conformational rearrangement or repositioning within the binding pocket.
Figure 7
Figure 7
RMSD plot of the mTOR protein (blue) and mol13 ligand (red) over a 1000 ns molecular dynamics simulation. The mTOR protein shows consistent structural stability after the initial equilibration phase. The mol13 ligand exhibits marked variability throughout the final part of the simulation, with multiple rapid changes in RMSD values, indicating significant conformational rearrangements.
Figure 8
Figure 8
RMSD plot of the mTOR protein (blue) and mol14 ligand (red) over a 1000 ns molecular dynamics simulation. The mTOR protein rapidly equilibrates and maintains a stable RMSD around 0.45 nm after the initial 50 ns. The mol14 ligand exhibits initial mobility with moderate variability for the first 400 ns, after which it reaches a plateau at approximately 0.48 nm, suggesting a relatively stable binding mode characterized by some internal flexibility or minor rearrangements.
Figure 9
Figure 9
Root mean square fluctuation (RMSF) analysis of mTOR in complex with everolimus (blue) and rapamycin (black) during molecular dynamics simulations (left), and spatial mapping of the most mobile regions onto the 3D protein structure (right). The red dashed line at 0.5 nm represents the threshold above which residues are considered highly mobile. Seven distinct regions (R1–R7) exceeding this threshold are highlighted in yellow on the plot and mapped in red on the protein structure. The positions of everolimus and rapamycin are shown as magenta stick models, respectively, providing spatial context with respect to the flexible segments of the protein.
Figure 10
Figure 10
Root mean square fluctuation (RMSF) analysis of mTOR in complex with the small molecules mol10 to mol14 (left), and corresponding mapping of the most mobile protein segments onto the 3D structure (right). Colored lines represent the RMSF profiles for each complex, with a red dashed line indicating the 0.5 nm threshold for enhanced flexibility. Eight regions (R1–R8) exceeding this threshold are shaded in yellow on the plot and shown in red on the protein structure. The bound ligands are visualized as stick models in green, illustrating their spatial relationship to the fluctuating regions.
Figure 11
Figure 11
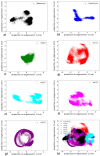
Comparative principal component analysis (PCA) of ligand conformational dynamics in complex with mTOR. Each panel shows the projection of ligand heavy-atom trajectories onto PC1–PC2 from 1000 ns MD; PCs were computed separately for each complex and the apo protein is not included: (a) Rapamycin—compact core with limited dispersion; (b) Everolimus—compact sampling with three small clusters; (c) mol10—narrow/compact sampling; (d) mol11—widest dispersion (high variability); (e) mol12—two moderately compact clusters; (f) mol13—fragmented, widespread sampling; (g) mol14—most compact, ring-like envelope; (h) Overlay of panels (ag) to qualitatively compare compactness/dispersion across ligands (cross-color overlap reflects similar ligand conformational envelopes, not shared protein motions).
Figure 12
Figure 12
Key interactions between two ligands, mol10 (left ligand rendered in light blue) and mol14 (right ligand rendered in magenta), within the mTOR protein binding site. The surrounding protein residues involved in these interactions are shown in green sticks. Principal interactions are depicted, with hydrophobic interactions represented by dashed gray lines and hydrogen bonds by continuous blue lines, illustrating the nature of the binding pocket.
Figure 13
Figure 13
Schematic of the study workflow. We used the structure of mTOR (PDB IDs: 4JSX), with Robetta-based homology modeling. The structure was relaxed in GROMACS. Docking was performed with lignin-derived ligands and natural inhibitors rapamycin and everolimus. Complexes underwent 1000 ns GROMACS MD simulations. Analyses included ligand–receptor interactions, PCA, and MM/PBSA.

References

    1. Ballou L.M., Lin R.Z. Rapamycin and mTOR kinase inhibitors. J. Chem. Biol. 2008;1:27–36. doi: 10.1007/s12154-008-0003-5. - DOI - PMC - PubMed
    1. Glaviano A., Foo A.S.C., Lam H.Y., Yap K.C.H., Jacot W., Jones R.H., Eng H., Nair M.G., Makvandi P., Geoerger B., et al. PI3K/AKT/mTOR signaling transduction pathway and targeted therapies in cancer. Mol. Cancer. 2023;22:138. doi: 10.1186/s12943-023-01827-6. - DOI - PMC - PubMed
    1. Martini M., De Santis M.C., Braccini L., Gulluni F., Hirsch E. PI3K/AKT signaling pathway and cancer: An updated review. Ann. Med. 2014;46:372–383. doi: 10.3109/07853890.2014.912836. - DOI - PubMed
    1. Panwar V., Singh A., Bhatt M., Tonk R.K., Azizov S., Raza A.S., Sengupta S., Kumar D., Garg M. Multifaceted role of mTOR (mammalian target of rapamycin) signaling pathway in human health and disease. Signal Transduct. Target. Ther. 2023;8:375. doi: 10.1038/s41392-023-01608-z. - DOI - PMC - PubMed
    1. Yang H., Rudge D.G., Koos J.D., Vaidialingam B., Yang H.J., Pavletich N.P. mTOR kinase structure, mechanism and regulation. Nature. 2013;497:217–223. doi: 10.1038/nature12122. - DOI - PMC - PubMed

LinkOut - more resources