. 2025 Sep 12:S0969-2126(25)00321-1.
doi: 10.1016/j.str.2025.08.017. Online ahead of print.

Initial leads to combat streptogramin resistance generated from X-ray fragment screening against VatD

Affiliations

Initial leads to combat streptogramin resistance generated from X-ray fragment screening against VatD

Pooja Asthana et al. Structure. .

Abstract

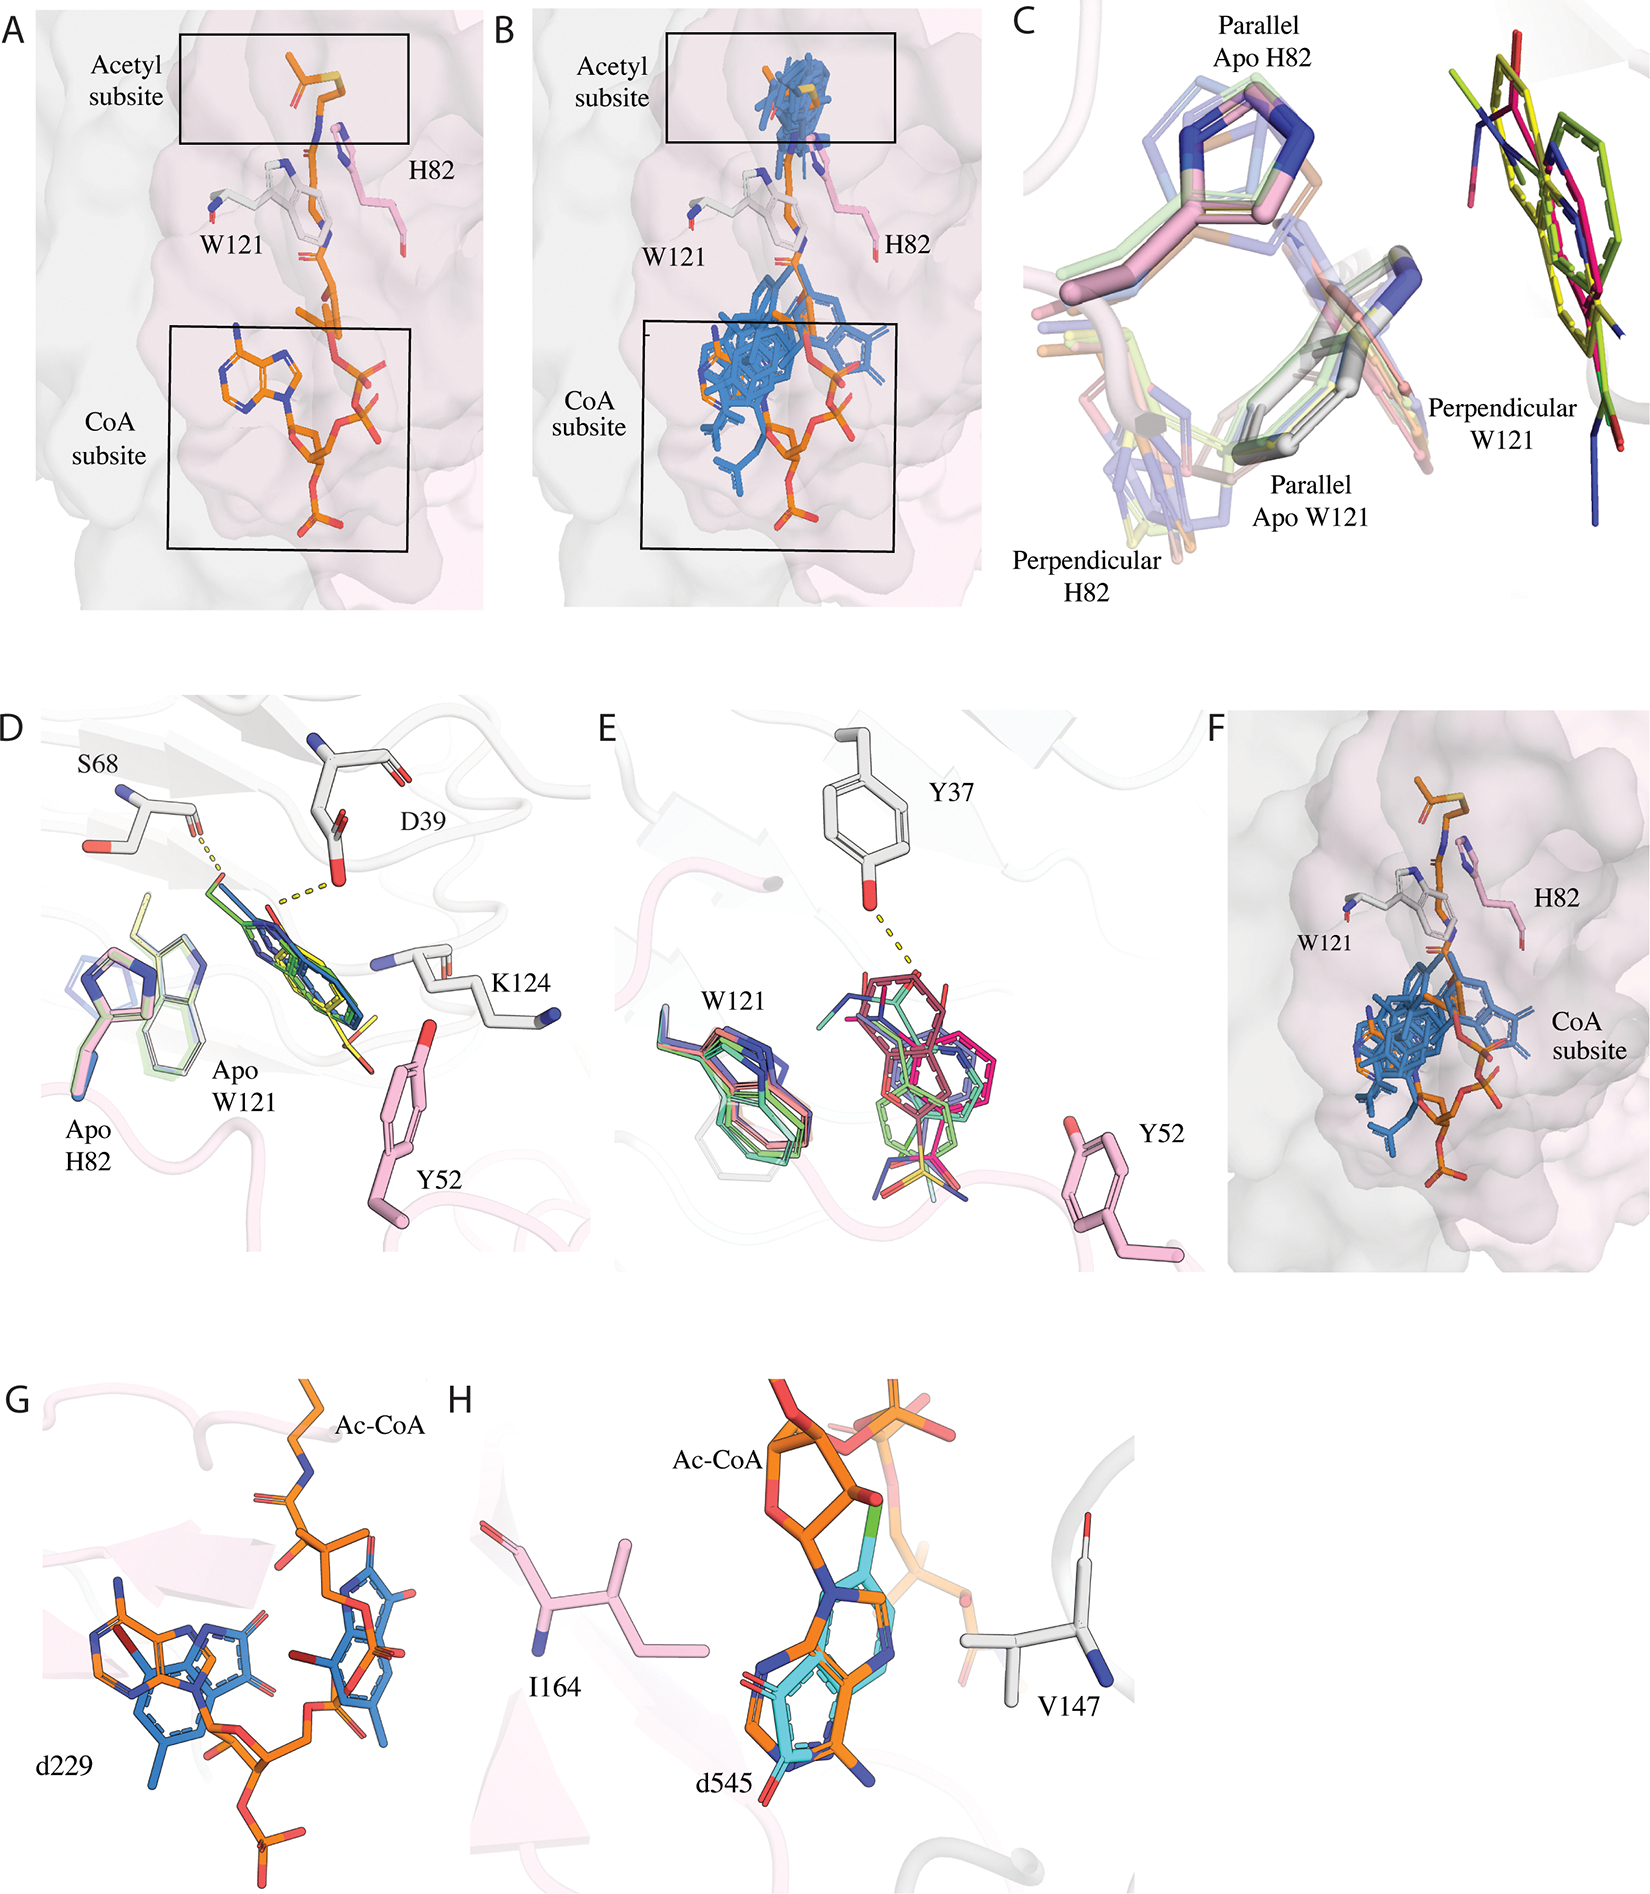
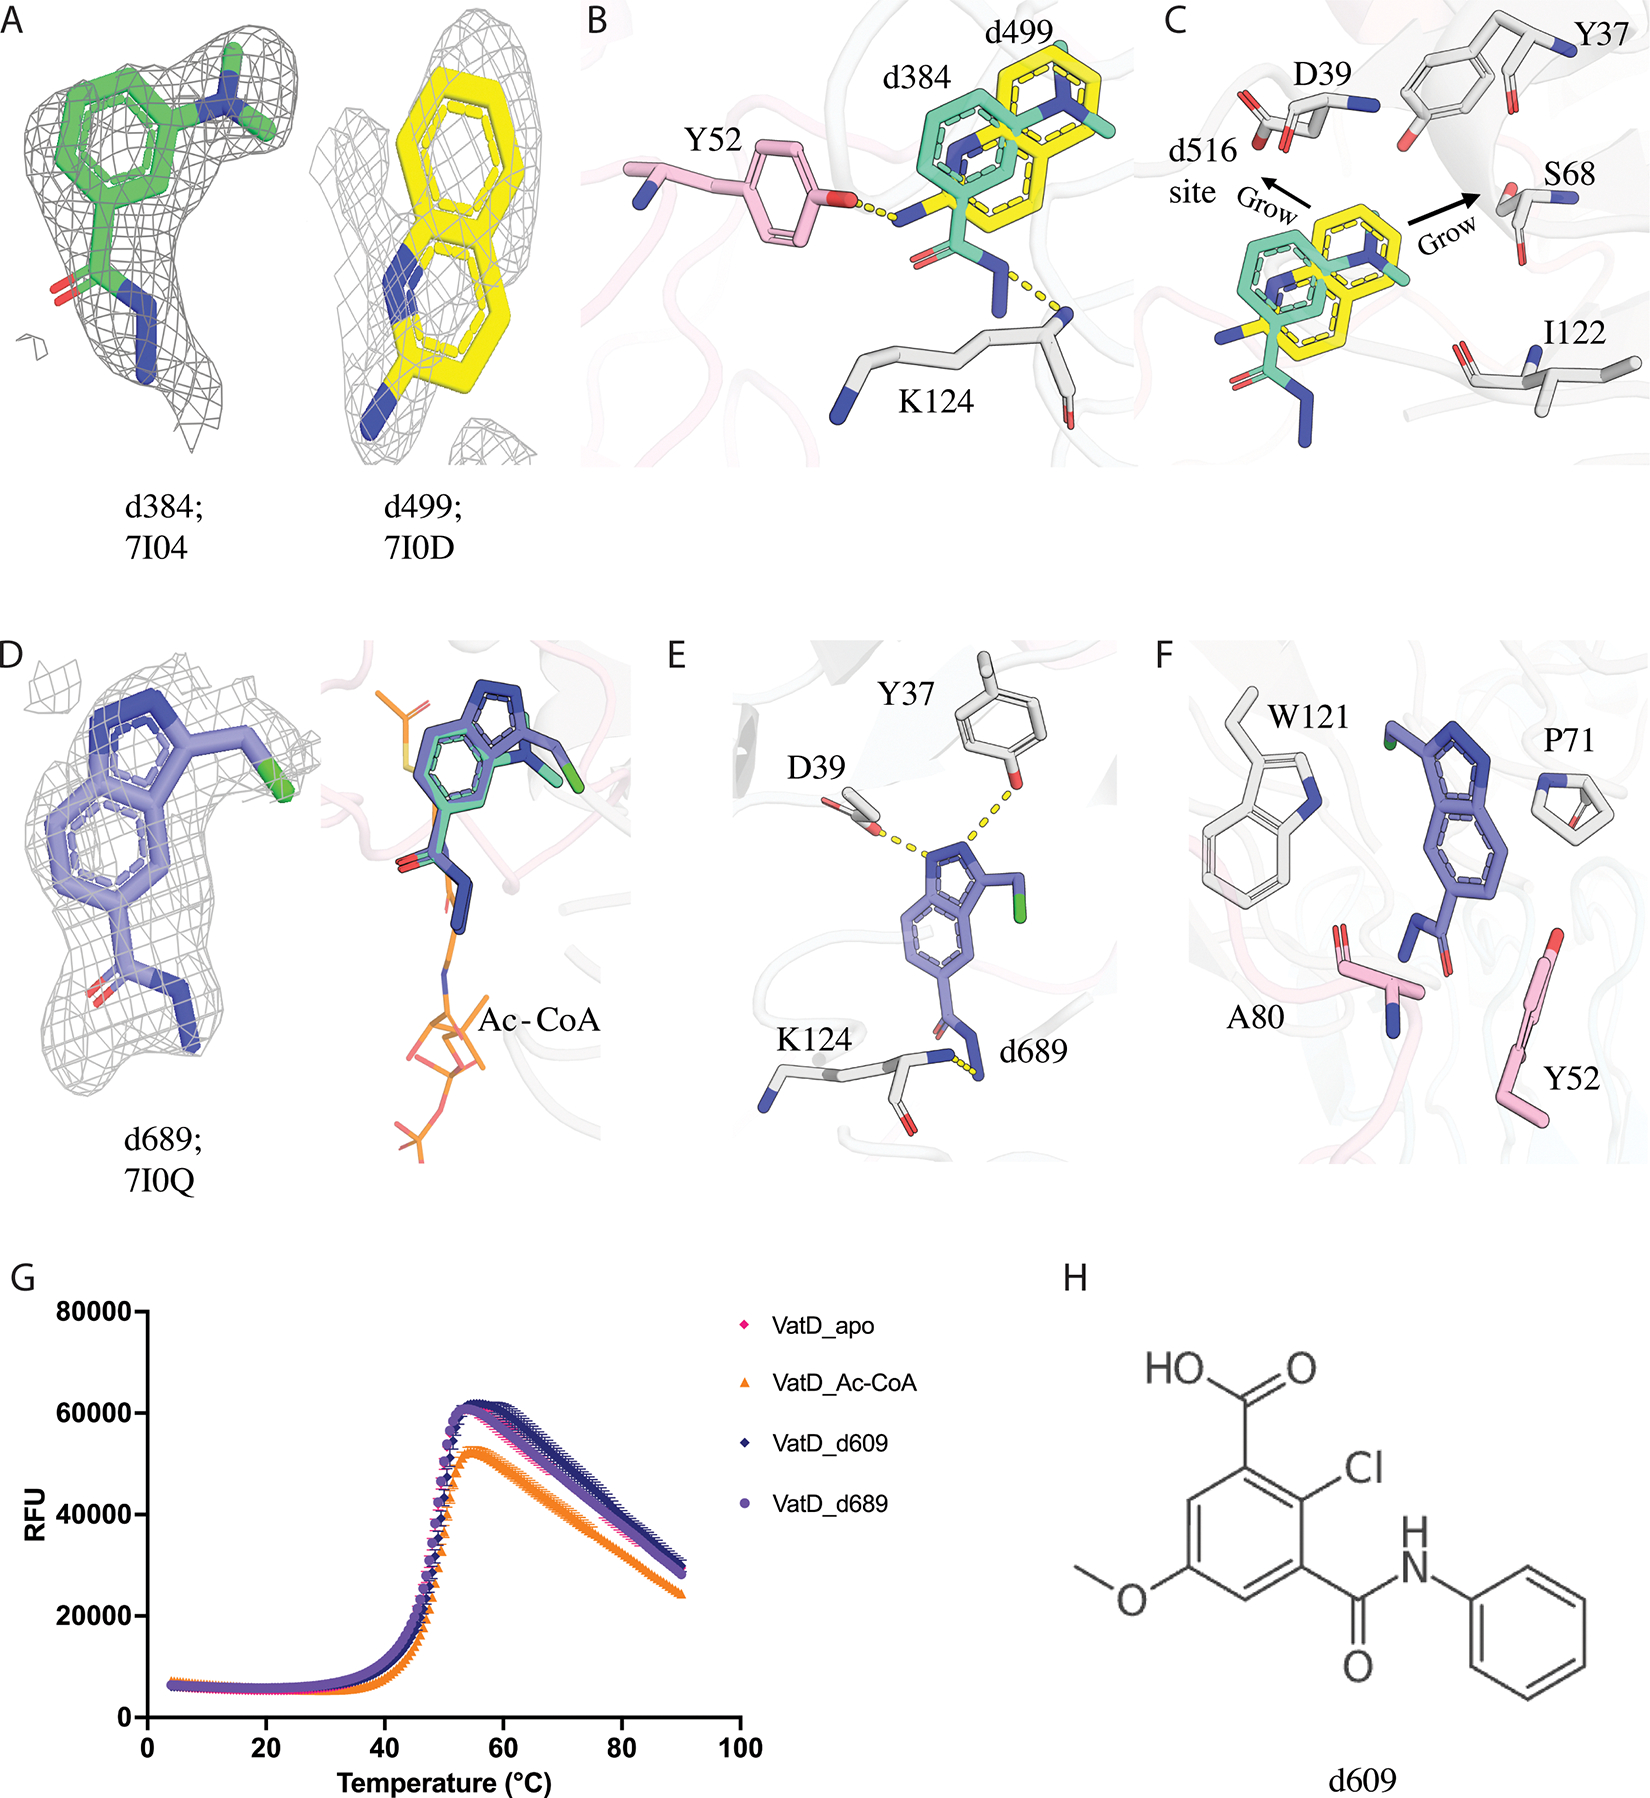
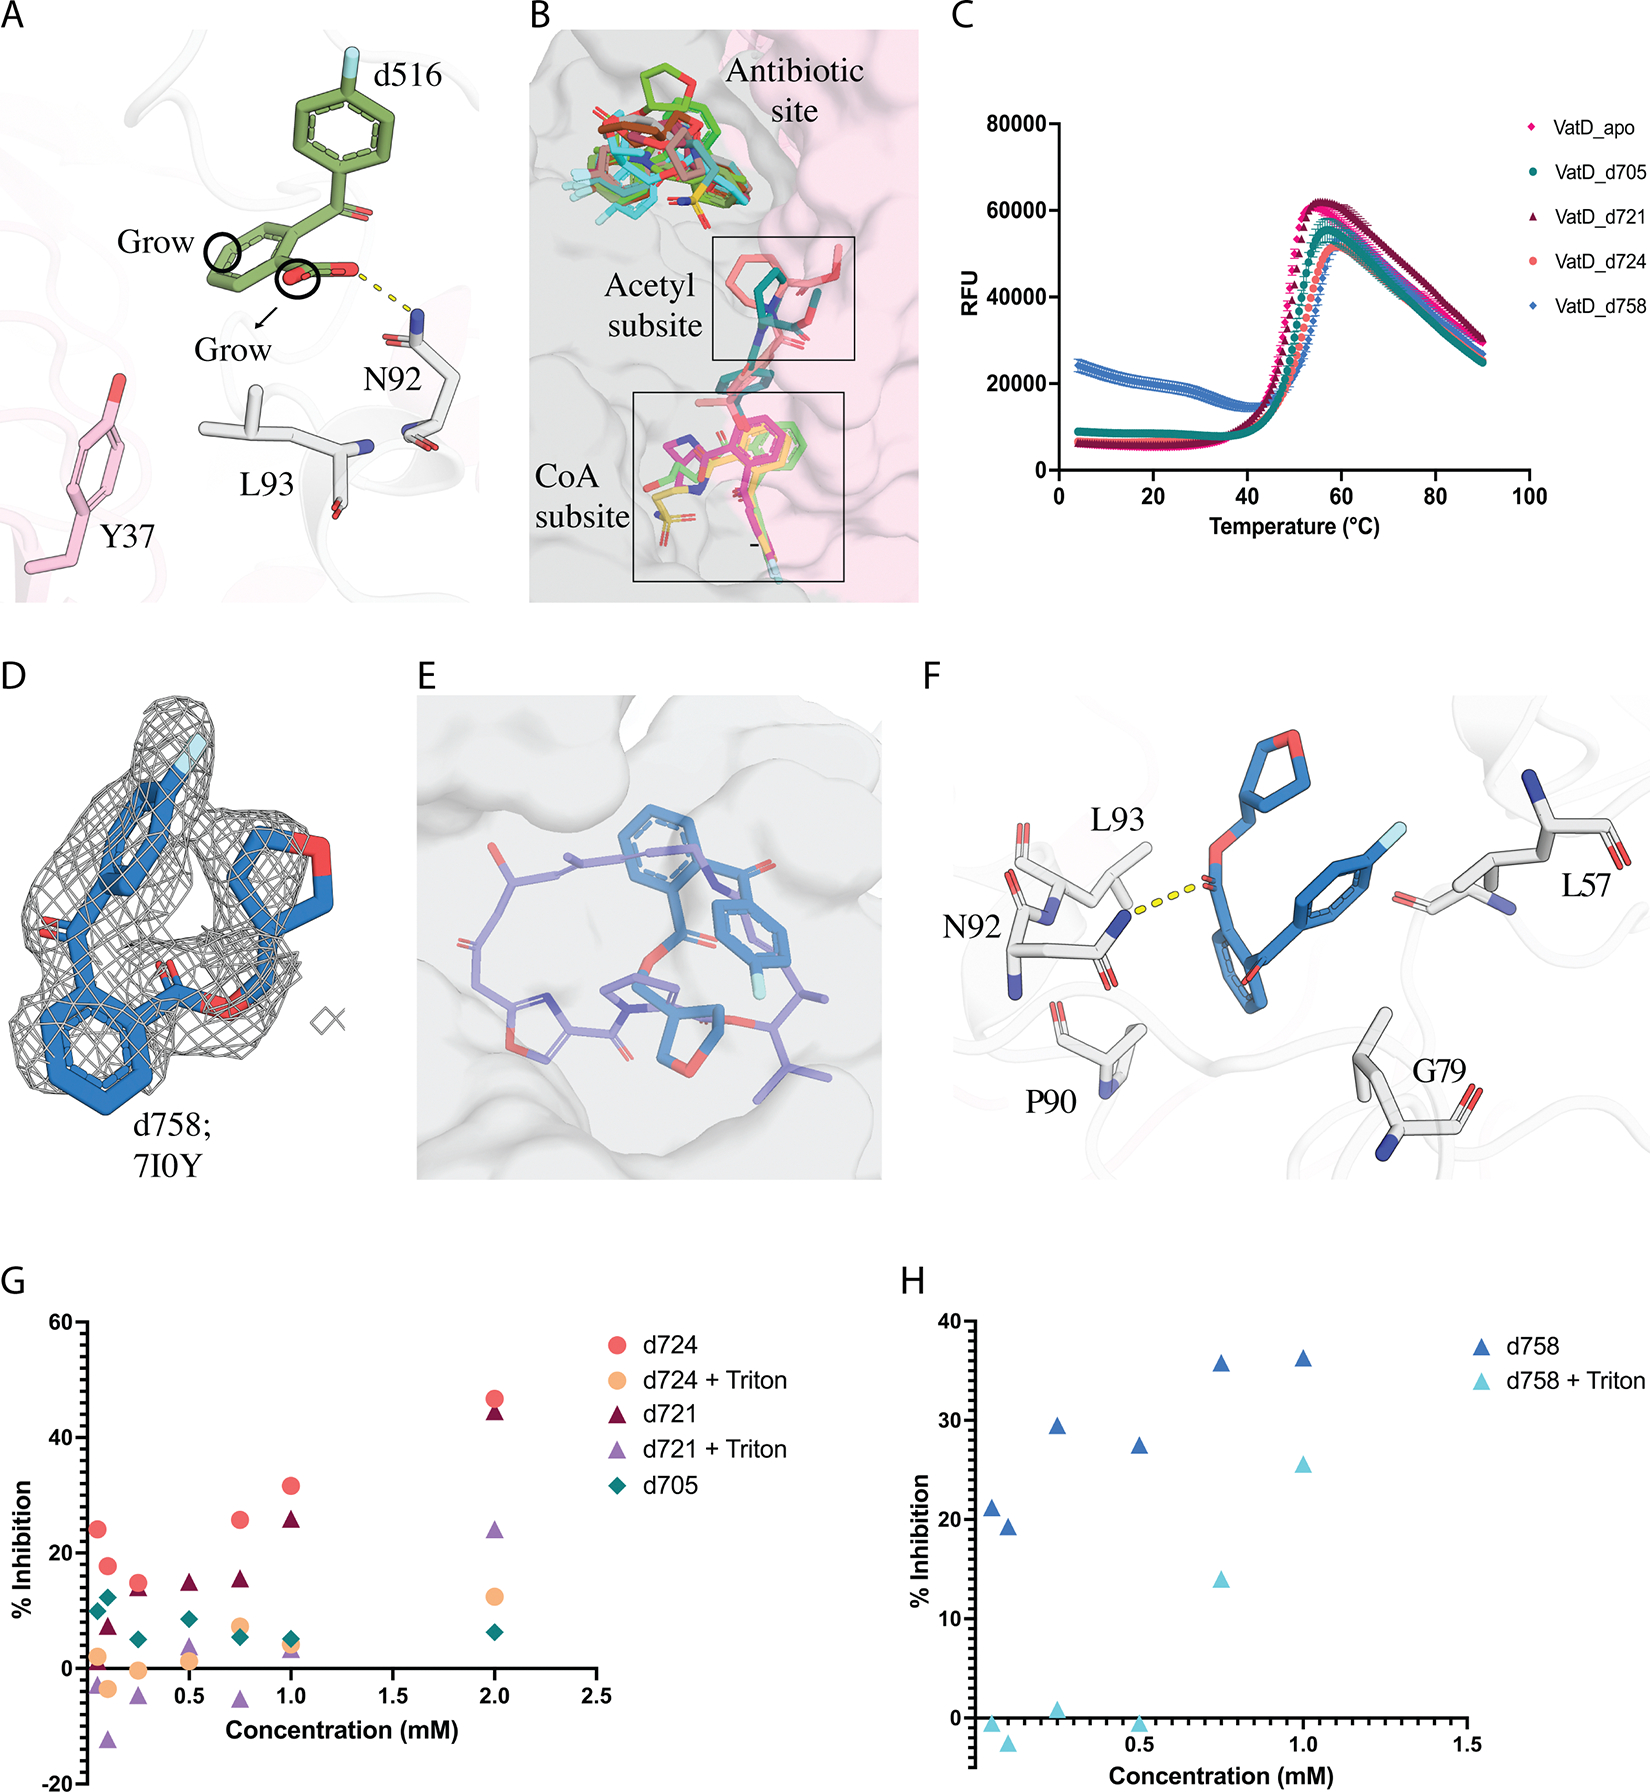
Streptogramins are potent antibiotics targeting bacterial ribosome. The synergistic binding of group A and B streptogramins to 50S-ribosome yields bactericidal effects. However, their efficacy is compromised by resistance mechanisms, including enzymatic acetylation of group A streptogramins by virginiamycin acetyltransferase (Vat) enzymes, which reduces their affinity for ribosomes. Using fragment-based drug discovery we identified starting points for development of VatD inhibitors. X-ray crystallography screening revealed three primary fragment-binding sites on VatD. In the acetyl-binding subsite, fragments stabilized distinct conformational states in critical residues, His82 and Trp121. In the antibiotic-binding site, two fragments formed interactions that could be leveraged for competitive inhibition. Elaborations of these fragments showed weak inhibition of VatD activity, indicating potential for further optimization. These findings establish initial hits that could restore streptogramin efficacy by targeting VatD directly, providing a structural foundation for inhibitor development against resistant bacterial strains.

Keywords: X-ray crystallography; acetyltransferase; antibiotic resistance; drug design; fragment based drug discovery.


Conflict of interest statement

Declaration of interests J.S.F. is a consultant to, shareholder of, and receives sponsored research support from Relay Therapeutics.

Figures

Figure 1:
Figure 1:. Structural basis of VatD mediated Streptogramin A resistance and fragment binding diversity across VatD by crystallography
A) Schematic representation of VatD inhibiting binding of streptogramin antibiotic class A, virginiamycin M1 to the bacterial (E. coli) 50S ribosomal subunit (PDB: 4U25). The left panel shows the overview of VatD binding to VM1 (purple), and Ac-CoA (orange) (PDB: 1KK4). VatD is shown in cartoon representation with three chains in grey, pink, and blue. The middle panel shows the key residues of VatD involved in the electron transfer and highlights the OH group of VM-1 which gets acetylated in the red sphere. The right panel shows the binding of VM-1 to the 50S ribosome highlighting the interactions of phosphate oxygen of G2505 nucleotide with OH group of VM-1 (cartoon representation in grey). B) Unaligned crystal structures of VatD complexed with all the fragment hits. C) Crystal structures of VatD complexed with fragments aligned to VatD-apo as the reference. The fragments are colored by their presence in the Antibiotic binding site (pink), Ac-CoA site (blue), and non-active sites (yellow). D) Histogram showing the resolution range of VatD crystal soaked with 10% DMSO (grey) and 10% fragments (blue) for 4 hours. The X-axis represents the resolution range, Y-axis represents the percentage of frequency. E) Gallery of density for the non-active/surface site fragments: d167 (7HZW), d429 (7I08), d440 (7I0B), d537 (7I0I), d538 (7I0J). The PanDDA event map density shown is at sigma 1.0 contour within a 1.6 Å radius around the fragments.
Figure 2:
Figure 2:. Conformational changes in VatD upon fragment binding in Ac-CoA site
A) The subdivision of Acetyl-CoA site formed by the two chains of VatD trimer showing the two main subsites: Acetyl and CoA subsite. The two chains of apo VatD are shown in surface representation (grey, pink). H82 and Y121 residues emerging from distinct chains of the apo protein are shown in sticks. The Ac-CoA is shown in sticks in orange. B) The binding of fragments (blue) in the acetyl and CoA subsite. C) Fragments showing the perpendicular and parallel conformations of H82 and W121 relative to fragments. The apo/parallel conformation is highlighted while the perpendicular conformation is shown with less transparency. Fragments d193 (PDB: 7HZX), d232 (PDB: 7HZZ), and d287 (PDB: 7I01) are shown as sticks. D) Hydrophobic and hydrophilic interactions of fragments stabilizing the parallel conformation. E) Hydrophobic and hydrophilic interactions of fragments stabilizing the perpendicular conformation. The H-bonds are represented by dashed lines. F) Fragments bound in the CoA subsite shown in stick representation in blue. G) Fragment d229 (PDB: 7HZY) in blue present in two copies in the CoA subsite, one copy overlapping at the adenosine moiety and the other copy at the pantothenic arm of Ac-CoA.H) Fragment d545 (PDB: 7I0K) in cyan showing a complete overlap with the adenosine. d545 (PDB: 7I0K) makes hydrophobic interactions with V146 and I164.
Figure 3:
Figure 3:. Binding interactions of fragments in the antibiotic binding site
A) The PanDDA event density map of fragments d516 (green, PDB: 7I0F) and d521 (brown, PDB: 7I0H) identified by PanDDA at sigma 1.0 contour within a 1.6 Å radius around the fragments. B) Superposition of VatD complexed with d516 (green), d521 (brown), and VM-1 (purple, PDB: 1KHR) to the apo-VatD showing the binding site of fragments and SA. Apo-L93 is shown in sticks. C) D) E) The schematic diagram depicting the hydrophilic and hydrophobic interactions at the active site of VatD-d516 (green), VatD-d521 (brown), and VatD-VM-1 (purple) complexes. The hydrogen bonds are represented as dashed lines. Shared residues highlighted are in grey. Hydrophobic interaction with L93 is seen in all except for d521 (highlighted in red). F) The conformation flip of L93 side chain in d521 bound structure when compared to the apo-VatD (pink), VM-1-VatD (light purple, PDB: 1KHR), dalfopristin-VatD (dark purple, PBD: 1MRL).
Figure 4:
Figure 4:. Structural elaboration of Acetyl binding subsite fragments d384 and d499 in VatD
A) The PanDDA event density map for fragment d384 (green, PDB: 7I04) and d499 (yellow, PDB: 7I0D) identified by PanDDA is at sigma 1.0 contour. B) The binding site of fragment d384 (green) and d499 (yellow) at the dimeric interface of VatD showing the H-bond between d384-K124, and d499-Y52. The residues coming from two different chains of VatD are shown in grey and pink color. C) The design principle of d384 and d499, extensions towards the d516/antibiotic binding site. D) The PanDDA event density map for fragment d689 at sigma 1.0 contour (purple, PDB: 7I0Q). The binding of d689 in VatD showing the overlap with parent fragment and acetyl subsite (orange sticks). E) F) d689 showing new additional contacts formed with VatD residues. The H-bond is shown as dashed lines. G) The DSF curve showing the Tm for VatD bound to d609 (blue), d689 (purple), Ac-CoA (orange), Apo (pink). Ac-CoA is a positive control showing a change in Tm, however d689 does not show any Tm shift wrt to the Apo. The data points are shown with error bars. H) The chemical structure of d609 which showed a Tm shift in DSF, but not found in PanDDA analysis.
Figure 5:
Figure 5:. Rational design and structural characterization of d521 analogs
A) The design principle for elaboration of d521(brown, PDB:7I0H). The residues coming from two different chains of VatD are shown in grey and pink. B) PanDDA event density map of d677 in green contoured at sigma 1.0 (PDB: 7I0P). C) The presence of d677 at the acetyl subsite of Ac-CoA (PDB: 1KK4) in VatD. The Ac-CoA is shown in sticks in orange. The parent compound d521, binding in the antibiotic site is also shown in sticks in brown. D) The hydrophobic interactions made by d677 with the VatD residues.
Figure 6:
Figure 6:. Structural and functional characterization of d516 analogs
A) d516 (PDB: 7I0F) design principles for elaboration B) Distribution of 14 hits obtained from the analogs of d516 bound at 3 sites in VatD. C) The DSF curve showing the change in Tm for VatD bound to d705 (green, PDB: 7I0T), d721 (maroon red), d724 (orange, PDB: 7I0W), d758 (blue, PDB: 7I0Y), and apo (pink). D) d758 PanDDA event density map at sigma 1.0 contour. E) Overlap of d758 (blue, PDB: 7I0Y) with VM-1 (purple, PDB: 1KHR) in sticks, and the VatD is shown in surface representation. F) d758 interactions with VatD residues G) The % inhibition graph of d705 (green), d721 (maroon red, purple), and d724 (orange, yellow) in absence and presence of 0.01% Triton-X in the assay. The concentration of the compounds range from 0.05 mM to 2 mM in the assay. H) The % inhibition graph of d758 in presence (blue) and absence (cyan blue) of 0.01% Triton-X in the assay. The concentration of the d754 ranges from 0.05 mM to 1 mM in the assay.
Figure 7:
Figure 7:. Structural and functional characterization of d758 analogs
A) Chemical structure of d758 (PDB: 7I0Y) analogs. B) d797 (green, PDB: 7I11) and d798 (brown, PDB: 7I12) PanDDA event density map at sigma 1.0 contour. While the density has some ambiguity in placement, the signal is unique to this dataset and was sufficient to allow modeling the ligand in this pose. C) DSF curve of d797 (green), d798 (brown), and d800 (light green) with VatD-apo (pink) and positive control VatD-VM-2 (purple, PDB: 1KHR). D) Overlap of d797 (green), d798 (brown) on the parent compound d758 (blue). E) d797 hydrophobic interaction with VatD residues. The binding region is shown in surface representation, with the key residues shown in sticks. d797 revealed two new hydrophobic interactions with P103, and P109 residues of VatD. G) The % inhibition graph of d797 in presence (light green) and absence (dark green) of 0.01% Triton-X in the assay. The concentration of d797 ranges from 0.05 mM to 2 mM, in the assay. The x-axis represents the mM concentration of compounds, and the y-axis represents the % inhibition.

References

    1. Huemer M, Mairpady Shambat S, Brugger SD, and Zinkernagel AS (2020). Antibiotic resistance and persistence-Implications for human health and treatment perspectives. EMBO Rep. 21, e51034. - PMC - PubMed
    1. Leclercq R, and Courvalin P (1998). Streptogramins: an answer to antibiotic resistance in gram-positive bacteria. Lancet 352, 591–592. - PubMed
    1. Hershberger E, Donabedian S, Konstantinou K, and Zervos MJ (2004). Quinupristin-dalfopristin resistance in gram-positive bacteria: mechanism of resistance and epidemiology. Clin Infect Dis 38, 92–98. - PubMed
    1. Wilson DN (2009). The A-Z of bacterial translation inhibitors. Crit Rev Biochem Mol Biol 44, 393–433. - PubMed
    1. Noeske J, Huang J, Olivier NB, Giacobbe RA, Zambrowski M, and Cate JHD (2014). Synergy of streptogramin antibiotics occurs independently of their effects on translation. Antimicrob Agents Chemother 58, 5269–5279. - PMC - PubMed

LinkOut - more resources