. 2025 Dec;17(1):2557981.
doi: 10.1080/19490976.2025.2557981. Epub 2025 Sep 15.

Seeding and feeding: nutrition and birth-associated exposures shape gut microbiome assembly in breastfed infants

Affiliations

Seeding and feeding: nutrition and birth-associated exposures shape gut microbiome assembly in breastfed infants

Lisa F Stinson et al. Gut Microbes. 2025 Dec.

Abstract

Gut microbiome establishment in early life is influenced by maternal, infant, and environmental factors, with disruptions linked to later disease risk. Although infant diet is a major determinant of microbial composition, longitudinal data in breastfed infants, particularly in the context of birth interventions, remain limited. We profiled 698 stool samples from 84 predominantly or exclusively breastfed infants in the BLOSOM cohort, spanning 10 time points from 1 week to 2 years of age using full-length 16S rRNA gene sequencing and targeted qPCR. After an initial volatile period, microbiome composition and diversity stabilized between months 2 and 5. Introduction of solid foods then triggered a marked ecological shift, with significant increases in diversity (p < 1 × 10-11) and broad compositional restructuring. In contrast, weaning had minimal impact on overall microbiota structure but was associated with lower abundances of several Bifidobacterium species, highlighting the sustained bifidogenic effect of human milk. Cesarean delivery was associated with transient reductions in Bacteroides abundance and prevalence, but did not affect Bifidobacterium, likely due to the bifidogenic effects of human milk. Reductions in Bacteroides, however, were not reflected in quantitative analyses, emphasizing the importance of absolute abundance measures. Our results offer novel insight into gut microbiome development under optimal feeding conditions, suggesting that breastfeeding may buffer early-life microbiome perturbations, while diet transitions exert major and lasting effects.

Keywords: Infant gut microbiome; breastfeeding; delivery mode; infant nutrition; intrapartum antibiotics.


Conflict of interest statement

LFS and DTG receive funding from Medela AG, administered through The University of Western Australia. This funding body had no input into study design, interpretation of results, or decision to publish.

Figures

Figure 1.
Figure 1.
Sample coverage and infant diet across each of the ten sampling time points. Individual subjects are displayed on the y axis, and time is displayed on the x axis. Samples are coloured based on infant diet at each sampling time point.
Figure 2.
Figure 2.
Composition and variation in the infant gut microbiota across the first two years of life. A. Mean relative abundance of top OTUs (>0.5% relative abundance) over time. B. Interindividual variation in infant gut microbiota at the genus level. Vertical bars represent individual infants. Genera which make up <2% relative abundance are grouped together as “others.” C. OTU-level richness over time. D. Shannon diversity over time.
Figure 3.
Figure 3.
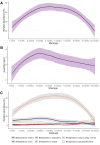
Bifidobacterium dynamics in the first two years of life. A. Relative abundance of Bifidobacterium (as measured by 16S rRNA gene sequencing. B. Absolute abundance of Bifidobacterium (ng/µL, as measured by qPCR). C. Relative abundance of the top Bifidobacterium species (those that made up >0.5% mean relative abundance). Loess lines were fitted for the data points with shaded areas representing the 95% confidence intervals.
Figure 4.
Figure 4.
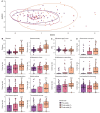
Temporal dynamics of the infant gut microbiome over the first two years of life. A. NMDS plot based on Aitchison distances, coloured by sampling time point, illustrating microbiota progression over time. B. Volatility of the gut microbiome, shown as Aitchison distances between subsequent time points. Each boxplot reflects inter-individual dissimilarity between two adjacent sample collection time points (e.g., 1 week vs. 1 month). C. Longitudinal trajectories of 18 OTUs that varied significantly over time (linear mixed-effects models; reference = 1 month). Each panel displays CLR-transformed abundance with Loess-smoothed lines and shaded 95% confidence intervals.
Figure 5.
Figure 5.
Effect of delivery mode and intrapartum antibiotic exposure on infant gut microbiota composition over time. PERMANOVA R2 values representing the proportion of variance in gut microbiota composition explained by delivery mode (vaginal [V] vs. caesarean section [CS]; vaginal with intrapartum antibiotics [VIAP] vs. V; and VIAP vs. CS) at each time point from 1 week to 24 months.
Figure 6.
Figure 6.
OTU-level aberrations to the infant gut microbiota following caesarean delivery or intrapartum antibiotic prophylaxis (IAP). Loess lines were fitted for the data points with shaded areas representing the 95% confidence intervals.
Figure 7.
Figure 7.
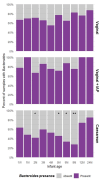
Reduced prevalence of Bacteroides among infants delivered by Caesarean section.
Figure 8.
Figure 8.
Impact of delivery exposures on infant gut Bifidobacterium and Bacteroides levels, visualised for relative abundance and quantitative measures. Loess lines were fitted for the data points with shaded areas representing the 95% confidence intervals.
Figure 9.
Figure 9.
Introduction of solid foods drives significant shifts in infant gut microbiota composition and diversity. A. NMDS plot based on Aitchison distances, showing distinct community structure following the introduction of solids. B. Alpha diversity metrics (richness and Shannon diversity) significantly increase in post-solids 2 samples, indicating greater microbiota complexity. C. Microbiome-for-age Z (MAZ) scores decline after solid food introduction, consistent with accelerated maturation. D. CLR-transformed abundances of OTUs significantly altered in post-solids 2 samples. Pre-solids: the sample collected prior to the introduction of solids. Post-solids 1: the sample collected immediately after solids introduced. Post-solids 2: the subsequent time point after solids commenced.
Figure 10.
Figure 10.
Elevated Bifidobacterium species among 24-month-old infants who had continued breastfeeding (purple) compared to those who had weaned (pink).

References

    1. Jian C, Carpen N, Helve O, de Vos WM, Korpela K, Salonen A.. Early-life gut microbiota and its connection to metabolic health in children: perspective on ecological drivers and need for quantitative approach. EBioMedicine. 2021;69:103475. doi: 10.1016/j.ebiom.2021.103475. - DOI - PMC - PubMed
    1. Cox LM, Yamanishi S, Sohn J, Alekseyenko AV, Leung JM, Cho I, Kim S, Li H, Gao Z, Mahana D, et al. Altering the intestinal microbiota during a critical developmental window has lasting metabolic consequences. Cell. 2014;158(4):705–21. doi: 10.1016/j.cell.2014.05.052. - DOI - PMC - PubMed
    1. Tanaka M, Nakayama J. Development of the gut microbiota in infancy and its impact on health in later life. Allergol Int. 2017;66(4):515–522. doi: 10.1016/j.alit.2017.07.010. - DOI - PubMed
    1. Stanislawski MA, Dabelea D, Wagner BD, Iszatt N, Dahl C, Sontag MK, Knight R, Lozupone CA, Eggesbø M. Gut microbiota in the first 2 years of life and the association with body mass index at age 12 in a Norwegian birth cohort. mBio. 2018;9(5). doi: 10.1128/mBio.01751-18. - DOI - PMC - PubMed
    1. Knip M, Siljander H. The role of the intestinal microbiota in type 1 diabetes mellitus. Nat Rev Endocrinol. 2016;12(3):154–167. doi: 10.1038/nrendo.2015.218. - DOI - PubMed

Substances