[Preprint]. 2025 Sep 7:2025.08.31.673354.
doi: 10.1101/2025.08.31.673354.

Translational reading frame determines the pathogenicity of C-terminal frameshift deletions in MeCP2: an alternative therapeutic approach

Affiliations

Translational reading frame determines the pathogenicity of C-terminal frameshift deletions in MeCP2: an alternative therapeutic approach

Jacky Guy et al. bioRxiv. .

Abstract

Mutations in the MECP2 gene cause the severe neurological disorder Rett syndrome. A cluster of frameshift-causing C-terminal deletions (CTDs) lead to loss of ~100 amino acids at the C-terminus of the MeCP2 protein, and account for approximately 10% of RTT-causing mutations. The pathogenicity of C-terminal deletions (CTDs) is unexpected, as this C-terminal domain is non-essential in mice. Utilising databases of pathogenic and benign human MECP2 mutations, we find that some individuals with apparently typical CTDs do not exhibit Rett syndrome, confirming that C-terminal truncations are not intrinsically pathogenic. Using human DNA sequence data and mouse models, we demonstrate that pathogenicity results from a drastic reduction in MeCP2 levels and is determined by the presence of the short amino acid motif proline-proline-stop (-PPX) at the C-terminus, which results from a shift to the +2 reading frame. Individuals with CTDs that shift to the +1 frame avoid this motif and do not develop Rett syndrome. Mutating the stop codon of the PPX motif to tryptophan rescues MeCP2 expression and RTT-like phenotypes in a CTD mouse model. Finally, we demonstrate that an adenine base editor can efficiently introduce this tryptophan substitution in cultured cells. Overall, our findings uncover a simple and reliable prognostic distinction between benign and pathogenic CTDs and provide proof-of-concept for an editing strategy that potentially corrects all disease-causing CTD mutations.


Conflict of interest statement

Competing Interests Statement B.P.K. is an inventor on patents or patent applications filed by Mass General Brigham that describe genome engineering technologies, including the SpG and SpRY enzymes. B.P.K. has consulted for EcoR1 capital, Novartis Venture Fund, Foresite Labs, and Jumble Therapeutics, and is on the scientific advisory boards of Acrigen Biosciences, Life Edit Therapeutics, and Prime Medicine. B.P.K. has a financial interest in Prime Medicine, Inc., a company developing therapeutic CRISPR-Cas technologies for gene editing. B.P.K.’s interests were reviewed and are managed by MGH and MGB in accordance with their conflict-of-interest policies.

Figures

Figure 1.
Figure 1.
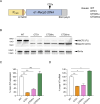
Frameshifting deletions in the C-terminal domain of MeCP2 cause Rett syndrome in humans and RTT-like phenotypes in mice. (A) A schematic representation of human MeCP2 protein showing hemizygous missense mutations found in GnomAD v4.1.0; de novo Classical RTT mutations found in RettBASE; Alpha Missense pathogenicity score; regions found in an MeCP2 “minigene” (ΔNIC) and domains described in the literature: methyl-binding domain (MBD), AT-hooks (AT-1 and AT-2), nuclear localization signal (NLS), NCoR interacting domain (NID) and the C-terminal deletion-prone region (CT-DPR). (B) Human DNA and amino acid sequence found in the CT-DPR, numbered according to transcript ENST00000303391.11, e2 isoform. The two most common RTT deletions are shown, referred to as CTD1 and 2 for brevity. Microhomologies believed to recombine to cause the deletions are marked on the DNA sequence as orange and green boxes respectively, and the deleted sequences as corresponding lines below. The C-terminal amino acid sequences of CTD1 and CTD2 are shown, with the points of frameshift marked with arrows. (C) Summary of CTD1 and CTD2 knock-in mouse models.
Figure 2.
Figure 2.
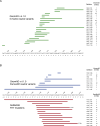
Genomic deletions in the CT-DPR of MECP2. (A) All hemizygous in-frame deletions in the region found in GnomAD v4.1.0 are indicated with green lines above the DNA sequence. The deletion co-ordinates (numbered according to ENST00000303391.11) and number of individuals with each deletion are shown alongside. (B) Frameshifting deletions in the CT-DPR. Above the genomic sequence, hemizygous deletions from GnomAD v4.1.0 are shown in blue. Deletions from RettBASE are shown below in red, with each deletion found in at least one individual with a de novo mutation and a diagnosis of classical RTT. Coordinates and number of individuals with each mutation are shown, with the two most common RTT mutations, CTD1 and CTD2 indicated.
Figure 2, Supplementary Figure 1
GnomAD v4.1.0 data from the CT-DPR (A) GnomAD missense mutations. A comparison of mouse and human amino acid sequence in the CT-DPR, followed by a plot of the number of individuals in GnomAD with missense mutations present (filled circles) or absent (open circles) at each position. All amino acid changes found are listed below, colour-coded according to frequency. Hemizygous, heterozygous and homozygous mutations are included. (B) Plot of the total number of GnomAD alleles with in-frame deletions at each amino acid position in the CT-DPR (hemizygous and heterozygous individuals). (C) Plot of the GnomAD missense allele count in the MBD for comparison with (A). Mutations present (filled diamonds), no GnomAD changes (empty diamonds).
Figure 2, Supplementary Figure 2
Summary of CTD C-terminal amino acid sequences and experimental MeCP2 protein levels for each.
Figure 3.
Figure 3.
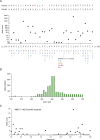
C-terminal amino acid sequences of pathogenic and benign MeCP2 CTDs. (A) The three possible reading frames after frame shifts in the CT-DPR. WT genomic sequence is shown, with all possible stop codons in red. The amino acid sequence of the WT reading frame (0) is shown in black, with +1 frame in blue and +2 in red. (B) C-terminal amino acid sequences of frameshifting deletions shown in Figure 2. Sequence after frame shift is shown in blue (+1 frame) or red (+2 frame). (C) Family pedigree showing three generations from a family with a c.1159_1210 del MECP2 mutation (black circles). (D) Genomic DNA sequence and amino acid sequence showing c.1159_1210 deletion site and molecular consequences.
Figure 3, Supplementary Figure 1
GnomAD v4.1.0 frameshifting deletion alleles. (A) Number of individuals with each type of frameshift and number of different CTD alleles. (B) GnomAD entries shown in (A) classified by C-terminal amino acid sequence for individuals and CTD alleles.
Figure 3, Supplementary Figure 2
CTD3 mouse knock-in allele. (A) Human genomic and amino acid sequence showing location of CTD3 deletion (1158_1167del). Mouse WT genomic and amino acid sequences. Differences to human sequence are shown in red. The protospacer sequence (blue) and PAM sequence (pink) used to cut the WT allele for CRISPR editing are shown, with the cut site marked with an arrow. The mouse CTD3 knock-in allele is shown with nucleotide additions and deletions to the WT allele shown in green. Changes made to the mouse sequence to reproduce the human missense tail are in blue and two silent changes which introduce a diagnostic SacII site are underlined. (B) Phenotypic scoring of hemizygous male mice with CTD1 (n=13) and CTD3 (n=15) knock-in alleles, and WT male littermates of CTD3 animals (n=11). Mean +/− sd. (C) Body weights of animals shown in (B). Mean +/− sd. (D) Western blot of whole brain protein from 6 week old male mice hemizygous for Mecp2-null, CTD1, CTD3 and WT alleles. Full-length (FL) and C-terminally deleted (CTD) MeCP2 proteins are indicated. Histone H3 is used as a loading control. (E) Quantification of (D). N=3 per genotype, mean +/− sd. Unpaired two-tailed t-test: CTD3 vs WT P=0.079 (ns), CTD1 vs WT P<0.0001 (****). (F) Quantification of Mecp2 primary transcript and mRNA in whole brain of 6 week old male mice as in (D). N=3 brains per genotype. Mean +/− sd. Unpaired two-tailed t-test: Primary transcript CTD3 vs WT littermates P=0.6687 (ns), CTD1 vs WT P=0.2585 (ns), mRNA CTD3 vs WT P=0.1055 (ns), CTD1 vs WT P=0.0008 (***).
Figure 4.
Figure 4.
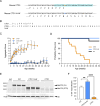
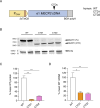
A CTD1 X>W knock-in mouse models adenine base editing of the CTD1 stop codon. (A) The genomic sequence of mouse CTD1 and CTD1 X>W alleles. The mutated adenine is shown in orange, and the sequence common to all mouse CTD alleles is shaded in turquoise. (B) The amino acid consequences of alleles in (A). (C) Phenotypic scoring of hemizygous male mice with CTD1 (n=13) and CTD1 X>W (n=9) knock-in alleles, and WT male littermates of CTD1 X>W animals (n=10). Mean +/− standard deviation (sd). (D) Kaplan-Meier plot of survival of animals shown in (C). (E) Western blot of whole brain protein from 6 week old male mice hemizygous for Mecp2-null, CTD1, CTD1 X>W and WT alleles. Full-length (FL) and C-terminally deleted (CTD) MeCP2 proteins are indicated. Histone H3 is used as a loading control. (F) Quantification of (E). N=3 per genotype, mean +/− sd. Unpaired two-tailed t-test: CTD1 X>W vs CTD1 P<0.0001 (****), CTD 1 X>W vs WT
Figure 4, Supplementary Figure 1
Structure of the mouse CTD1 X>W allele. (A) Human and mouse CT-DPR genomic and amino acid sequences. Differences between mouse and human sequence are shown in red. The protospacer sequence (blue) and PAM sequence (pink) used to cut the WT allele for CRISPR editing are shown, with the cut site marked with an arrow. (B) The mouse CTD1 knock-in allele compared to the CTD1 X>W allele. The single nucleotide A to G change is shown in red.
Figure 4, Supplementary Figure 2
CTD mouse alleles: mESC-derived neurons. (A) genomic and amino acid sequences of 3 CTD1 mouse knock-in alleles and western blot of MeCP2 protein from mESC-derived neurons 7 days after plating neuronal progenitors. Two independent clones per genotype, histone H3 loading control, NeuN control for differentiation status. (B) genomic and amino acid sequences of 3 CTD2 mouse knock-in alleles and western blot of MeCP2 protein from mESC-derived neurons 7 days after plating neuronal progenitors.
Figure 4, Supplementary Figure 3
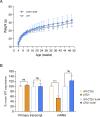
CTD1 X>W knock-in mice: weights and brain RNA levels. (A) Body weights of animals shown in Figure 4C and D. Mean +/− sd. CTD1 (n=13) and CTD1 X>W (n=9), WT male littermates of CTD1 X>W animals (n=10). (B) Quantification of Mecp2 primary transcript and mRNA in whole brain of 6 week old male mice. N=3 brains per genotype. Mean +/− sd. Unpaired two-tailed t-test: Primary transcript CTD1 X>W vs WT littermates P>0.9999 (ns), CTD1 vs WT P=0.2585 (ns), mRNA CTD1 X>W vs WT P=0.1419 (ns), CTD1 vs WT P=0.0008 (***).
Figure 5.
Figure 5.
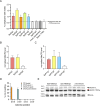
Flp-In T-REx cell lines reproduce the reduction in MeCP2 protein and mRNA seen with CTD knock-in mouse alleles. (A) Schematic of Mecp2 transgenes in Flp-In T-REx cell lines. Deletions are introduced into a full-length e1 Mecp2 cDNA, with a bovine growth hormone (BGH) polyadenylation signal and tetracycline-inducible CMV promoter. (B) Western blot with whole cell lysates from independent Flp-In T-REx clones carrying mouse cDNA transgenes (24 hours tetracycline induction). Sin3a loading control. (C) Quantification of MeCP2 protein expression from (B). N=2 clones per genotype, mean +/− sd. Unpaired two-tailed t-test: WT vs CTD1 P=0.0035 (**), WT vs CTD2hu P=0.0099 (**), WT vs CTD2mo P=0.2101 (ns). (D) Quantification of Mecp2 transgene mRNA from the same experiment as (B) and (C). N=2 clones per genotype, mean +/− sd. Unpaired two-tailed t-test: WT vs CTD1 P=0.0057 (**), WT vs CTD2hu P=0.0208 (*), WT vs CTD2mo P=0.0171 (*).
Figure 5, Supplementary Figure 1
Flp-In T-REx cell lines with human MECP2 transgenes. (A) Schematic of human MECP2 transgenes in Flp-In T-REx cell lines. (B) Western blot with whole cell lysates from independent Flp-In T-REx clones carrying human cDNA transgenes (24 hours tetracycline induction). Sin3a loading control. (C) Quantification of MeCP2 protein expression from (B). N=2 clones per genotype, mean +/− sd. Unpaired two-tailed t-test: WT vs CTD1 P=0.0042 (**), WT vs CTD2 P=0.0060 (**). (D) Quantification of Mecp2 transgene mRNA from the same experiment as (B) and (C). N=2 clones per genotype, mean +/− sd. Unpaired two-tailed t-test: WT vs CTD1 P=0.0126 (*), WT vs CTD2 P=0.0099 (**), WT vs CTD2mo P=0.0171 (*).
Figure 6.
Figure 6.
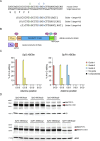
Base editing of mouse CTD transgenes in Flp-In T-REx cell lines. (A) Target genomic sequence and sgRNAs. The target A (position 0) is shown in green, with two bystander As within the guide sequence shown in blue (positions +6 and +9). Target site protospacer sequences are shown along with the PAM; the gRNA spacers are flanked by an additional G added to promote RNA polIII transcription. (B) ABE and gRNA constructs used for transfection experiments. (C) Editing efficiency following transfection of mouse CTD1 Flp-In T-REx cells with ABE8e-SpG or ABE8e-SpRY base editors and gRNA expression plasmids. Editing efficiency at the target and bystander As is quantified by amplicon sequencing (n=3 transfections per ABE/guide combination). (D) western blot showing MeCP2 protein levels from the experiment in (C) after 24 hours induction of transgene expression. The red arrow indicates MeCP2 CTD1 protein after editing (CTD1 X>W).
Figure 6, Supplementary Figure 1
Base editing of CTD transgenes in Flp-In T-REx cell lines. (A) mouse CTD Flp-In T-REx cells treated with ABE/guide RNAs as shown in Figure 6C. Percentage of mapped reads with indels. Background indel rate is indicated based on the % indels found in amplicons from mock- or untransfected cells. (B) Quantification of total CTD MeCP2 levels from western blot in Figure 6D, SpG ABE8e. (C) Quantification of total CTD MeCP2 levels from western blot in Figure 6D, SpRY ABE8e. (D) Editing efficiency of SpG ABE8e/mouse guide 1 at target and bystander As in mouse CTD1 and CTD2hu Flp-In T-REx cells. Mean +/− sd, n=3 transfections per ABE/guide combination. (E) western blot showing MeCP2 protein levels from the mouse CTD2hu cells in (D) after 24 hours induction of transgene expression. The red arrow indicates MeCP2 CTD1 protein after editing (CTD1 X>W).
Figure 6, Supplementary Figure 2
Editing of human MECP2 transgenes in Flp-In T-REx cells . (A) Target genomic sequence and sgRNAs. Target A (position 0) is shown in green, with two bystander As within the guide sequence shown in blue (positions +6 and +9). The difference between human (red) and mouse (underlined) sequences is indicated. (B) Editing efficiency following transfection of human CTD1 Flp-In T-REx cells with ABE8e-SpG or SpRY base editors and guide RNA plasmids shown in (A). Editing efficiency at the target and bystander As is quantified by amplicon sequencing (n=3 transfections per ABE/guide combination). (C) western blot showing MeCP2 protein levels from the experiment in (B) after 24 hours induction of transgene expression. The red arrow indicates MeCP2 CTD1 protein after editing (CTD1 X>W). Sin3a loading control.

References

    1. Alves CRR, Ha LL, Yaworski R, Sutton ER, Lazzarotto CR, Christie KA, Reilly A, Beauvais A, Doll RM, de la Cruz D, Maguire CA, Swoboda KJ, Tsai SQ, Kothary R, Kleinstiver BP. 2024. Optimization of base editors for the functional correction of SMN2 as a treatment for spinal muscular atrophy. Nat Biomed Eng 8:118–131. doi: 10.1038/s41551-023-01132-z - DOI - PMC - PubMed
    1. Amir RE, Van den Veyver IB, Wan M, Tran CQ, Francke U, Zoghbi HY. 1999. Rett syndrome is caused by mutations in X-linked MECP2, encoding methyl-CpG-binding protein 2. Nature genetics 23:185–8. doi: 10.1038/13810 - DOI - PubMed
    1. Anzalone AV, Randolph PB, Davis JR, Sousa AA, Koblan LW, Levy JM, Chen PJ, Wilson C, Newby GA, Raguram A, Liu DR. 2019. Search-and-replace genome editing without double-strand breaks or donor DNA. Nature 576:149–157. doi: 10.1038/s41586-019-1711-4 - DOI - PMC - PubMed
    1. Augenstein K, Lane JB, Horton A, Schanen C, Percy AK. 2009. Variable phenotypic expression of a MECP2 mutation in a family. J Neurodev Disord 1:313. doi: 10.1007/s11689-009-9034-7 - DOI - PMC - PubMed
    1. Bain G, Kitchens D, Yao M, Huettner JE, Gottlieb DI. 1995. Embryonic stem cells express neuronal properties in vitro. Developmental biology 168:342–57. doi: 10.1006/dbio.1995.1085 - DOI - PubMed

Publication types

LinkOut - more resources