[Preprint]. 2025 Sep 4:2024.10.13.618101.
doi: 10.1101/2024.10.13.618101.

Tau, amyloid-beta and alpha-synuclein co-pathologies synergistically enhance neuroinflammation and neuropathology

Affiliations

Tau, amyloid-beta and alpha-synuclein co-pathologies synergistically enhance neuroinflammation and neuropathology

Jhodi M Webster et al. bioRxiv. .

Abstract

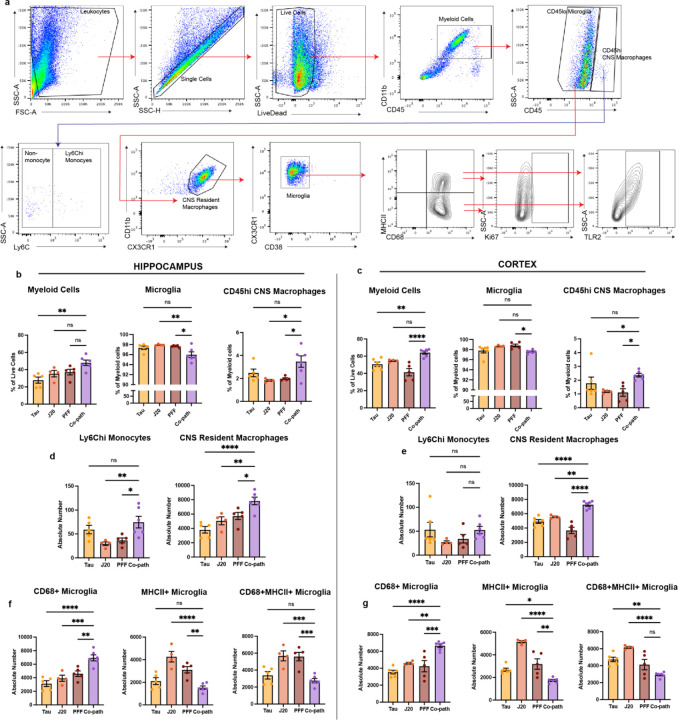
Alzheimer's and Parkinson disease pathology often co-occur, with amyloid-β and phosphorylated tau, found in 30-50% of idiopathic Parkinson disease cases. α -synuclein inclusions, a hallmark of Parkinson disease, are present in 50% of Alzheimer's cases and the co-expression of these pathologies is linked to faster cognitive decline and earlier death. Immune activation is a hallmark of both diseases, but current model systems primarily examine each pathology in isolation. As such, how these co-pathologies interact to drive inflammation and neuronal loss remain poorly understood. To address this, we developed a co-pathology mouse model combining tau, amyloid-β, and α-synuclein. Here, we show that co-pathologies synergistically trigger a distinct and amplified neuroimmune response, marked by robust expansion of CD4+ and CD8+ tissue-resident memory T cells and increased CD68+ microglia, a population of activated, phagocytosing microglia, compared to single pathology brains. These changes were abundant in the hippocampus and cortex, regions showing elevated amyloid-β protein pathology load and enhanced neuronal loss with co-pathology expression. Our findings demonstrate that co-pathologies act synergistically to enhance immune activation prior to neurodegeneration. This model provides a platform for assessing mixed-pathology mechanisms and identifies key immune cell populations that may drive disease acceleration across Alzheimer's, Parkinson disease and their related dementias.

Keywords: T cells; amyloid beta; co-pathologies; microglia; neuroinflammation; tau; α-synuclein.


Conflict of interest statement

Competing interests The authors have no competing interests.

Figures

Extended Data Figure 1.
Uncropped western blot images corresponding to Figure 1. (a,b) Blots probed for total α-syn and GAPDH from Triton-X100 soluble and insoluble (a) hippocampus and (b) cortex samples from co-pathology and single pathology animals. Blots probed for total tau and GAPDH from Triton-X100 soluble and insoluble (c) hippocampus and (d) cortex samples from co-pathology and single pathology animals. For c and d, the same membrane was probed sequentially for total tau and subsequently for GAPDH as a loading control.
Extended Data Figure 2.
A series of behavioral tests were conducted on co-pathology and single pathology animals. (a) Quantification of latency to entry zone, to goal quadrant, to first error and the total number of errors analyzed from Barnes maze test. (b) Measures of total time, turnaround time and time descending on the pole test. (c) distance travelled, velocity, time in center and time in outside are depicted from open field test. (d) Total duration of animals on rotarod platform across 5 days of testing. One-way ANOVA with post hoc for significance. Mean values +/‒ SEM are plotted. ns = no significance, *p<0.05, **p<0.01, ***p<0.005. n=8–10 animals per group, both males and females used.
Extended Data Figure 3.
Dendritic spine morphology was assessed in the CA1 region of hippocampus on pyramidal neurons and measures of total spine length and spine volume for all spines and for thin, stubby and mushroom subgroups are plotted from (a) combined (both apical and basal), (b) apical only or (c) basal only dendrites. One-way ANOVA with post hoc for significance. Mean values +/‒ SEM are plotted. ns = no significance, *p<0.05, **p<0.01, ***p<0.005. n=8–10 animals per group, both males and females used.
Extended Data Figure 4.
Unbiased stereology was used to assess for neuronal loss in the hippocampus and SNpc. (a,b) Estimated population of NeuN+ neurons of co-pathology and single pathology CA1 or CA3 compared to their individual controls. (c) TH+ neurons (brown) in the SNpc of single pathology and co-pathology brains. (d) Unbiased stereology was used to quantify the number of TH+ neurons in the SNpc in the co-pathology mouse model compared to Tau, J20 and PFF single pathology brains. All images taken at 20X. Scale bars = 100μm. One-way ANOVA with post hoc for significance. Mean values +/‒ SEM are plotted. Ns = no significance, **p<0.01, ***p<0.005, ****p<0.0001. n=7–8 animals per group, both males and females used.
Extended Data Figure 5.
(a) Gating strategy for flow cytometry analysis of microglia. (b) Quantification of proportion of myeloid cells, microglia and infiltrating monocytes/CNS resident macrophages in the co-pathology model hippocampus and (c) cortex compared to single pathology brains. (d,e) absolute number of CD68+ microglia, MHCII+ microglia and MHCII+CD68+ microglia in the hippocampus and cortex of single pathology and co-pathology brains. Analyzed using One-way ANOVA. Mean values +/‒ SEM are plotted. *p<0.05, **p<0.01, ***p<0.005. n=5–6/group, with two brain regions pooled per sampled, both males and females included in analysis.
Extended Data Figure 6.
(a) Representative images showing CD3+ staining (nickel) from Tau, J20, PFF and co-pathology brains. (b) Gating strategy for flow cytometry analysis of T cells. (c) Quantification from flow cytometry of proportion of CD4 and CD8 T cells, and absolute number of effector CD4 and CD8 T cells, and Trm T cells in the hippocampus and (d) cortex. Analyzed using One-way ANOVA. Mean values +/‒ SEM are plotted. *p<0.05, **p<0.01, ***p<0.005. n=5–6/group, with two brain regions pooled per sampled, both males and females included in analysis.
Figure 1.
Figure 1.. Strategy for creating co-pathology mouse model.
At 12–14 weeks old, non-transgenic (NTG) wild-type or J20 APP mutant (APPmut) transgenic (Tg) age-matched males and females are used to induce either single pathology controls or the co-pathology model in vivo. (a) For τau single pathology controls, NTG mice received injections of 2μL of 3.2E12 vg/mL AAV9-Tau into the entorhinal cortex. This viral overexpression of mutant tau results in the accumulation of phosphorylated tau (p-tau) in the cell body via retrograde transport. (b) For Aβ pathology, J20 Tg mice expressing human APP with Swedish and Indiana mutations under the PGDF-β promoter were used. These mice develop Aβ plaques due to overproduction and deposition of Aβ. (c) For α-syn pathology in the PFF single pathology control, NTG mice were injected with 2μL of 5μg α-syn PFFs into the striatum. Fibrils deposited into the brain will interact with endogenous α-syn within the neurons to form neuritic and somal aggregates. (d) For the co-pathology model, J20 Tg mice received both AAV9-Tau and α-syn PFFs into the entorhinal cortex and striatum, respectively, to simultaneously induce the expression of Aβ, tau and α-syn the brain.
Figure 2.
Figure 2.. The presence of co-pathology enhances Aβ and α-syn pathology load in hippocampus and cortex.
(a) 12–14-week-old animals were induced with either single pathologies or co-pathologies. At 3mpi, mice were sacrificed and brains processed for IHC or biochemical analysis of protein levels. (b) AT-8/pTau-positive neurons (DAB+, brown) in the hippocampus and cortex of tau single pathology and co-pathology brains. (c) Representative immunoblot of total tau and GAPDH. Blots are cropped from original images found in Extended Data figures. (d) Quantification of tau protein levels normalized to GAPDH levels in TX-soluble and TX-insoluble hippocampus and cortical samples from Tau single pathology and co-pathology mice. (e) Aβ-positive plaques (DAB+, brown) expressed within the hippocampus and cortex of J20 single pathology (Aβ) and co-pathology brains. (f) ELISA was used to quantify Aβ1–42 levels in the brains of J20 single pathology and co-pathology mice. Triton-X100 soluble and insoluble fractions of hippocampal and cortical tissue were used. (g) pSer129-positive inclusions in the hippocampus and cortex of PFF only (α-syn) and co-pathology brains. (h) Representative immunoblot of total α-syn and GAPDH. Blots are cropped from original images found in Extended Data figures. (i) Quantification of synuclein protein levels normalized to GAPDH levels in TX-soluble and TX-insoluble hippocampus and cortical samples from PFF single pathology and co-pathology mice. All images taken at 10X or 20X for zooms, scale bars = 100μm. Analyzed using Welch’s t-test. *p<0.05, **p<0.01. n=6 animals per group, both males and females used.
Figure 3.
Figure 3.. Co-pathologies drive neurodegeneration in the hippocampus at 6mpi.
(a) At 3mpi single pathology and co-pathology brains were processed for DAB IHC and unbiased stereology. (b) Representative brightfield images of NeuN+ neurons (DAB+, brown) in the hippocampus of Tau, J20 and PFF single pathology and co-pathology brain. Unbiased stereology was used to quantify the number of NeuN+ neurons in the (c) CA1 and (d) CA3 regions of the hippocampus in the co-pathology mouse model compared to Tau, J20 and PFF single pathology brains. (All images taken at 20X. Scale bars = 300μm and 100μm for zooms. One-way ANOVA with post hoc test was used to assess for significance. Mean values +/‒ SEM are plotted. ns = no significance, **p<0.01, ***p<0.005, ****p<0.0001. n=7–8 animals per group, both males and females used.
Figure 4.
Figure 4.. Co-pathologies enhance microglia activation at 3mpi.
(a) J20 transgenic mice are injected at 12–14 weeks of age with 2uL of 5ug α-syn PFFs and 2uL of 3.2E12 vg/mL AAV9-Tau into the striatum and entorhinal cortex, respectively. For single pathology controls, age-matched non-transgenic littermates are injected with α-syn PFFs into the dorsal lateral striatum for PFF single pathology control or AAV9-Tau into the entorhinal cortex for Tau single pathology control. Age-matched J20 mice are used as the Aβ single pathology controls. At 3mpi, brains were collected and the hippocampus and surrounding cortices dissected and processed for spectral flow cytometry. (b) Representative fluorescent grayscale images of Iba1+ microglia in the hippocampus of Tau, J20 and PFF single pathology controls compared to that in the co-pathology model. (c) Representative flow cytometry contour plots showing CD45mid-lo microglia and CD45hi CNS macrophages in single pathology and co-pathology hippocampus. The relative frequency of total myeloid cells, microglia and CD45hi infiltrating monocytes and resident macrophages in the (d) hippocampus and (e) cortex of Tau, J20 and PFF only compared to co-pathology brains are plotted. (f) From the CD45mid-lo microglia population, representative contour plots show expression of activation markers MHCII (antigen presentation, activated), CD68 (phagocytosing). The absolute number of MHCII+CD68+ microglia that are Ki67+ or TLR2+ in the (g) hippocampus and (b) cortex of co-pathology and single pathology mice. MHCIICD68+ microglia that are Ki67+ or TLR2+ in the (i) hippocampus and (j) cortex Tau, J20 and PFF only compared to co-pathology brains are plotted. Analyzed using One-way ANOVA. Mean values +/‒ SEM are plotted. *p<0.05, **p<0.01, ***p<0.005. n=5–6/group, with two brain regions pooled per sampled, both males and females included in analysis. First panel images taken at 10X magnification and zoomed, z-stack images at 40X. Scale bars (10X) = 100μm, scale bars (40X) = 10μm.
Figure 5.
Figure 5.. Co-pathologies promote T cell responses and tissue-resident memory T cell phenotypes at 3mpi.
(a) J20 transgenic mice are injected at 12–14 weeks of age with 2uL of 5ug α-syn PFFs and 2uL of 3.2E12 vg/mL AAV9-Tau into the striatum and entorhinal cortex, respectively. For single pathology controls, age-matched non-transgenic littermates are injected with α-syn PFFs into the dorsal lateral striatum for PFF single pathology control or AAV9-Tau into the entorhinal cortex for Tau single pathology control. Age-matched J20 mice are used as the Aβ single pathology controls. At 3mpi, brains were collected and the hippocampus and surrounding cortices dissected and processed for spectral flow cytometry. (b) Representative fluorescent images of Iba1+ microglia (green) and CD4+ T cells (magenta) in the hippocampus of Tau, J20 and PFF single pathology controls compared to that in the co-pathology model. (c) Representative flow cytometry contour plots show proportion for CD4+ and CD8+ T cells. The relative frequency of CD4+ and CD8+ T cells in the (d) hippocampus and (e) cortex of Tau, J20 and PFF only compared to co-pathology brains are plotted. (f) Representative contour plot showing expression and gating scheme of CD4+ Trm T cells. Quantified average fold change of CD44+ effector and CD69+ Trm in co-pathology (g) hippocampus and (h) cortex relative to Tau, J20 and PFF single pathologies. (i) Representative contour plot showing expression and gating scheme of CD8+ Trm T cells. Quantified average fold change of CD44+ effector and CD69+CD103+ Trm in co-pathology (j) hippocampus and (k) cortex relative to Tau, J20 and PFF single pathologies. Analyzed using One-way ANOVA. Mean values +/‒ SEM are plotted. *p<0.05, **p<0.01, ***p<0.005. n=6/group, with two brain regions pooled per sampled, both males and females included in analysis. All images taken at 10X magnification with z-stack, and digitally zoomed using Nikon Elements software. Scale bars = 50μm.
Figure 6.
Figure 6.. Synergistic effects of co-pathologies promote neuroinflammation, protein pathology load and neurodegeneration.
Single pathology models (left panel) showing relatively mild immune activation and pathology, with little to no inclusion of tissue-resident memory (Trm) T cells, CD4+ and CD8+ T cells, monocytes and CNS resident macrophages. With the co-pathology model (middle panels), we demonstrate that concurrent protein aggregation (Aβ plaques, p-tau tangles and α-syn inclusions synergistically lead to increased recruitment and expansion of CNS-infiltrating immune cells and Trm populations. This is accompanied by microglial phenotype changes and elevated CD68+ expression and decreased number of MHCII+ cells. The cumulative effects of aggregated protein burden and chronic neuroinflammation result in neuronal damage and subsequent death.

References

    1. Goedert M. (1993). Tau protein and the neurofibrillary pathology of Alzheimer’s disease. Trends Neurosci 16, 460–465. 10.1016/0166-2236(93)90078-z. - DOI - PubMed
    1. Joachim C.L., and Selkoe D.J. (1989). Amyloid protein in Alzheimer’s disease. J Gerontol 44, B77–82. 10.1093/geronj/44.4.b77. - DOI - PubMed
    1. Spillantini M.G., Schmidt M.L., Lee V.M., Trojanowski J.Q., Jakes R., and Goedert M. (1997). Alpha-synuclein in Lewy bodies. Nature 388, 839–840. 10.1038/42166. - DOI - PubMed
    1. Irwin D.J., Grossman M., Weintraub D., Hurtig H.I., Duda J.E., Xie S.X., Lee E.B., Van Deerlin V.M., Lopez O.L., Kofler J.K., et al. (2017). Neuropathological and genetic correlates of survival and dementia onset in synucleinopathies: a retrospective analysis. Lancet Neurol 16, 55–65. 10.1016/s1474-4422(16)30291-5. - DOI - PMC - PubMed
    1. Irwin D.J., Xie S.X., Coughlin D., Nevler N., Akhtar R.S., McMillan C.T., Lee E.B., Wolk D.A., Weintraub D., Chen-Plotkin A., et al. (2018). CSF tau and β-amyloid predict cerebral synucleinopathy in autopsied Lewy body disorders. Neurology 90, e1038–e1046. 10.1212/wnl.0000000000005166. - DOI - PMC - PubMed

Publication types