[Preprint]. 2025 Sep 1:2024.07.30.605881.
doi: 10.1101/2024.07.30.605881.

Logan: Planetary-Scale Genome Assembly Surveys Life's Diversity

Affiliations

Logan: Planetary-Scale Genome Assembly Surveys Life's Diversity

Rayan Chikhi et al. bioRxiv. .

Abstract

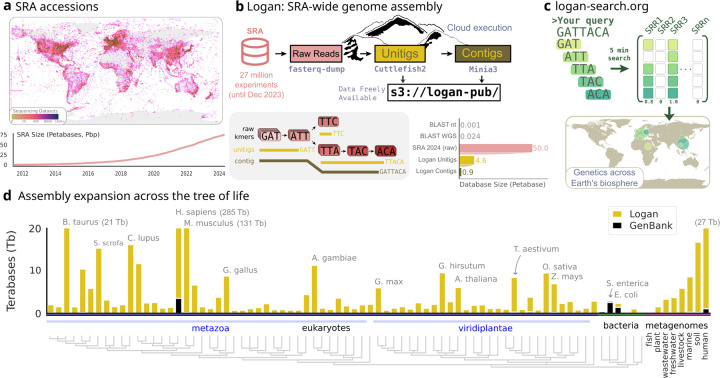
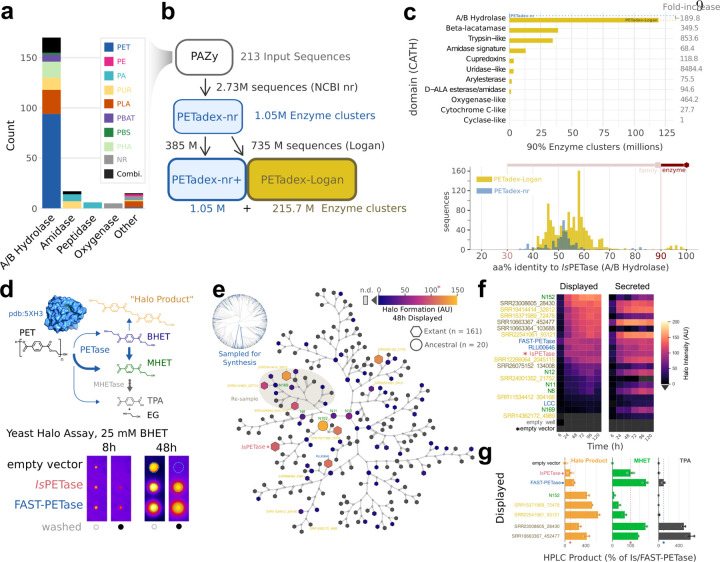
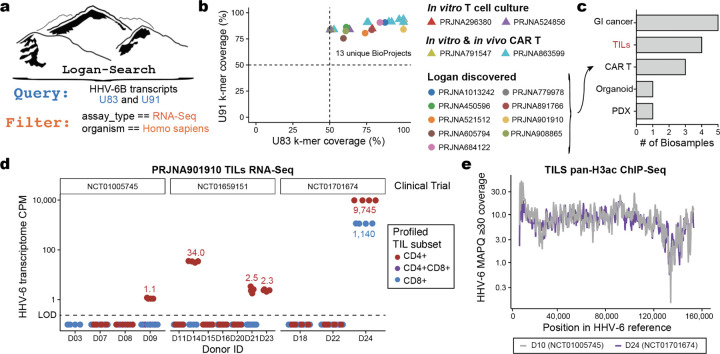
The breadth of life's diversity is unfathomable, but public nucleic acid sequencing data offers a window into the dispersion and evolution of genetic diversity across Earth. However the rapid growth and accumulation of sequence data have outpaced efficient analysis capabilities. The largest collection of freely available sequencing data is the Sequence Read Archive (SRA), comprising 27.3 million datasets or 5 × 10¹⁶ basepairs. To realize the potential of the SRA, we constructed Logan, a massive sequence assembly transforming short reads into long contigs and compressing the data over 100-fold, enabling highly efficient petabase-scale analysis. We created Logan-Search, a k-mer index of Logan for free planetary-scale sequence search, returning matches in minutes. We used Logan contigs to identify >200 million plastic-degrading enzyme homologs, and validate novel enzymes with catalytic activities exceeding current reference standards. Further, we vastly expand the known diversity of proteins (30-fold over UniRef50), plasmids (22-fold over PLSDB), P4 satellites (4.5-fold), and the recently described Obelisk RNA elements (3.7-fold). Logan also enables ecological and biomedical data mining, such as global tracking of antimicrobial resistance genes and the characterization of viral reactivation across millions of human BioSamples. By transforming the SRA, Logan democratizes access to the world's public genetic data and opens frontiers in biotechnology, molecular ecology, and global health.


Conflict of interest statement

8Competing interests The authors declare no competing interests.

Figures

Extended Data Fig. 1:
Extended Data Fig. 1:. Logan assembly performance and computational statistics for processing the entire SRA.
This figure details the performance benchmarks of the Logan pipeline and quantifies the cloud computing resources used to assemble 27 million SRA datasets. (Top Left) A histogram showing the distribution of assembly contiguity, measured by contig N50, across all Logan assemblies. Assemblies are categorized by input SRA assay type, showing that Whole Genome Shotgun (WGS/WGA) samples generally produce more contiguous assemblies than RNA-Seq or other samples, as expected. (Top Middle and Right) Performance benchmarks comparing the Logan assembly pipeline to other state-of-the-art short read metagenome assembly tools (Penguin, maviralSPAdes). Logan pipeline demonstrates significantly lower wall-clock running time (middle) and memory usage (right) across a range of input data sizes, highlighting its efficiency. (Bottom) Statistics from the full-scale production run. Global statistics summarize the total compute effort, including processing 50 petabases of input data over 30 million CPU hours. The vCPU Usage Over Time plot for the main production run illustrates the dynamic allocation of cloud processors, peaking at over 2.18 million vCPUs. Run 6 statistics detail the single largest run, where 19.6 petabases of data were assembled in just 7 hours.
Extended Data Fig. 2:
Extended Data Fig. 2:. PETadex-Logan Workflow.
(a) Characterization of the initial 213 plastic-active enzymes from the PAZy database. (i) A network graph showing sequence similarity between the known enzymes, colored by protein family. (ii) Bar chart showing the distribution of these enzymes across protein families and the types of plastics they degrade. (iii) Schematic of the hierarchical clustering strategy used to group sequences at the enzyme (90% identity), family (30% identity), and domain (CATH) levels. (b) The two-stage deep homology search pipeline. (i) The first stage queried PAZy sequences against the NCBI nr database. After filtering for domain integrity and clustering, this step yielded 1.05 million enzyme clusters, creating the PETadex-nr dataset. (ii) In the second stage, PETadex-nr was queried against the entire Logan assembled contigs, identifying 735 million novel sequences and massively expanding the diversity into the final PETadex-Logan dataset. (c) A phylogenetic tree of the IsPETase-like A/B Hydrolase clade. The tree visually demonstrates the expansion of sequence diversity uncovered by the Logan search compared to the previously known diversity from public databases like PAZy and GenBank (blue labels). Sequences selected for experimental evaluation are labeled.
Extended Data Fig. 3:
Extended Data Fig. 3:. PETase Halo Assay.
(a) Clearing and white halo detection with yeast colonies expressing surface displayed or secreted PETase enzymes. Yeast strains were robotically pinned onto YPD medium containing 12.5 mM or 25 mM BHET and incubated for 8 to 72 hours at 30 degrees Celsius. Plates were imaged before (open circle) and after (closed circle) washing colonies off the plate. (b) Clearing and white halo quantification from washed YPD plates containing 12.5 mM or 25 mM BHET. Pixel intensity of the colony area was measured using a custom R pipeline (see Methods) on images from (a). Data is depicted as the background normalized median pixel intensity under each colony over time for the indicated PETases; n=3. (c) High-Performance Liquid Chromatography (HPLC) analysis of the clearing zone identifies the MHET reaction product. Agar plugs were excised from the plates in (a) for the displayed PETases , empty vector control, and regions with no yeast cells, after 72 hours of yeast growth on 12.5 mM BHET, and dissolved in DMSO prior to HPLC analysis. Representative chromatograms are shown; n ≥ 2. Coloured shading indicates the identity of each peak. (d) HPLC analysis of the white halo identifies MHET and BHET dimer reaction products. Agar plugs were excised from the plates in (a) for the displayed PETases , empty vector control, and regions with no yeast cells, after 72 hours of yeast growth on 25 mM BHET, and dissolved in DMSO prior to HPLC analysis. Representative chromatograms are shown; n ≥ 2. Coloured shading indicates the identity of each peak. (e) Mass spectrometric (MS) analysis of MHET, BHET, and BHET dimer purified from a white halo extracted under a yeast colony expressing surface-displayed IsPETase after 24 hours on YPD plus 25 mM BHET. Representative spectra are shown with the mass to charge ratio of the most abundant component indicated; n = 3. The chemical structures of BHET, MHET and putative BHET dimer are shown along with their predicted ionized mass. (f) HPLC analysis of 10 nmol of HPLC-purified BHET, and 10 nmol of HPLC-purified BHET dimer. Coloured shading indicates the identity of each peak. (g) Correlation plot of absorbance peak areas from HPLC analysis of the indicated amounts of purified BHET and BHET dimer. The linear regression line is plotted. (h) MS quantification of MHET and BHET dimer from agar plug extraction. Agar plugs were obtained from an area of YPD plus BHET 25 mM with no yeast colony (no cells) or under the yeast colonies (after wash) containing the indicated constructs after 24 hours of incubation and processed as in (d). Relative abundance is plotted, expressed as a ratio between spectral counts for MHET (top) or BHET dimer (bottom) relative to the spectral counts obtained for BHET. EV: empty vector; P: IsPETase; FP: FAST-PETase. (i,j) Quantification of BHET conversion in clearing zones and white halos over time. Halos from the indicated strains, timepoints and BHET concentrations were processed as described in (c,d) and analyzed by HPLC. Peak area for each analyte (BHET, MHET, BHET dimer) was measured and expressed as a percentage relative to the sum of the peak areas for BHET+MHET+BHET dimer. EV: empty vector; P: IsPETase; FP: FAST-PETase.
Extended Data Fig. 4:
Extended Data Fig. 4:. High-throughput screening and HPLC validation of PETadex-Logan enzymes.
(a) Heatmap of the high-throughput activity screening results for Logan PETases and controls. Enzyme activity was measured as the background normalized median pixel intensity under each colony on YPD plates with 25mM BHET, at the indicated times, and in either surface displayed (D) or secreted (S) constructs. The heatmap shows the average of quadruplicate pixel intensity measurements (in arbitrary units, AU) after subtracting Empty Vector background values and scaling to approximately 100 units for IsPETase at 48 hours. This screen was used to identify the active candidates for quantitative analysis. (b) Quantification of BHET conversion in yeast strains expressing the top candidate PETase enzymes. Strains were grown to saturation in YPD medium prior to adding BHET at the indicated concentrations. BHET conversion reactions were allowed to proceed for 17 hours at 30°C, and culture supernatants were analyzed by HPLC. The peak area for each analyte (BHET, MHET, BHET dimer) was measured and expressed as a percentage of the sum of all peak areas normalized to 108 cells/ml, based on the cell concentration at the time of BHET addition. D: surface displayed enzyme; S: secreted enzyme.
Extended Data Fig. 5:
Extended Data Fig. 5:. Protein clustering workflow and its application in improving multiple sequence alignment (MSA) diversity.
(a) The workflow for creating the Logan90 and Logan50 clustered protein databases. Prodigal-predicted protein coding regions from all Logan contigs were first separated into ‘human’ and ‘other’ categories, based on SRA metadata associated with their contig and into ‘complete’ and ‘partial’, based on Prodigal’s output. The proteins were then clustered using Linclust at 90% and subsequently 50% sequence identity to create representative protein sets for sensitive homology searches. The numbers indicate billions (B) of proteins at each stage of the workflow. (b) A case study demonstrating the value of Logan50 for enhancing MSA diversity (Neff, left panel) and improving structure prediction quality (pLDDT, right panel) of 100 viral proteins with low-quality MSAs from the default ColabFold database. We performed sensitive, iterative profile searches against the other-complete Logan50 database (y-axis) using MMseqs2 and compared the results to those from the default ColabFold database (x-axis). In both panels, nearly all points lie above the diagonal, indicating that Logan50 yields more diverse alignments and substantially improved structural predictions.
Extended Data Fig. 6:
Extended Data Fig. 6:. Supporting information for identification and reactivation of HHV-6 in large-scale RNA-seq datasets.
(a) Summary of HHV-6B reference transcriptome. Viral transcript abundance was computed from a prior characterization of HHV-6 reactivation in CAR T cells (Sample 34; Day 19) [22]. Boxed genes represent selected sequences used as queries for Logan-Search. (b) UMAP representation of cells profiled via scRNA-seq from lung organoid culture (PRJNA891766). Panels reflect marker genes identifying a cluster of rare proliferating T cells (1.3% of total), including two HHV-6 super-expressor cells (82% of HHV-6 UMIs). (c) Quantification of all ChIP-seq libraries from CD4+ and CD8+ TIL cultures (PRJNA901909 ). The abundance of HHV-6 MAPQ 30+ reads is shown with donors stratified by three participating clinical trials. Arrow indicates a high HHV-6 reactivation donor with no matched RNA-seq. (d) Single nucleotide variant analysis of Donor 10 and Donor 24 CD8+ ChIP-seq analysis. Shown are allele frequencies of 72 high-confidence single-nucleotide variants that discriminate the viral strains of the two donors.
Extended Data Fig. 7:
Extended Data Fig. 7:. Global distribution of AMR-associated SRA accessions
(a) Summary of SRA accessions (top row) and plasmids (bottom row) categorized as AMR-positive (AMR+). First panel, amount of AMR+ vs AMR- samples in the datasets. Second panel, from the AMR+ samples, how many are classified as isolate (purple) or metagenome (yellow) as organism type. Final panel, from the AMR+ metagenome samples, distribution across metagenome categories (human: purple, soil: orange, livestock: yellow, marine: blue, freshwater: green, wastewater: red, other: grey). (b) Log2 enrichment of organism type categories in AMR+ datasets versus the average, in SRA accessions (top) and plasmids (bottom), showing relative over- or underrepresentation. Data has been randomly subsampled to avoid bias driven by categories with higher amount of data. (c) Log2 enrichment of metagenome categories among AMR+ datasets compared to the mean, for both SRA accessions (top) and plasmids (bottom). Positive values indicate overrepresentation in AMR+ samples. Data has been randomly subsampled to avoid bias driven by categories with higher amount of data. (d) Geographic distribution of unique AMR+ SRA accessions across the globe, coloured by metagenome category. Circle size indicates the number of unique accessions per location. (e) Temporal trends in AMR gene discovery. Top: Collection date timeline of AMR+ accessions by organism type (isolate: purple, metagenome: yellow). Bottom: Collection date timeline of AMR+ metagenome accessions coloured by metagenome category. (f) Distribution of AMR gene counts per accession by metagenome category. (g) Log2 enrichment of AMR gene counts per metagenome accession compared to the mean, by metagenome category. Positive values indicate metagenomes with more AMR genes per accession on average. Data has been randomly subsampled to avoid bias driven by categories with higher amount of data. In panels (c), (d), (e) bottom panel, (f), and (g), metagenome category “other” was removed from the analysis.
Extended Data Fig. 8:
Extended Data Fig. 8:. Expansion of P4 phage satellite genetic diversity.
(a) Pipeline for discovering novel P4 elements. (b) Histogram of novel P4 elements binned by SatelliteFinder type. (c) Pangenome curve expressing accumulation of gene families clustered at 40% protein identity before (Ref-Seq: Types A, B, and C) and after Logan expansion (Logan: Types A and B). (d) Weighted Genome Relatedness Ratio Plot (wGRR) of full proteomes, defined as all proteins found between first and last detected core gene, from before (RefSeq/black) and after (Logan/grey) Logan expansion, where a darker color denotes higher similarity.
Figure 1:
Figure 1:. Assembling all accessions of the SRA using a cloud architecture into unitigs and contigs.
(a) Geographic distribution of samples over the Sequence Read Archive (SRA), and the near-exponential growth of SRA in terms of number of cumulative accession size of raw data. (b) Top diagram describes the cloud computation workflow of Logan, starting from SRA reads, then computing unitigs and contigs assemblies, and finally uploading data to our public repository. Bottom left diagram shows a toy dataset with k-mers extracted from raw reads, then unitigs and contigs constructed. Bottom right bar plot represents the size of the SRA compared to Logan assembled unitigs and contigs in sum of bases, and WGS and BLAST databases. (c) The logan-search.org service enables searching an arbitrary query (example: “GATTACA”) against the full unitig index of the SRA in less than 5 min; hits are mapped to their geographic origins. (d) Tree of Life sampled with the 116 most abundant taxa from NCBI GenBank WGS as well as 116 most abundant taxa in Logan assemblies, according to NCBI taxonomy. Black bars represent the total number of assembled bases in GenBank WGS, and yellow bars the additional number of bases in Logan contigs. Bars exceeding 20 terabases are capped and their true total assembly size is annotated. Assembled bases for a subset of metagenome types are represented separately as the 8 rightmost bars.
Figure 2:
Figure 2:. Discovering novel and efficacious plastic-active enzymes.
(a) The domains and activity of the 213 experimentally validated plastic-active enzyme (PAZy) search query (Extended Data Fig. 2a) (b) Logan PETadex homology search returned 216.75 million PAZy-homologs after clustering at 90% amino acid identity (Extended Data Fig. 2b,c). (c) PETadex -Logan is a >200-fold expansion of candidate PAZy relative to NCBI nr across distinct PAZy CATH domains (see Methods). Histogram shows the distribution of IsPETase-aligned sequences, illustrating that Logan (yellow) uncovers more diversity across the detectable range of sequence identities relative to NCBI nr (blue). (d) The PETase reaction which underpins the high-throughput yeast-based halo assay. Yeast expressing either control (IsPETase) or candidate enzyme targeting the PET substrate BHET were grown on agar plates to create a white halo which is quantified as pixel intensity (shown as pseudocolored), before (open circle) and after washing (black circle) around the colony (cyan outline) (Extended Data Fig. 3a,b). High-performance liquid chromatography (HPLC) and mass spectroscopy suggest that the “halo product” is O,O′-(ethane-1,2-diyl) bis(oxy(2-hydroxyethyl)carbonyl)terephthalate (Extended Data Fig. 3e,f). (e) Phylogenetic tree of sampled candidate PAZy that were synthesized and experimentally screened. Nodes are colored based on 48 hour halo formation activity in surface-displayed expression. The gray-highlighted clade was re-sampled for additional sequences. (f) Heatmap of select enzyme halo formation activity over time, quantified in surface-display and secreted systems (Extended Data Fig. 4a). (g) Quantitative validation of candidate high-activity PETadex -Logan enzymes by HPLC. The bars show the percentage of product formed relative to the activity of IsPETase (halo product, MHET) or FAST-PETase (TPA). Logan enzymes demonstrate product formation exceeding that of IsPETase and FAST-PETase.
Figure 3:
Figure 3:. Identification and reactivation of HHV-6 in large-scale RNA-seq datasets.
(a) Input query to Logan-Search for two abundant HHV-6 genes (U83 and U91) and filtering criteria for human RNA-seq BioSamples. (b) K-mer coverage analysis of 13 identified HHV-6–positive BioProjects, including 9 with no prior HHV-6 annotation (circles). Triangles indicating previously annotated datasets (Serratus and HHV6 paper). (c) Annotation of newly discovered HHV-6–bearing BioSamples, including gastrointestinal cancers, tumor-infiltrating lymphocytes (TILs), chimeric antigen receptor (CAR) T-cell products, organoids, and patient-derived xenografts (PDXs). (d) RNA-seq analyses of TIL cultures (PRJNA901910). Values indicate HHV-6 RNA abundance (counts per million, CPM) out of the full library, reflecting HHV-6 reactivation from cultured T cells. (e) ChIP-seq analyses of TIL cultures (PRJNA901909). Values reflect the HHV-6 DNA abundance for two donors in H3 acetylation chromatin, reflecting coverage across the full viral contig.
Figure 4:
Figure 4:. Expanding the Known Universe of Proteins, Plasmids, and Viral Elements
(a) Bar plot labeled “Total” shows the total number of proteins extracted from Logan contigs, compared to other databases, and bar plot labeled “Clustered” shows the same set of proteins but clustered at 50% identity. (b) Expansion of Obelisks requiring circular contigs with full-length Oblin-1 proteins, identified in Logan (yellow), relative to the initial petabase-scale search [9] (blue). Total sequences and species (clustered centroids of Oblin-1) are shown. (c) Number of P4 satellites found in Logan contigs (types A+B) compared to those in RefSeq (types A+B+C). Types A, B, C refer to the number of core components detected by SatelliteFinder (Methods): A = all 7, B = 6 out of 7, C = 5 out of 7. (d) Geographical distribution of plasmids detected over 2,095,914 samples with geolocation data. Circle areas are proportional to the number of distinct plasmid clusters per region. For visual clarity, spatially close samples were grouped using DBSCAN, and circles are placed at the coordinates of the corresponding cluster medoids. The map uses the Loximuthal projection. (e) Number of distinct plasmid cluster representatives detected over time. Counts (y-axis) are shown in 120-day intervals (x-axis). (f) Comparison of accessory gene repertoires in plasmids from environmental samples vs. cultured isolates. Plasmids from isolates are comparatively enriched for antimicrobial resistance (AMR) genes, whereas plasmids from environmental sources are enriched for antimicrobial peptides (AMPs). Functional enrichment (x-axis) was quantified as the ratio of gene density (genes per megabase) for a given function (AMR or AMP) between the two plasmid groups. (g) Relative Faith’s phylogenetic diversity of selected replicases and relaxases encoded by plasmids identified in Logan (yellow) and those retrieved from PLSDB (blue). The phylogenetic diversity fold change, indicated by numbers to the right of the bars, represents the ratio of the diversity across all plasmids (Logan and PLSDB combined) to the diversity in PLSDB plasmids alone.

References

    1. Katz Kenneth, Shutov Oleg, Lapoint Richard, Kimelman Michael, J Rodney Brister, and Christopher O’Sullivan. The Sequence Read Archive: a decade more of explosive growth. Nucleic Acids Research, 50(D1):D387–D390, 2022. - PMC - PubMed
    1. Edgar Robert C, Taylor Brie, Lin Victor, Altman Tomer, Barbera Pierre, Meleshko Dmitry, Lohr Dan, Novakovsky Gherman, Buchfink Benjamin, Al-Shayeb Basem, et al. Petabase-scale sequence alignment catalyses viral discovery. Nature, 602(7895):142–147, 2022. - PubMed
    1. Bradley Phelim, Den Bakker Henk C, Rocha Eduardo PC, McVean Gil, and Iqbal Zamin. Ultrafast search of all deposited bacterial and viral genomic data. Nature Biotechnology, 37(2):152–159, 2019.
    1. Karasikov Mikhail, Mustafa Harun, Danciu Daniel, Barber Christopher, Zimmermann Marc, Rätsch Gunnar, and Kahles André. Metagraph: Indexing and analysing nucleotide archives at petabase-scale. BioRxiv, pages 2020–10, 2020.
    1. Katz Kenneth S, Shutov Oleg, Lapoint Richard, Kimelman Michael, Rodney Brister J, and O’Sullivan Christopher. STAT: a fast, scalable, MinHash-based k-mer tool to assess Sequence Read Archive next-generation sequence submissions. Genome Biology, 22:1–15, 2021. - PMC - PubMed

Publication types

LinkOut - more resources