[Preprint]. 2025 Sep 7:2025.08.31.673391.
doi: 10.1101/2025.08.31.673391.

Interferon gamma signaling drives cardiac metabolic rewiring

Affiliations

Interferon gamma signaling drives cardiac metabolic rewiring

Ebram Tharwat Melika et al. bioRxiv. .

Abstract

Background: IFN-gamma (IFN-γ) signaling influences myocardial inflammation and fibrosis across a wide range of conditions, including ischemic and non-ischemic heart failure (HF). However, the direct effects of IFN-γ on cardiomyocytes remain poorly understood. Here, we developed a novel in vivo model to investigate how IFN-γ impacts myocardial metabolism and function.

Methods: Male C57BL/6J mice were injected intravenously with hepatotropic adeno-associated virus (AAV2/8) carrying Ifng and nLuc reporter under the albumin promoter (AAV-Ifng) or empty vector control virus (AAV-ctrl). Cardiac alterations were monitored on day 28 through flow cytometry, bulk RNA sequencing, targeted metabolomics, isolated mitochondrial activity, echocardiography, and in vivo imaging using [18F]fluordeoxyglucose ([18F]FDG) and [18F]fluoro-6-thia-heptadecanoic acid. Additionally, mice lacking IFN-γ receptor expression in cardiomyocytes (Myh6 Cre Ifngr1 fl/fl) were used to further dissect the cell-intrinsic roles of IFN-γ signaling in cardiomyocyte metabolic reprograming.

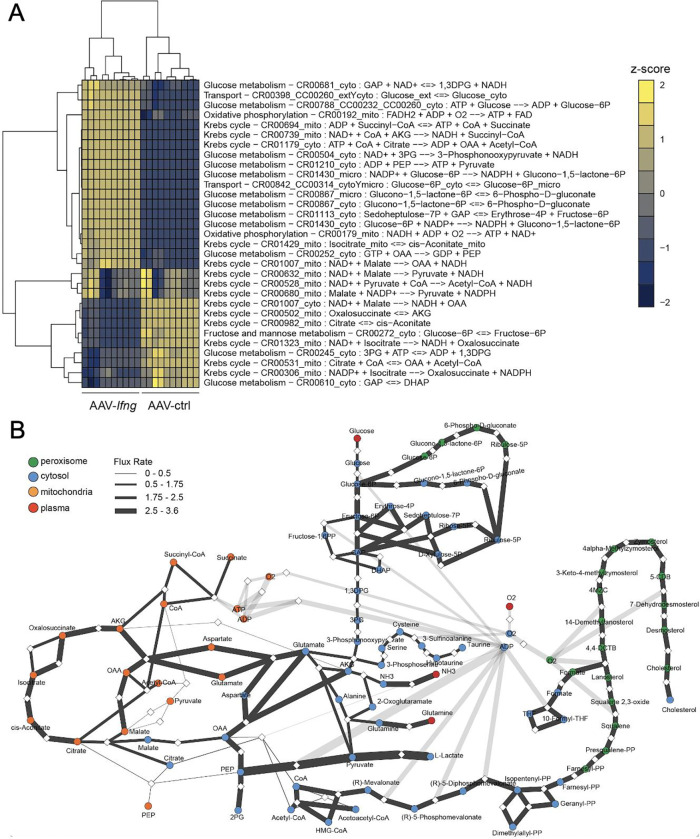
Results: After confirming liver-specific viral transfection and elevated serum IFN-γ production at physiological levels, we observed cardiac metabolic adaptation and rewiring in animals treated with AAV-Ifng compared to control animals. Myocardial bulk RNA sequencing and gene set enrichment analysis identified an IFN-γ response signature accompanied by marked down-regulations of oxidative phosphorylation and fatty acid oxidation pathways. Functional assessment of isolated cardiac mitochondria showed decreased oxygen consumption, and targeted metabolomics confirmed metabolic shifts toward glycolysis in mice overexpressing IFN-γ. In vivo imaging confirmed increased cardiac glucose uptake following AAV-Ifng treatment. Notably, these metabolic alterations were abrogated in mice with cardiomyocyte-specific deletion of IFN-γ receptors (IFNGR).

Conclusions: Systemic IFN-γ induces pronounced metabolic reprogramming in the heart, characterized by increased glucose uptake and reduced oxidative phosphorylation, via direct signaling through cardiomyocyte IFNGR. These alterations mirror those observed in aging and some forms of HF, thereby highlighting that, beyond classical inflammation, this cytokine regulates cardiac metabolism.

Keywords: T cells; cardiac metabolism; cardiomyocytes; interferon gamma; mitochondria.


Figures

Figure 1:
Figure 1:. Systemic IFN-γ expression induces myocardial alterations.
A: Schematic representation of the in vivo mouse model. B: Luciferase activity in liver, heart, lung, and skeletal muscles; relative Ifng expression in liver and heart of AAV-Ifng injected mice versus AAV-Nluc-injected control mice; and IFN-γ plasma concentration compared between the two groups and LCMV-injected mice. C: Western blot membrane showing p-STAT1 and β-actin in livers and hearts of the two groups (3 different mice per group). D: CD45+ cells / mg tissue analyzed via flow cytometry, comparing different organs from the two groups. E: Flow cytometry gating to distinguish granulocytes (CD45+ Cd11b+ Ly6G+), monocytes and macrophages (CD45+ Cd11b+ Ly6G), and T cells (CD45+ TCRβ+) with heat map quantifications of different cell populations in liver, heart, and lung, compared between the two groups. F: Representative Masson’s trichrome staining of heart and liver tissues from the two groups (3 different mice per group). G: Day 28 echocardiographic findings indicating EF (%), EDA (mm), and SV (μl). Statistical analysis using t-test. * Indicates significance with p value < 0.05. Graphs B, D, G are scatter plots presenting Mean ± SD.
Figure 2:
Figure 2:. IFN-γ causes transcriptional alterations in pathways linked to cardiac metabolism.
A: Dot blot showing significant gene set up- and down-regulation as obtained from bulk RNA sequencing data of hearts from the two groups. Color scale represents the normalized enrichment score, and circle size shows the false discovery rate (FDR). B: Gene set enrichment analysis of interferon gamma response and inflammatory response, with heat maps of z-scores for representative top genes, in the heart, among the two groups. C: Gene set enrichment analysis of oxidative phosphorylation, fatty acid oxidation, glycolysis, mitochondrial respiratory chain, and fatty acid β-oxidation with heat map of z-scores for representative top genes, in the heart, among the two groups. Blue denotes transcript down-regulation while red indicates up-regulation.
Figure 3:
Figure 3:. IFN-γ signaling causes cardiac metabolic reprogramming.
A: Principal component analysis of the cardiac metabolome of AAV-Ifng- and AAV-ctrl-injected mice (n=5 per group). B: Heatmap representing unsupervised hierarchical cluster analysis of the cardiac metabolite profile of each mouse. C: Lactate dehydrogenase enzyme activity quantification graph comparing the two groups, heatmap of z-scores for enzyme genes, pyruvate dehydrogenase enzyme activity quantification graph comparing the two groups, and heatmap of z-scores for enzyme genes. D: Quantification of oxygen consumption in both pyruvate malate (PM)- and palmitate (fatty acid, FA)- complex-dependent respiration in the absence (state 2) or presence of increasing ADP concentrations (state 3), and in response to the ATP synthase inhibitor oligomycin (state 4). Statistical analysis used t-test. * Indicates significance with p value < 0.05. Graphs C, D are scatterplots showing Mean ± SD. Heat maps of z-scores for representative top genes in the hearts of the two groups. Blue represents transcript shows down-regulation while red indicates up-regulation.
Figure 4:
Figure 4:. Metabolic flux modeling reveals pathways preferentially impacted by IFN-γ signaling.
A: Heatmap representing unsupervised hierarchical cluster analysis of flux balance analysis with an adjusted p-value<0.01. Experimental data from AAV-ctrl- and AAV-Ifng-injected mice was integrated into CardioNet simulations, and metabolic flux rates were calculated using an objective function demanding energy provision and biomass synthesis. Calculated flux rates were compared using a linear regression model and annotated to CardioNet pathways. B: Comparative metabolic flux analysis of AAV-ctrl- and AAV-Ifng-injected mice using CardioNet-based simulations. Network graph is constructed from flux balance solutions. Metabolites and enzymes are depicted as circles and diamonds, respectively. Reactions are assigned to cytosolic, mitochondrial, peroxisomal or extracellular metabolic fluxes. The thickness of each line connecting metabolites and proteins indicates the calculated flux rate in AAV-Ifng-injected mice compared to AAV-ctrl. Abbreviations: 4MZC, 4alpha-Methylzymosterol-4-carboxylate; 4,4-DCTB, 4,4-Dimethyl-5alpha-cholesta-8,14,24-trien-3beta-ol; 5-CDB, 5alpha-Cholesta-7,24-dien-3beta-ol.
Figure 5:
Figure 5:. PET imaging reveals glucose and fatty acid uptake in the heart.
A: Representative [18F]FDG glucose uptake PET images from the transverse plane in both AAV-ctrl- and AAV-Ifng-injected mice. B: Quantification of mean [18F]FDG glucose uptake heart/mediastinum ratio in AAV-Ifng-injected mice compared to controls. C: Linear regression correlation between IFN-γ serum level and [18F]FDG glucose uptake. D: Heatmap of z-scores for glucose transporter genes, in the heart, among the two groups. E: Quantification of [18F]FTHA biodistribution across different organs in AAV-Ifng-injected mice compared to controls, with (on right) heat maps of z-scores for fatty acid transporters in both heart and liver, comparing the two groups. * Indicates significance with p value < 0.05. Graphs A, B, C, D are scatterplots showing mean ± SD. Heat maps of z-scores for representative top genes, in the heart, among the two groups. Blue colour represents transcript down-regulation while red indicates up-regulation.
Figure 6:
Figure 6:. IFN-γ-induced cardiac metabolic rewiring is driven by direct effects in cardiomyocytes.
A: Immunofluorescence staining of heart sections from AAV-Ifng-injected mice: individual channels display phalloidin (green) for myocyte actin filaments, DAPI (blue) for nuclei, and p-STAT1 (red). The overlay on the right highlights p-STAT1 signals, with yellow arrows indicating localization in myocytes and white arrows indicating localization in non-myocytes. B: Schematic representation of the cardiomyocyte-specific IFNGR1 knock-out model. C: Dot blot showing significantly up- and down-regulated gene sets, as obtained from bulk RNA sequencing data of hearts from the two groups. Color scale represents normalized enrichment score, and circle size shows the false discovery rate (FDR). D: Gene set enrichment analysis of interferon gamma response and inflammatory response, with heat map of z-scores for representative top genes, in the heart, among the two groups. E: Gene set enrichment analysis of oxidative phosphorylation, fatty acid oxidation, and glycolysis, with heat map of z-scores for representative top genes, in the heart, among the two groups. Blue represents transcript down-regulation while red indicates up-regulation.

References

    1. Ait-Oufella H, Libby P, Tedgui A. Anticytokine Immune Therapy and Atherothrombotic Cardiovascular Risk. Arterioscler Thromb Vasc Biol. 2019;39:1510–1519. doi: 10.1161/atvbaha.119.311998 - DOI - PMC - PubMed
    1. Ridker PM, Everett BM, Thuren T, MacFadyen JG, Chang WH, Ballantyne C, Fonseca F, Nicolau J, Koenig W, Anker SD, et al. Antiinflammatory Therapy with Canakinumab for Atherosclerotic Disease. N Engl J Med. 2017;377:1119–1131. doi: 10.1056/NEJMoa1707914 - DOI - PubMed
    1. Everett BM, MacFadyen JG, Thuren T, Libby P, Glynn RJ, Ridker PM. Inhibition of Interleukin-1β and Reduction in Atherothrombotic Cardiovascular Events in the CANTOS Trial. J Am Coll Cardiol. 2020;76:1660–1670. doi: 10.1016/j.jacc.2020.08.011 - DOI - PubMed
    1. Alter C, Henseler AS, Owenier C, Hesse J, Ding Z, Lautwein T, Bahr J, Hayat S, Kramann R, Kostenis E, et al. IL-6 in the infarcted heart is preferentially formed by fibroblasts and modulated by purinergic signaling. J Clin Invest. 2023;133. doi: 10.1172/jci163799 - DOI
    1. Zhao TX, Sriranjan RS, Tuong ZK, Lu Y, Sage AP, Nus M, Hubsch A, Kaloyirou F, Vamvaka E, Helmy J, et al. Regulatory T-Cell Response to Low-Dose Interleukin-2 in Ischemic Heart Disease. NEJM Evid. 2022;1:EVIDoa2100009. doi: 10.1056/EVIDoa2100009 - DOI - PubMed

Publication types