[Preprint]. 2025 Sep 17:2025.09.02.673874.
doi: 10.1101/2025.09.02.673874.

Single-vessel transcriptome map pathological landscapes and reveal NR2F2-mediated smooth muscle cell phenotype acquisition in capillary malformations

Affiliations

Single-vessel transcriptome map pathological landscapes and reveal NR2F2-mediated smooth muscle cell phenotype acquisition in capillary malformations

Vi Nguyen et al. bioRxiv. .

Abstract

Background: Capillary malformation (CM) is a congenital vascular anomaly affecting the skin, mucosa, and brain, yet the understanding of its vascular pathogenesis remains limited.

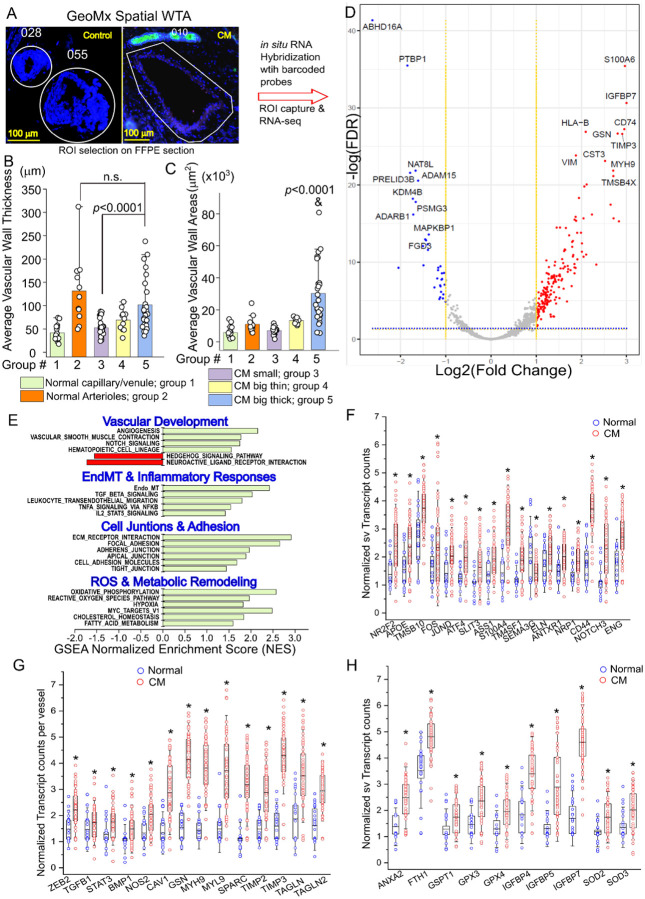
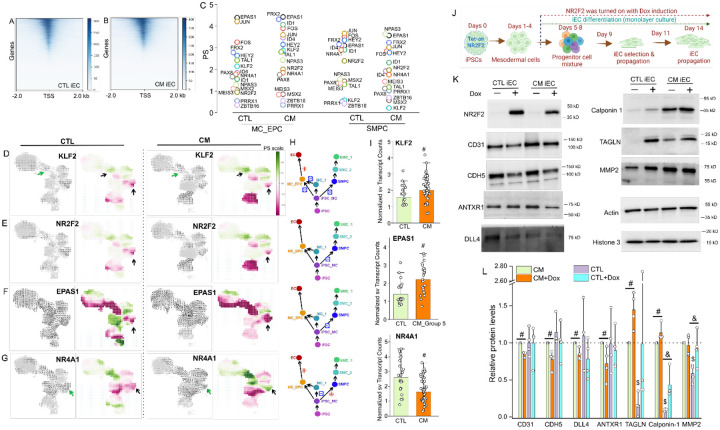
Methods: We applied spatial whole-transcriptome profiling (GeoMx) and gene set enrichment analysis within CM lesions at single vasculature level. Differentially expressed genes were validated by immunofluorescence staining. Phosphoproteomics was profiled to uncover lesion-wide phosphorylation sites on proteins. Single-cell RNA sequencing was performed on CM-derived induced pluripotent stem cells (iPSCs) to determine differentiation trajectories of lesional vascular lineages. In silico gene perturbation was used to predict candidate genes for modulating vascular pathological progression, followed by functional validation in CM iPSC-derived endothelial cells (ECs) using a Tet-on system.

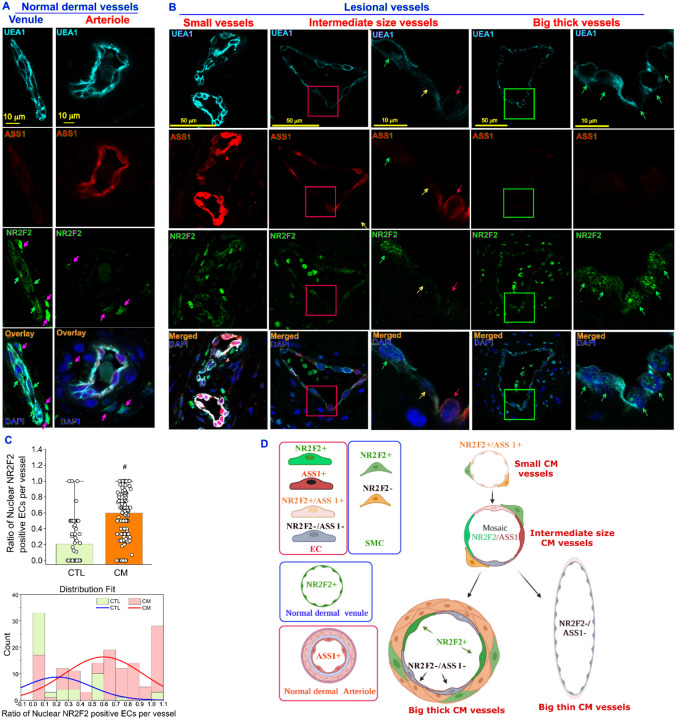
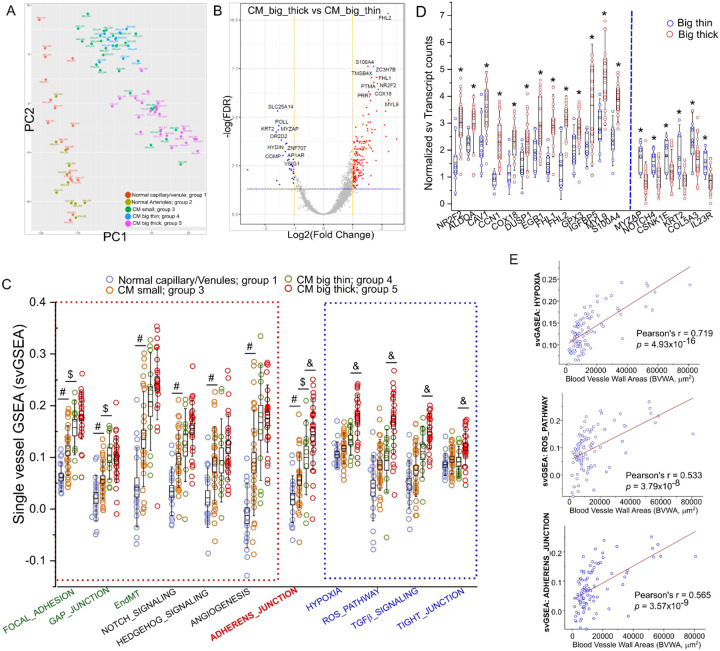
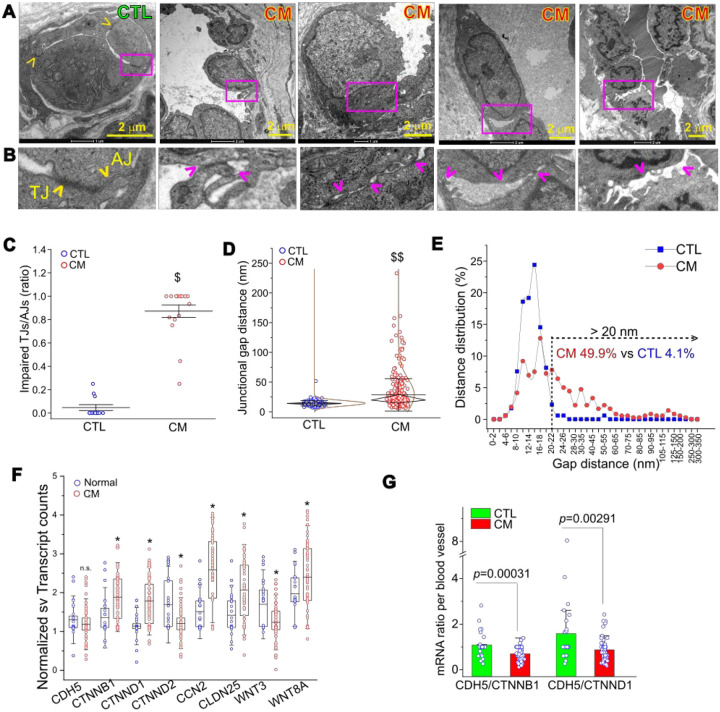
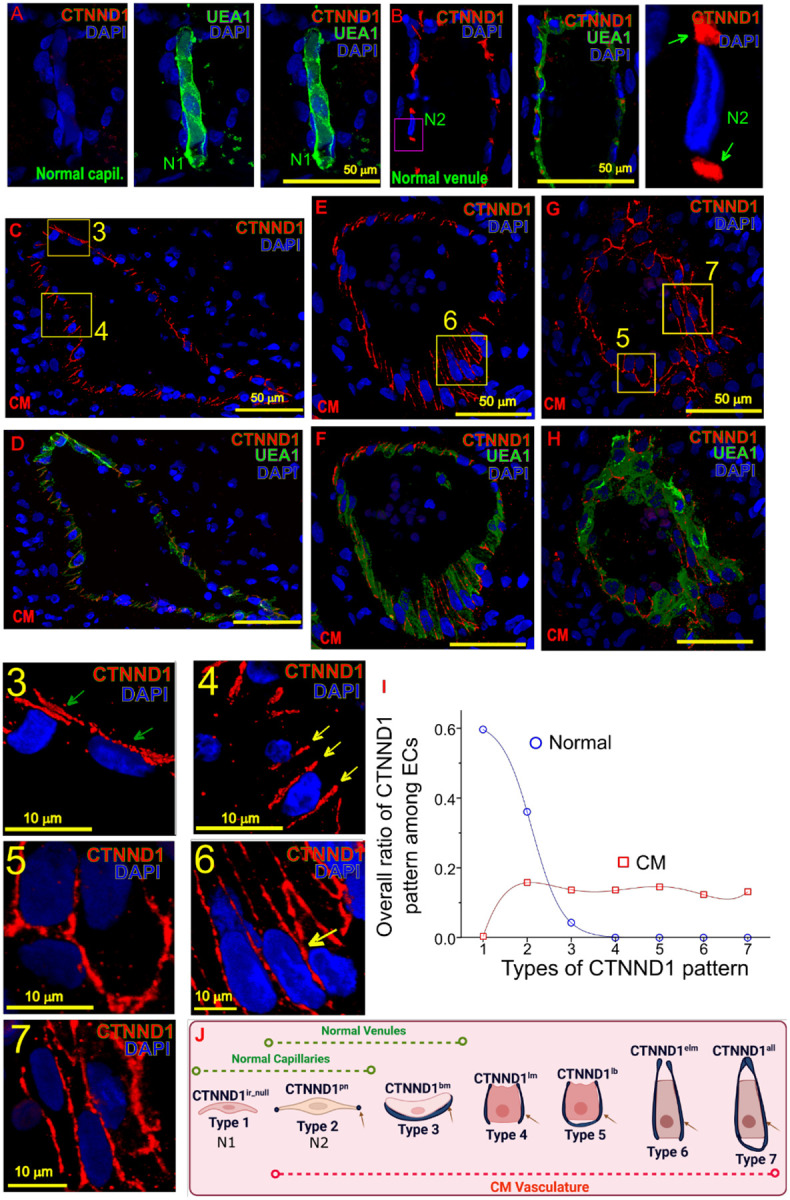
Results: A spatial transcriptomic atlas was constructed, and pathological landscape of individual CM vasculature was delineated. CM vessels exhibited hallmarks of endothelial-to-mesenchymal transition (EndMT), including disruption of adherens junctions (AJs), vascular identity transitions, and metabolic remodeling. Phosphoproteomics confirmed that differentially phosphorylated proteins were enriched in EndMT- and AJ-related pathways. Aberrant expression of venous transcriptional factor NR2F2 was observed in lesional ECs and correlated with progressive enlargement from capillaries to larger-caliber vessels containing multiple layers of smooth muscle cells (SMCs). In CM iPSCs, differentiation course yielded reduced ECs but increased SMCs. In silico knockout simulation predicted NR2F2 as a crucial regulator of facilitating SMC phenotype in CM. Consistently, enforced NR2F2 expression during iPSC differentiation suppressed endothelial markers while inducing SMC-associated genes.

Conclusions: Single CM vasculature displays pathological hallmarks characterized by EndMT and AJ disruption, leading to progressive vascular remodeling. NR2F2 functions as a central regulatory factor orchestrating the acquisition of the SMC phenotype, thereby representing a potential therapeutic target in CM.

Keywords: Capillary malformation; NR2F2; adherens junctions; endothelial cells; endothelial-to-mesenchymal transition; induced pluripotent stem cells; whole transcriptome atlas.


Conflict of interest statement

Declaration of interests The authors declare no competing interests.

Figures

Figure 1
Figure 1. WTA profiles for CM vs normal vasculature:
A, Each ROI image contains a single blood vessel from FFPE sections in normal control skin or CM lesion for WTA profiling using a GeoMx platform; B-C, Morphological features of blood vessels in ROIs; The profiled vasculatures were categorized into five groups based on their average vascular wall thickness and wall areas; D, Volcano plot for DEGs from WTA profiles of CM vs normal control blood vessels; Red or blue dots in volcano plots: significantly up- or down-regulated DEGs, respectively (FDR < 0.05). E, Single vessel normalized enrichment score for GSEA (svNES_GSEA) showing the major dysregulated pathways in CM vs normal dermal vasculature; F-H, Representative DEG plots related to EC and EPC biomarkers (F), EndMT panel (G), and Hypoxia/ROS signaling (H). Each dot represents a single vessel. * FDR < 0.05.
Figure 2
Figure 2. Endothelial NR2F2 coincides with pathological progressions of CM vasculature.
A, venous driver NR2F2 (green) was found in nucleus of ECs in normal dermal venous, but dermal arterial biomarker ASS1 (red) was mainly present in arterial ECs in normal dermis. Some scattered SMCs showed strong nucleus NR2F2 IF signaling in both venous and arterioles (pink arrows). B, In small size CM vessels, the co-expression of ASS1 and NR2F2 were observed in many ECs. In intermediate size vessels, ECs in one vessel could show heterogenous patterns of NR2F2 (green arrows) positive, ASS1 (red arrows) positive, or negative for both biomarkers (yellow arrows). In big dilated and thick lesional vessels, NR2F2 but not ASS1 was found in the nucleus of many ECs. The 2nd panel of intermediate size or big size vessels is a high magnification of the box area of each image in the 1st panel, respectively. UEA1 (cyan) staining was used to show ECs. C, Quantitative analysis and distribution fit of the ratio of nuclear NR2F2 positive ECs per vessel in normal skin as compared to CM. #, p < 0.0001. D, the dynamics and transition patterns of nuclear NR2F2 in ECs coincides with progressive enlargement of lesional vasculature.
Figure 3:
Figure 3:. WTA profile comparison of big thick versus big thin CM vessels.
A, PCA plot showing sample distances among all profiled blood vessels in ROIs from groups 1–5. B, Volcano plot for DEGs from WTA profiles of big thick versus big thin CM vessels; Red or blue dots in volcano plots: significantly up- or down-regulated DEGs, respectively (FDR < 0.05); C, Scattered plot showing svNES_GSEA for main pathways among groups; # group 3 vs group 1 with FDR < 0.05; $ group 4 vs group 3 with FDR < 0.05; & group 5 vs group 4 with FDR < 0.05; D, Representative DEGs of WTA profile comparison of big thick versus big thin CM vessels. * FDR < 0.05. E, Pearson correlation between BVWA and svNES_GSEA of hypoxia, ROS, and AJ pathways, respectively. Each dot in panels C-E represents DEG or GSEA from a single vessel.
Figure 4:
Figure 4:. Impairments of AJs in CM vasculature.
A, TEM showing the AJs among ECs from a normal dermal capillary and various types of fragmented and tortuous AJs among CM ECs with enlarged junctional spaces. B, The magnified box area from upper panel in (A) respectively. Yellow arrowhead: normal TJ and AJ; Pink arrowhead: impaired AJs. C, The ratio of impaired TJs and AJs over normal ones among control or CM vessels. Each dot represents one subject or patient. $ p<0.0001. D, Junctional gap distances in AJs from normal and CM vessels. $$ p<0.0001. E, The distribution of gap distances in AJs from normal vessels as compared to CM vessels. F, Scattered plot showing the normalized transcript counts of AJ-related genes in CM as compared to normal vessels. Data was from GeoMx WTA profile. n.s., no significance for CDH5; * FDR < 0.05. G, mRNA ratio of CDH5/CTNNB1 or CDH5/CTNND1 per blood vessel in control as compared to CM lesions.
Figure 5:
Figure 5:. CM ECs with heterogenous CTNND1 patterns reflecting dynamics of EC phenotype remodeling.
A and B, Normal human dermal capillary ECs had either barely detectable CTNND1 (red) IF signals (A, normal type 1, N1) or puncta CTNND1 (CTNND1pn) (B, normal type 2, N2) between normal venous ECs. The right panel showing a high magnification of the red box area of N2; C-H, CM ECs represent various patterns of CTNND1 among lesional blood vessels. Numbered boxed areas in (C), (E), and (G) are magnified and shown in the individual panels with the same number, presenting heterogenous types of CTNND1 patterns. UEA1 (green) staining was used to show the morphologies of vasculature in (D, F, and H). Z-stacks confocal images were processed for CTNND1 subcellular patterns. I, Overall ratios of various CTNND1 patterns among ECs in normal dermal and CM blood vessels. J, Predicted trajectory of endothelial CTNND1 patterns that reflects the diversity and dynamics of CM EC remodeling during disease progression.
Figure 6:
Figure 6:. CM ECs undergoing EndMT hallmarks and phosphoproteomics profiles in CM lesions.
A, A normal human dermal vessel exhibits distinct aSMA (red) signals in juxtaposition to ECs showing by UEA1 (cyan) or CD31 (green); B, A CM lesional vessel develops an EndMT zone (red box 1) containing remodeled ECs (white arrows). Those ECs have acquired phenotypes of SMCs, e.g., expressing aSMA and showing cuboidal shapes. In (B), lower panels are a high magnification of the red box areas (box 1) in upper panels. DAPI: blue. C, ECs in active EndMT zones presenting various endothelial CTNND1 patterns in a CM vessel. Lower small panels 2 and 3 are a high magnification of the boxed areas with the same number in the upper panel showing endothelial CTNND1lb (yellow box 2) and CTNND1all (purple box 3, multiple layers of ECs) patterns. White arrowhead: the colocation of UEA1 (cyan), CTNND1 (green), and SMA (red). D, Heatmap data showing representative DEPs in CM lesions as compared to normal skin; E, Significantly enriched pathways involving DEPs’ functions; F, Scattered plot showing DEPs of junctional related proteins including CTNND1 at S346, S352, and S230 sites in CM lesions vs normal controls (n=5 subjects); G, Scattered plot for some representative DEPs related Rho GTPases and endothelial functions.
Figure 7:
Figure 7:. Differentiation impairments of CM iPSC to vascular lineages.
A, Schematic of normal or CM iPSCs differentiation to iECs. Samples were collected on days 0, 4, 8, and 15 for scRNA-seq analysis. B and C, UMAP showing the distributions of cell cultures among sampling times and cell types. D, Dot plot showing biomarkers for different clusters of cell types. E, Pseudotime analysis showing differential trajectories of EC and SMC lineages. F and G, Pseudotime analysis showing a differential stall of EC lineage in CM as compared to normal iPSCs with an increased MC_1 subpopulation but increased EC subset. H and I, Pseudotime analysis showing a differential enhancement of SMC lineage in CM as compared to normal iPSCs with increased SMC_2 and SMC_1 subsets. J, Schematic of differential trajectories and impaired paths in CMs.
Fig 8:
Fig 8:. In silico gene perturbation and forced expression of NR2F2 promoting EndMT.
A and B, Heatmaps showing enrichment at transcription start site (TSS) for the ATAC-seq profiles of normal (A) and CM iECs (B). GRN models were constructed from peaks files of ATAC-seq data. C, perturbation scores of representative TFs among GeoMx DEGs showing their impacts on cell identity shifts in clusters of MC_EPC and SMPC in CM and CTL through KO simulation. D-G, CellOracle simulation of cell-state transition in Klf2 (D), Nr2f2 (E), Epas1 (F), and Nr4a1 (G) KO simulation in CTL and CM. Summarized simulation vector field and the perturbation scores were shown, respectively. PS scale, green color indicates differentiation promoted; red color, differentiation suppressed with specific TF KO simulation. H, Schematic of impact on perturbative shifts for iEC or iSMC lineages with each specific TF KO simulation in CM and CTL. I, Single vessel GeoMx profile of specific TFs in CM as compared to CTL. #, FDR < 0.05. J, Schematic of normal or CM iPSCs with integration of a Tet-on system to induce over-expression of NR2F2 with Doxycycline (Dox). Dox was added on day 5 to day 14 during iEC differentiation stages. K, Forced expression of NR2F2 at the stages from EPCs to iECs could cause reductions of EC biomarkers such as CD31, CDH5, DLL4, ANTXR1, and increases in EndMT biomarkers such as TAGLN, Calponin 1, and MMP2 in iECs. L, Relative protein levels of selective EndMT biomarkers. The basal level of each protein in CM iECs is set as 1 (dashed line). #, p<0.05 Dox versus mock in CM iECs; &, p<0.05 Dox versus mock in CTL iECs; $, p<0.05 basal level in CM versus CTL iECs. N=4 independent experiments. The average of normalizations to two housekeeping proteins β-actin and histone 3 is set as relative protein level.

References

    1. Eifert S, Villavicencio JL, Kao TC, Taute BM, Rich NM. Prevalence of deep venous anomalies in congenital vascular malformations of venous predominance. J Vasc Surg. 2000;31:462–471. - PubMed
    1. ISSVA. ISSVA Classification of Vascular Anomalies. International Society for the Study of Vascular Anomalies 2018;issva.org/classification.
    1. Lever WF, Schaumburg-Lever G. Histopathology of the Skin. 7th ed. Philadelphia, PA: J.B. Lippincott Co.; 1990.
    1. Waelchli R, Aylett SE, Robinson K, Chong WK, Martinez AE, Kinsler VA. New vascular classification of port-wine stains: improving prediction of Sturge-Weber risk. Br J Dermatol. 2014;171:861–867. doi: 10.1111/bjd.13203 - DOI - PMC - PubMed
    1. Gao C, Nguyen V, Hochman ML, Gao L, Chen EH, Friedman HI, Nelson JS, Tan W. Current clinical evidence is insufficient to support HMME-PDT as the first choice of treatment for young children with port wine birthmarks. Lasers Surg Med. 2024;56:321–333. doi: 10.1002/lsm.23779 - DOI - PMC - PubMed

Publication types

LinkOut - more resources