[Preprint]. 2025 Sep 4:2025.09.02.25334923.
doi: 10.1101/2025.09.02.25334923.

Systematic analysis of snRNA genes reveals frequent RNU2-2 variants in dominant and recessive developmental and epileptic encephalopathies

Elsa Leitão  1 Amandine Santini  2 Benjamin Cogne  3   4   5 Myriam Essid  6   7   8   9 Maria Athanasiadou  10   11 Christy W LaFlamme  12   13 Pierre Marijon  5 Virginie Bernard  8 Nicolas Chatron  6   7   8 Giulia Barcia  14   15   5   9 Boris Keren  16   5 Cyril Mignot  16   17 Perrine Charles  16 Thomas Besnard  3   4 Jean-Madeleine de Sainte Agathe  16   5 Edith P Almanza Fuerte  12 Soham Sengupta  12 Mathieu Milh  18   19 Francis Ramond  20 Talia Allan  21 Isabelle An  22 Camila Araujo  23 Stephanie Arpin  24 Christina Austin-Tse  25 Stéphane Auvin  26   27   9 Sarah Baer  28   9 Nadia Bahi-Buisson  15 Mads Bak  29 Magalie Barth  30   31 Stéphanie Baulac  32 Nathalie Bednark Weirauch  33   34   35 Matthias Begemann  36 Mark F Bennett  21   37   38 Uriel Bensabath  16 Stéphane Bézieau  3   4 Rakia Bhouri  39 Margaux Biehler  40 Trine Bjørg Hammer  29   41 Julie Bogoin  16 Emilie Bonanno  16 Simon Boussion  42 Nuria C Bramswig  43 Céline Bris  30   31 Adelaide Brosseau-Beauvir  44 Ange-Line Bruel  45 Julien Buratti  16 Pascal Chambon  2   5 Nicole Chemaly  15   46   9 Bertrand Chesneau  47 Estelle Colin  30   31 Maxime Colmard  48 Solène Conrad  3 Thomas Courtin  14   15 Louis T Dang  49 Anne de Saint Martin  28   9 Caroline de Vanssay de Blavous Legendre  50 Anne-Sophie Denommé-Pichon  45 Stephanie DiTroia  25 Martine Doco-Fenzy  51   34   3 Christèle Dubourg  52   53   5 Charlotte Dubucs  54 Stéphanie Ducreux  14   5 Louis Dufour  26 Romain Duquet  16 Benjamin Durand  55 Salima El Chehadeh  55 Miriam Elbracht  36 Laurence Faivre  56 Marie Faoucher  52   53   5   8 Anne Faudet  16 Sylvie Forlani  32 Mélanie Fradin  57 Pauline Gaignard  58   5 Benjamin Ganne  59 Aurore Garde  60 Justine Géraud  61 Deepak Gill  62   63   64 Alice Goldenberg  2 David Grabli  32   22 Coraline Grisel  65 Sophie Gueden  66 Paul Gueguen  24   67   5 Anne-Marie Guerrot  2 Agnès Guichet  30   31 Nina Härting  1 Martin Georg Häusler  68 Solveig Heide  16 Bénédicte Héron  69 Delphine Héron  16   17 Mathilde Heulin  70 Clara Houdayer  30   31 Bertrand Isidor  3 Aurélia Jacquette  71 Louis Januel  6   8 Nolwenn Jean-Marçais  57 Kevin Jousselin  5 Frank J Kaiser  1 Sabine Kaya  1 Chontelle King  72 Marina Konyukh  73   5 Florian Kraft  36 Jeremias Krause  36 Rémi Kirstetter  14   15 Alma Kuechler  1 Ingo Kurth  36 Audrey Labalme  6 Jean-Serene Laloy  14 Vincent Laugel  28 Floriane Le Bricquir  74 Anne-Sophie Lèbre  75   34   76 Marine Lebrun  20   8 Eric Leguern  32   16 Jonathan Levy  26   5 Nico Lieffering  72 Stanislas Lyonnet  14   15 Kevin Lüthy  1 Sian Macdonald  21 Lamisse Mansour-Hendili  5 Julien Maraval  56 Carolin Mattausch  1 Olfa Messaoud  25   77   78   79 Godelieve Morel  80 Jérémie Mortreux  8 Arnold Munnich  15 Rima Nabbout  15   46   9 Sophie Nambot  60 Vincent Navarro  22   32 Ashana Neale  25 Laetitia Nguyen  16 Mathilde Nizon  3 Frédérique Nowak  81 Melanie C O'Leary  25 Sylvie Odent  57   53 Naomi Meave Ojeda  82   83 Valerie Olin  16 Katrin Õunap  84   85 Lynn S Pais  25 Robin Paluch  1 Eleni Panagiotakaki  86   9 Olivier Patat  47 Laurence Perrin-Sabourin  26 Florence Petit  42 Christophe Philippe  87   8 Amélie Piton  40   88   8 Marc Planes  89 Céline Poirsier  51 Antoine Pouzet  26 Clément Prouteau  30   31 Sylvia Quéméner-Redon  89   44   90 Mathilde Renaud  91 Anne-Claire Richard  2 Marlène Rio  14   15 Clotilde Rivier  92 Florence Robin-Renaldo  69 Paul Rollier  57   53 Massimiliano Rossi  6 Agathe Roubertie  48   93 Mailys Rupin  66 Pascale Saugier-Veber  2   5 Russell Saneto  94 Elisabeth Sarrazin  95 Elise Schaefer  55 Caroline Schluth-Bolard  40   96   8 Amy Schneider  21 Isabell Schumann  43   97 Vladimir Seplyarskiy  98   99 Thomas Smol  42   5 Shamil Sunyaev  98   99 Brian Sperelakis-Beedham  15   14   5 Sarah L Stenton  25   78 Friedrich Stock  1 Mylene Tharreau  100 Deniz Torun  101 Joseph Toulouse  86   9 Harshini Thiyagarajah  21 Stéphanie Valence  69 Sophie Valleix  102 Laurent Villard  103   19 Dorothée Ville  104 Nathalie Villeneuve  18   9 Antonio Vitobello  45   8 Aurélie Waernessyckle  16 Yvonne Weber  105 Dagmar Wieczorek  106 Tom Witkowski  21 Manya Yadavilli  82   83 Tony Yammine  75 Khaoula Zaafrane-Khachnaoui  107 Maha S Zaki  108 Alban Ziegler  51   47   8 Alban Lermine  5 Gael Nicolas  2   5 Joseph G Gleeson  82   83 Lynette G Sadleir  72 Michael S Hildebrand  21   109 Ingrid E Scheffer  21   110   111 Nicola Whiffin  112   113   25 Anne O'Donnell-Luria  25   78   79 Heather C Mefford  12 Pierre Blanc  5 Julien Thevenon  114   115   8 Camille Charbonnier  116 Clément Charenton  10   11 Christel Depienne  1   5 Gaetan Lesca  6   7   8   9 Caroline Nava  32   16   5
Affiliations

Systematic analysis of snRNA genes reveals frequent RNU2-2 variants in dominant and recessive developmental and epileptic encephalopathies

Elsa Leitão et al. medRxiv. .

Abstract

Variants in spliceosomal small nuclear RNA (snRNA) genes RNU4-2 (ReNU syndrome), RNU5B-1, and RNU2-2 have recently been linked to dominant neurodevelopmental disorders (NDDs), revealing a major, previously overlooked role for noncoding snRNAs in human disease. Here, we systematically analysed 200 potentially functional snRNA genes in a French cohort comprising 26,911 individuals with rare disorders and through international collaborations. We identify de novo and biallelic variants in RNU2-2 associated with both dominant and recessive NDDs in 126 individuals from 108 unrelated families. Recessive RNU2-2 NDD is at least twice as frequent as the dominant NDD caused by n.4G>A and n.35A>G, and often arises from a de novo variant in trans with an inherited allele, reflecting the high mutability of snRNA genes. Dominant and recessive RNU2-2-NDDs share overlapping clinical features with frequent epilepsy. Blood transcriptomics and DNA methylation analyses revealed subtle, variant-specific effects on splicing and episignatures. Our findings support a gradient-of-impact model and a continuum between dominant and recessive inheritance, establishing RNU2-2 variants as a frequent cause of NDDs, nearly as prevalent as ReNU syndrome.


Conflict of interest statement

N.W. receives research funding from Novo Nordisk and Biomarin Pharmaceutical. L.T.D. receives research funding from Stoke Therapeutics. L.G.S. receives funding from the Health Research Council of New Zealand and Cure Kids New Zealand. She has served as a paid consultant of the Epilepsy Study Consortium for consulting work for Epygenix Therapeutics, Ovid Therapeutics, Stoke Therapeutics, Takeda Pharmaceuticals, UCB, and Zogenix. L.G.S. has received research grants and consultancy fees from Zynerba Pharmaceuticals and has served on Takeda and Eisai Pharmaceuticals scientific advisory panels. I.E.S. has served on scientific advisory boards for CAMP4 Therapeutics, Longboard Pharmaceuticals, Mosaica Therapeutics, Takeda Pharmaceuticals, UCB; has received speaker honoraria from Akumentis, Biocodex, Chiesi, Stoke Therapeutics, UCB, Zuellig Pharma; has received funding for travel from Stoke Therapeutics and UCB; has served as an investigator for Anavex Life Sciences, Biohaven Ltd, Bright Minds Biosciences, Cerebral Therapeutics, Cerecin Inc, Cereval Therapeutics, Encoded Therapeutics, EpiMinder Inc, ES-Therapeutics, Longboard Pharmaceuticals, Marinus, Neuren Pharmaceuticals, Neurocrine BioSciences, Praxis Precision Medicines, Shanghai Zhimeng Biopharma, SK Life Science, Supernus Pharmaceuticals, Takeda Pharmaceuticals, UCB, Ultragenyx, Xenon Pharmaceuticals, Zogenix; and has consulted for Biohaven Pharmaceuticals, Eisai, Epilepsy Consortium, Longboard Pharmaceuticals, Praxis, Stoke Therapeutics, UCB; and is a Non-Executive Director of Bellberry Ltd and a Director of the Australian Academy of Health and Medical Sciences. She may accrue future revenue on pending patent WO61/010176 (filed: 2008): Therapeutic Compound; has a patent for SCN1A testing held by Bionomics Inc and licensed to various diagnostic companies; has a patent molecular diagnostic/theranostic target for benign familial infantile epilepsy (BFIE) [PRRT2] 2011904493 & 2012900190 and PCT/AU2012/001321 (TECH ID:2012-009). All other authors declare no competing interests.

Figures

Extended Data Fig.1.
Extended Data Fig.1.. Distribution of variants across 200 putatively functional genes in the PFMG cohort.
Supplementary Fig. 1 shows the same distribution in the SeqOIA and Auragen subcohorts separately.
Extended Data Fig. 2.
Extended Data Fig. 2.. Variant allele fraction (VAF) distributions of snRNA variants in the aggregated PFMG cohort.
a, VAF distribution of de novo variants in snRNA genes with coverage ≥10. b, VAF distribution of biallelic variants in snRNA genes with coverage ≥10. c, Detailed VAF distribution for snRNA genes harbouring variants in the PFMG cohort. Supplementary Fig. 2 shows the same data in the seqOIA and Auragen subcohorts separately.
Extended Data Fig. 3.
Extended Data Fig. 3.. gnomAD allele count (AC) distribution of snRNA variants in the aggregated PFMG cohort.
a, De novo variants with coverage ≥10. b and c, Biallelic variants with coverage ≥10 altogether (b) or stratified according to their inheritance (c). Supplementary Fig. 3 shows the same data in the SeqOIA and Auragen subcohorts separately.
Extended Data Fig.4.
Extended Data Fig.4.. Circos plot depicting preferential associations of biallelic variants.
This scheme suggests that, in affected individuals with compound heterozygote variants, variants preferentially co-occur with one affecting the 5′ domain and the other the 3′ domain, suggesting domain-specific combinatorial effects. Variant colouring is the same as in Fig. 3a.
Extended Data Fig.5.
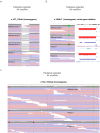
Extended Data Fig.5.. Examples of biallelic variants identified by genome sequencing in the PFMG cohort.
a, Integrative Genomics Viewer (IGV) screenshots of BAM file alignments showing segregation of the RNU2–2 n.127_118del variant in the homozygous state in three affected siblings, with both parents carrying the variant in heterozygous state. b, Left: IGV screenshot displaying the hemizygous RNU2–2 n.149A>T variant in two affected siblings and their heterozygous parent. Right: Copy-number analysis of genome sequencing data revealing a 642 kb deletion (hg38: chr11:62,781,800–63,424,493) encompassing RNU2–2 and 31 additional genes, present in the two affected siblings and the other parent. c, IGV screenshot showing the presence of the RNU2–2 n.142_153dup variant in homozygous state in the affected child and in heterozygous state in both parents.
Extended Data Fig. 6.
Extended Data Fig. 6.. Principal component analysis and classification performance of the RNU2–2 episignature.
a, Hierarchical clustering of the clinical features (n=58, rows) of patients with de novo dominant or biallelic RNU2–2 variants (n=74, columns). Categorical data was converted to 0–1 scale, and values were Z-score scaled for each row. Blue-yellow-red scale depicts Z-scores. Lower values indicate a more favourable phenotype, while higher values represent a more severe phenotype. Missing values are shown in grey. Columns are coloured based on the variant classification: dark blue: de novo, dominant (n.4G>A or n.34A>G); light blue: de novo other (VUS); orange: compound, recessive; purple: homozygous, recessive. b, Principal component analysis of clinical features in RNU2–2 variant carriers. Missing values were imputed as 0. Variant colouring is the same as in Ext Fig. 6a.
Extended Data Fig. 7.
Extended Data Fig. 7.. Principal component analysis and classification performance of the RNU2–2 episignature.
In all panels, controls are shown in green, dominant n.4G>A carriers in red, dominant n.35A>G carriers in orange, and recessive biallelic cases in blue. a, PCA of adjusted methylation levels at differentially methylated positions (n=201) up to component 6, after correction for expected baseline methylation level based on age at sampling, sex and estimated blood cell counts (n=92 individuals in total) showing separation of dominant n.4G>A carriers from normal controls on axis 1, and the weaker separation between dominant n.35A>G carriers or recessive biallelic cases from normal controls along axis 6. The percentage of variance explained is provided for each component within the axis title. b, PCA of adjusted methylation levels at differentially methylated positions (n=201), after correction for expected baseline methylation level based on age at sampling, sex and estimated blood cell counts on the restriction to normal controls and carriers of the dominant n.35A>G variant along the first two principal components (n=74 individuals in total). The percentage of variance explained is provided for each axis. c, PCA of adjusted methylation levels at differentially methylated positions (n=201), after correction for expected baseline methylation level based on age at sampling, sex and estimated blood cell counts on the restriction to normal controls and carriers of recessive biallelic variants along the first two principal components (n=78 individuals in total). The percentage of variance explained is provided for each axis. d, Predicted probabilities from a three-block cross-validation using a four-class SVM classifier (control, dominant n.4G>A, dominant n.35A>G, recessive biallelic).
Fig. 1.
Fig. 1.. Systematic in silico analysis of possible functional snRNAs.
a, Filtering strategy used to retain genes encoding possible functional snRNAs. b, and c, Number and distribution of annotated spliceosomal snRNAs before (b) and after (c) filtering. d, Expression of snRNAs in the human brain from ENCODE small RNA-seq data. Upper panel: all mapped reads (including multi-mapped). Lower panel: uniquely mapped reads. Expression is shown as log10 of the maximum normalized RNA-seq signal. Colours indicate the proportion of the snRNA length covered by mapped reads: 100% (purple), 75–99% (dark blue), 50–74% (green), <50% (yellow).
Fig. 2.
Fig. 2.. Identification of potential novel snRNA gene–disease associations in the PFMG cohort.
The cohort was divided into solved (n=8,343) and unsolved (n=18,568) cases for discovery analyses, with cases solved by variants in snRNAs with known disease association merged into the unsolved group. We compared the proportion of cases with rare variants (gnomAD allele count < 100) between solved and unsolved groups for rare de novo variants (a) and rare biallelic variants (b). Fisher’s test was used to test statistical enrichment in unsolved versus solved cases for genes in which at least 10 patients had variants (minimum number needed to reach statistical significance in the cohort). P-values are shown above the bars.
Fig. 3.
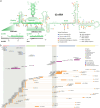
Fig. 3.. Overview of RNU2–2 variants identified in this study.
a, Two-dimensional predicted structure of U2–2 snRNA showing structural and functional domains. Arrow heads indicate point variants identified in this study. Variants are coloured according to their inheritance: dark blue: de novo, dominant (n.4G>A or n.34A>G); light blue: de novo other (VUS); orange: compound, recessive; purple: homozygous, recessive. The numbers in black represent the count of patients with each variant, for variants identified in more than one family. Other variant types are shown with dotted (deletions), dashed (duplications) or dotted-dashed (indels) lines. The nucleotide differences between RNU2–2 and RNU2–1 are shown using IUPAC codes. Green numbers refer to the numbering of U2–2 nucleotides. Ψ: pseudouridine, m: 2’-O-methyl residues; m6: N6-methyladenosine; 2,2,7m3Gppp: 2,2,7-trimethylguanosine cap. Green-shaded regions: functional domains of U2 involved in spliceosomal activity: U2/U6 helix II (nt 1–13); branch-point-interacting stem loop (BSL; nt 25–45); and U2/BS branch helix (nt 32–44). Grey-shaded region: Sm site. b, Locations of RNU2–2 variants on linear (unfolded) U2–2 snRNA, showing clustering of variants in the U2/U6 helix, BSL regions, and Sm site (grey-shaded), as well as preferential associations of compound heterozygous variants. Variants are ordered by inheritance mode and by the position of the first variant on the snRNA. Variant colouring is the same as in Fig. 3a.
Fig. 4.
Fig. 4.. Variant segregation and facial features associated with RNU2–2 variants.
(Retracted for Med Rxiv submission)
Fig. 5
Fig. 5. Possible functional impact of RNU2–2 variants.
Overview of RNU2–2 variants identified in this study. a, Two-dimensional structure of the U2 small nuclear RNA (green). Orange boxes indicate variants from this study, with point mutations and single nucleotide insertions represented on the graph along with their respective changes. 2,2,7m3Gppp: 2,2,7-trimethylguanosine cap, Ψ: pseudouridine, m: 2’-O-methyl residues. b, Zoom-in box representing the two-dimensional predicted structure of the U2 (green) and U6 (red) small nuclear RNAs (snRNAs) U2/U6 helix II during formation of precatalytic spliceosome. Interactions stabilizing these structures as well as mutations potentially affecting their stability are represented (PDB 5XJC). Shaded region: Lsm/Sm protein binding site of U6 snRNA. c, Zoom-in box representing the two-dimensional predicted structure of U2/U6 helixes Ia and Ib. Nucleotides involved in the structure and associated with pathological variants are represented (PDB 5XJC). d, Close-up of U2/BS branch helix where the two-dimensional predicted structure of the interaction between branch point recognition region of U2 snRNA and the intronic branch site (light brown) is represented. The branch point adenosine is highlighted in purple. ‘YNYURAY’: consensus of branch site in metazoans. The mutations related with this region are depicted on the structure (PDB 5XJC). e, Zoom-in box representing the two-dimensional predicted structure of 17S U2 snRNA and the branch point interacting stem loop (BSL) is highlighted. In blue the adenine at position 30 that interacts with the cytosine (purple) at position 40 linked to two reported variants. In black the nucleotides involved directly on the U2/BS formation. The structure of 17S U2 snRNAs’ BSL structure is represented (PDB 7Q3L). f, Close-up of the U2 snRNA Sm ring (light green) where the nucleotides with the mutations close to or within it are marked in orange (PDB 5XJC).
Fig. 6.
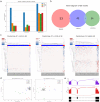
Fig. 6.. Variant-specific alternative splicing perturbations in RNU2–2 variant carriers.
a, Number of significant alternative splicing events (ΔPSI > 0.05) detected using rMATS and linear regression (p-val<0.01), comparing RNU2–2 individuals (dominant: n.4G>A, n=5; n.35A>G, n=5; recessive: n=4) to 49 controls. Splicing categories are colour-coded: exon skipping (SE, blue), alternative 5′ splice sites (A5SS, orange), alternative 3′ splice sites (A3SS, green), and intron retention (RI, red). b, Venn diagram showing minimal overlap of exon skipping events shared among dominant (n.4G>A, n.35A>G) and recessive (biallelic) variant groups. c, Clustermaps of alternative splicing events for individuals carrying n.4G>A (left, n=5), n.35A>G (middle, n=5), and biallelic variants (right, n=4). d, Principal component analysis based on residuals of PSI values after linear regression showing separation of controls (grey, n=49) from individuals with n.4G>A (n=5, blue), n.35A>G (n=5, green), and biallelic variants (n=4, red). Right panel: PC1 vs. PC2; left panel: PC3 vs. PC4. e, Sashimi plots illustrating an exon-skipping isoform shift in ACLY observed in RNU2–2 variant carriers compared to controls.
Fig. 7.
Fig. 7.. Methylation profiles across differentially methylated probes in RNU2–2 variant carriers and normal controls.
In all panels, controls are shown in green, dominant n.4G>A carriers in red, dominant n.35A>G carriers in orange, and recessive biallelic cases in blue. A, Heatmap of adjusted methylation levels at differentially methylated CpGs. Selected probes are represented in rows while patients and normal controls are represented in columns after hierarchical clustering of their methylation profiles. Probes are grouped according to their association pattern: probes common to all variants, probes specific to n.35A>G, probes specific to biallelic recessive variants, and probes specific to n.4G>A. Samples are annotated by type (Control, Dominant n.4G>A, Dominant n.35A>G, Recessive biallelic) but sample clustering was unsupervised and blind to this classification. b, Raincloud plots showing the average methylation level per sample within each probe association pattern. Normal controls and variant carriers display significantly different distributions, with p-values from two-sided Wilcoxon rank-sum tests indicated above the plots.

References

    1. Wilkinson M.E., Charenton C. & Nagai K. RNA Splicing by the Spliceosome. Annu Rev Biochem 89, 359–388 (2020). - PubMed
    1. Charenton C., Wilkinson M.E. & Nagai K. Mechanism of 5’ splice site transfer for human spliceosome activation. Science 364, 362–367 (2019). - PMC - PubMed
    1. Guiro J. & O’Reilly D. Insights into the U1 small nuclear ribonucleoprotein complex superfamily. Wiley Interdiscip Rev RNA 6, 79–92 (2015). - PubMed
    1. Bernstein L.B., Manser T. & Weiner A.M. Human U1 small nuclear RNA genes: extensive conservation of flanking sequences suggests cycles of gene amplification and transposition. Mol Cell Biol 5, 2159–71 (1985). - PMC - PubMed
    1. Lindgren V., Bernstein L.B., Weiner A.M. & Francke U. Human U1 small nuclear RNA pseudogenes do not map to the site of the U1 genes in 1p36 but are clustered in 1q12-q22. Mol Cell Biol 5, 2172–80 (1985). - PMC - PubMed

Publication types

LinkOut - more resources