[Preprint]. 2025 Sep 3:rs.3.rs-7389517.
doi: 10.21203/rs.3.rs-7389517/v1.

OPIOID-EXPRESSING B CELLS SILENCE TUMOR-INFILTRATING NOCICEPTOR NEURONS

Affiliations

OPIOID-EXPRESSING B CELLS SILENCE TUMOR-INFILTRATING NOCICEPTOR NEURONS

Tuany Eichwald et al. Res Sq. .

Abstract

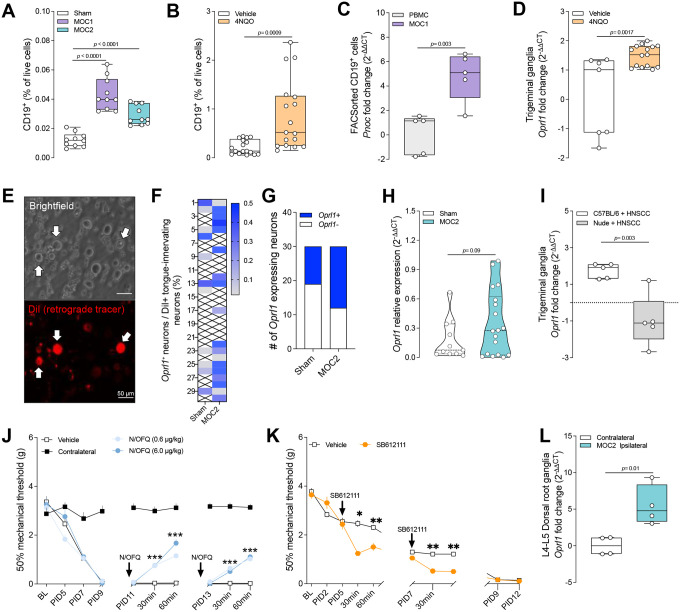
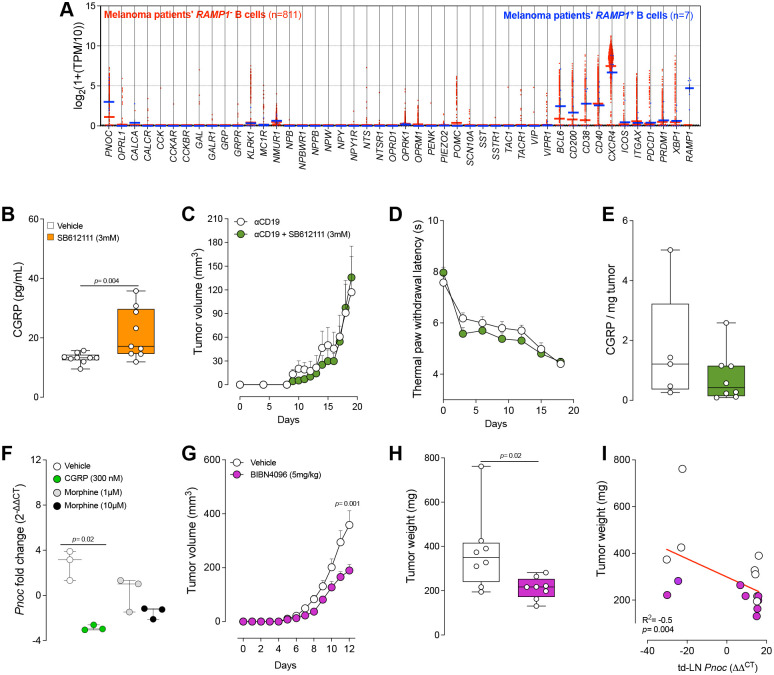
Nociceptor neurons, which transmit pain signals, also regulate immunity by releasing immunomodulatory neuropeptides. In head and neck squamous cell carcinoma (HNSCC) and melanoma, our research has shown that tumor-innervating nociceptors modulate anti-tumor immunity through the release of calcitonin gene-related peptide (CGRP) and its interaction with receptor activity-modifying protein 1 (RAMP1). A retrospective analysis of clinical charts from HNSCC patients revealed that higher pain levels correlated with increased opioid use, perineural invasion, and decreased B-cell infiltration-factors associated with poorer survival outcomes. In silico single-cell RNA sequencing demonstrated that opioid use in HNSCC patients downregulates nociceptin/orphanin FQ (N/OFQ), an endogenous ligand for opioid receptor-like-1 (OPRL1). We identified B cells as the primary source of N/OFQ and observed that high expression of either Pnoc or Oprl1 correlates with better survival in both melanoma and HNSCC. In a mouse model of oral squamous cell carcinoma (oSCC), we found that nociceptor neurons in tongue tumors overexpress Oprl1 and exhibit severe mechanical pain hypersensitivity. Compared to healthy tissue, oSCC tumors have dense infiltration of nociceptor fibers and N/OFQ-expressing B cells. Pharmacological blockade of Oprl1 reduced HNSCC-induced mechanical pain. In a melanoma mouse model, tumor-innervating neurons also overexpressed Oprl1, and similar overexpression was observed when DRG neurons were co-cultured with B16F10 cells. Activating OPRL1 reduced tumor size, enhanced cytotoxic T-cell infiltration, and relieved cancer-induced thermal hypersensitivity. In contrast, depleting CD19+ B cells or blocking OPRL1 led to increased tumor growth, reduced CD8+ T-cell infiltration and cytotoxic potential, exacerbated pain, and elevated CGRP levels. Moreover, we discovered that Ramp1+ B cells express Pnoc, but this expression is suppressed by CGRP. Blocking RAMP1 reduced tumor growth and promoted B-cell Pnoc expression. Overall, these findings suggest that targeting the N/OFQ and RAMP1 pathways could bolster anti-tumor immunity while simultaneously alleviating cancer-induced pain.

Keywords: B Cells; Cancer Neuroscience; Head and Neck Cancer; Melanoma; Neuro-Immunology; Nociceptin; Pain.


Conflict of interest statement

DECLARATIONS OF COMPETING INTEREST. The authors declare no conflicts of interest.

Figures

Fig. 1.
Fig. 1.. OPRL1 and PNOC impact survival in patients with skin cutaneous melanoma and head and neck squamous cell carcinoma.
A, In silico analysis of PNOC expression across cancer datasets revealed elevated PNOC levels in several tumor types, including higher PNOC expression in head and neck squamous cell carcinoma (HNSC) tumors compared to normal tissue, and in metastatic skin cutaneous melanoma (SKCM) compared to primary SKCM tumors. B, In silico analysis of The Cancer Genome Atlas (TCGA) data was used to correlate patient survival with relative PNOC expression (primary biopsy bulk RNA sequencing). Cox proportional hazard model show that higher PNOC expression levels exhibit prolonged survival in both SKCM and HNSC (positive coefficients; red squares). C, In silico analysis of single-cell RNA sequencing data of human melanoma (GSE115978) revealed that intratumoral PNOC is exclusively expressed in tumor-infiltrating B-cells. D–F, In silico analysis of TCGA data was used to correlate the survival rate in 459 patients with melanoma (D) with the relative expression of OPRL1 (E) and PNOC (F) (primary biopsy bulk RNA sequencing). Higher expression of either OPRL1 or PNOC correlate with improved survival compared to patients with low expression of both genes. G, In silico analysis of single-cell RNA sequencing data of human melanoma (GSE115978) revealed that intratumoral PNOC-expressing B-cells overexpress several anti-tumoral markers—ranging from immunosuppressive molecules (CD200) to those involved in antigen presentation (CD40) and effector functions (CD38)—in comparison to PNOC-negative B cells. In addition, PNOC-expressing B-cells show higher expression of key transcription factors (BCL6, PRDM1, XBP1) that govern B-cell fate decisions (germinal center vs. plasma cell) and drive the production of high-affinity, tumor-targeting antibodies. Data also indicate that ~33% of melanoma (206 out of 612) infiltrating B-cells express PNOC. H–J, In silico analysis of TCGA data was used to correlate the survival rate in 497 patients with HNSC (H) with the relative expression of OPRL1 (I) and PNOC (J) (primary biopsy bulk RNA sequencing). Higher expression of PNOC correlate with improved survival compared to patients with low PNOC expression. OPRL1 expression was not significantly affect HNSC patient survival (I). K, In silico analysis of single-cell RNA sequencing data of human HNSC (GSE164690) indicated that intratumoral PNOC-expressing B-cells strongly overexpress several anti-tumoral markers—i.e. antigen presentation (CD40), effector functions (CD38), and key transcription factor (XBP1) relative to PNOC-negative B-cells. Data also indicate that ~29% of HNSCC (3,661 out of 12,639) infiltrating B-cells express PNOC. Data are shown as PNOC Log2 TPM expression box-and-whisker plots (extending from the minimum to the maximum values, with the box spanning the 25th to 75th percentiles and the middle line indicating the median) (A), as a heatmap showing both Z-scores and significance annotated (B), as a heatmap displaying gene expression as log2 transcripts per million (TPM) (C), as Mantel–Cox regression (D, E, F, H, I, J), or as scatter dot plot with medians (G, K). n as follows: A: 3–1093 per group; B: 36–1100; D: 458; E: 114 per group; F: 229 per group; G: 612 (Pnocneg) and 206 (Pnocpos); H: 497; I, J: 249 per group; K:12,639 (Pnocneg) and 3,661 (Pnocpos). p values were determined by Wilcoxon test (A) Cox proportional hazard model (B), or Mantel–Cox regression (E, F, I, J).
Fig. 2.
Fig. 2.. Opioids reduce PNOC expression and survival in head and neck squamous cell carcinoma patients.
A, Patient-reported pain levels (measured by Functional Assessment of Cancer Therapy - Head & Neck cancer (FACT-HN) questionnaire question 10 (Q10)) were higher in head and neck squamous cell carcinoma (HNSCC) patients whose biopsy shows perineural invasion (PNI). B-C, Representative histological staining of a HNSCC biopsy tumor-associated neurons stain with S100+, TH+, TRPV1+, and CGRP+. C, HNSCC patient tumors demonstrated a higher density of nociceptor neurons (TRPV1+, CGRP+) compared to autonomic neurons (TH+); M = male patients (n=10); F = female patients (n=3). D, Cytometric evidence of B-cell density assessed in HNSCC biopsies was used to correlate the survival rate in 64 patients with HNSCC with the presence of B-cells in the tumor (assessed via flow cytometry in fresh tumor sample). Data shows the survival of patients with high (>5%) and low (<5%) B cell infiltration (Chi squared test). E, Cytometric evidence of B-cell density assessed in HNSCC biopsies revealed a trend in lower % B-cell in patients with PNI compared to patients without PNI. Unpaired t test with Welch’s correction due to non-normality in standard deviations. F, Representative histological staining illustrates neural invasion (top, pan-neuronal stain, Tubb3) and the proximity (≥ 20 μm) of CD20+ B cells (bottom, CD20) to tumor-infiltrating nerves. Scale=100μm. G, Higher reported oral pain levels (FACT-HN) in HNSCC patients negatively correlated with B-cell infiltration in their tumor biopsies (assessed via flow cytometry in fresh tumor sample), suggesting a protective role for B cells in modulating pain. H, HNSCC patient-reported pre-surgical opioid usage (expressed as morphine milligram equivalent (MME)) was not correlated with tumor B-cell density. I-J, In silico analysis of single-cell RNA sequencing data from HNSCC patient biopsies revealed PNOC expression in B cells remained unchanged following opioid treatment (I). But there was a lower overall proportion of PNOC-expressing B-cells (defined as CD19+CD20+CD79A+) in patients receiving opioids pre-surgically (J). K, Splenic B cells from naive C57BL/6 mice were cultured for 48 hours under LPS + IL-4 exposure. Cells were then treated daily for 96 hours with vehicle or morphine (10 μM). Morphine-treated cells showed reduced Pnoc expression. Data are shown as box-and-whisker plots (extending from the minimum to the maximum values, with the box spanning the 25th to 75th percentiles and the middle line indicating the median) (A, E, K), as representative images (B, F), as Mantel–Cox regression (D), as a linear regression (G, H), as mean ± s.e.m (J), or as dot plot (I). n as follows: A: 217 (PNIneg) and 126 (PNIpos); B: n=1 representative image; C: 13 patients, 10 males, 3 females; D: 21 (<5%) and 42 (>5%); E: 15 (PNIneg) and 12 (PNIpos); F: n=1 representative image; G: 23; H: 64; I, J: 2850 (vehicle) and 3044 (opioid); K: 6 mice. p values were determined by two-tailed Mann–Whitney test (A, I), Mantel–Cox regression (D), unpaired t-test (E, K), or linear regression analysis (G, H).
Fig. 3
Fig. 3. N/OFQ modulates pain responses in oral squamous-cell carcinoma (oSCC).
A, Orthotopic oSCC cells (MOC1 (1×10⁶) or MOC2 (2×10⁴)) were injected intramuscularly into the anterior tongues of eight-week-old male and female C57BL/6 mice; sham mice received only culture media. Tongue tumors were collected at 250mm3 and tumor-infiltrating B cells quantified by flow cytometry. Both MOC1- and MOC2-bearing tongues showed increased infiltration of CD19+ B cells compared with sham controls. B, 4-Nitroquinolin-1-oxide (4NQO; 100 μg/ml) or vehicle (propylene glycol; 5mg/ml) was administered in the drinking water of eight-week-old male and female C57BL/6 mice for 16 weeks. Twelve weeks later, tongue tumors were harvested and CD19+ B cells quantified by flow cytometry; 4NQO treatment likewise increased CD19+ B cells infiltration relative to vehicle controls. C, Orthotopic oSCC cells (MOC1 (1×10⁶) or MOC2 (2×10⁴)) were injected intramuscularly into the anterior tongues of eight-week-old male and female C57BL/6 mice; sham mice received only culture media. Tongue tumors were collected at 250mm3 and dissociated for FACS isolation of CD19+ B cells into lysis buffer for RNA isolation. Pnoc levels were measured by qPCR. Pnoc expression was higher in CD19+ B cells from MOC1 tumors than in CD19+ B cells from sham control tongues. D, 4-Nitroquinolin-1-oxide (4NQO; 100 μg/ml) or vehicle (propylene glycol; 5mg/ml) was administered in the drinking water of eight-week-old male and female C57BL/6 mice for 16 weeks. Twelve weeks later, bilateral trigeminal ganglia were harvested and processed for RNA extraction. Oprl1 expression was quantified by qPCR. Data show that Oprl1 expression was elevated in trigeminal neurons from 4NQO-treated mice versus vehicle controls. E–H, Tongue-innervating neurons were labeled with the retrograde tracer DiI (170mg/ml DMSO, diluted 1:10 in saline) injection into the anterior tongue of eight-week-old male and female C57BL/6 mice. One week later, MOC2 cells (2×10⁴) were injected intramuscularly into the anterior tongues. When tongue tumors reached 250mm3, bilateral trigeminal ganglia were harvested, dissociated and tracer positive neurons were picked up using eletrodes for single cell PCR. To assess Oprl1 expression. G-H, The proportion of Oprl1 expressing neurons was greater in MOC2 tongue tumor mice compared to sham and there was a trend in greater relative expression. I, MOC1 cells (1×10⁶) were injected intramuscularly into the anterior tongue of immunocompetent (C57BL/6) or immunodeficient (NOD-scid IL2Rgnull) mice, respectively. When tumors reached 250mm3, tongue-innervating trigeminal ganglia were collected and Oprl1 expression was quantified by qPCR. Data show that Oprl1 expression was higher in neurons from immunocompetent than from immunodeficient mice. J–L, MOC2 cells (2×10⁴) were injected into the left hind paw of eight-week-old male and female C57BL/6 mice. Mechanical hypersensitivity was assessed as the 50 % paw-withdrawal threshold of the tumor-bearing (ipsilateral) paw relative to the contralateral paw after acute intratumoral administration of (J) N/OFQ (0.6 μg kg−1 or 6 μg kg−1); (K), OPRL1 antagonist SB612111 (3mM; 33mM DMSO diluted in pH 7 PBS) J), or their respective vehicles. J, N/OFQ increased withdrawal thresholds (i.e., reduced pain) at 30 and 60 min on post-inoculation days (PID) 11 and 13. K, SB612111 (3mM) decreased thresholds (i.e., increased pain) at 30 and 60 min on post-inoculation days (PID) on PID 5 and 7. L On day 14 the mice were euthanized, ipsilateral L3–L5 dorsal-root ganglia (DRG) were collected, and Oprl1 expression was measured by qPCR; DRG from ipsilateral MOC2-bearing paws expressed higher Oprl1 levels than contralateral DRG. Data are shown as box-and-whisker plots (extending from the minimum to the maximum values, with the box spanning the 25th to 75th percentiles and the middle line indicating the median) (A, B, C, D, H, K), as representative images (E), as heatmap (F), as violin plot (G), or as time-course line plot (I, J). n as follows: A: 10 per group; B: 17 per group; C: 5 per group; D: 7 (vehicle) and 15 (4NQO); F, H: 11 (sham) and 18 (MOC2); I: 5 per group; J: 8 per group; K: 5 per group; L: 4 per group. p values were determined by two-sided unpaired Student’s t-test (A, B, C, D, H, K), unpaired Welch’s t-test (G), or two-way ANOVA with Bonferroni correction (I, J).
Fig. 4.
Fig. 4.. Tumor-innervating neurons express Oprl1, regulating pain sensitivity.
A, In silico analysis of RNA-sequencing data from Balood et al., (GSE205864) in which naïve dorsal root ganglion (DRG) neurons (Trpv1cre::-CheRiff-eGFPfl/wt), B16F10-mCherry-OVA melanoma cells, and OVA-specific CD8+ T cells were cultured alone or in combination for 48 hours. After FACS purification, RNA sequencing revealed that cancer-exposed TRPV1+ neurons upregulate distinct gene clusters, including Oprl1. B, In silico analysis of RNA-sequencing data from Balood et al., (GSE205865) in which naïve DRG neurons (Trpv1cre::-CheRiff-eGFPfl/wt) were cultured alone or with B16F10-mCherry-OVA cells. After 48 hours, the cells were collected, FACS purified, and RNA-sequenced. Hierarchical clustering of differentially expressed genes (DEGs) from the sorted neurons shows distinct groups of transcripts enriched in cancer-exposed TRPV1+ neurons—most notably Oprl1. C, Orthotopic B16F10-OVA cells or non-tumorigenic keratinocytes (2×10⁵ cells) were injected intradermally into the left hind paw of nociceptor-reporter mice (Trpv1cre::tdTomatofl/wt). Two weeks post-injection, L3–L5 DRG neurons were harvested, TRPV1+ neurons were FACS-purified and RNA-sequenced. DEGs analysis revealed that Oprl1 is overexpressed in DRG neurons from tumor-inoculated mice. D, In silico analysis of three different B16F10 cell cultures (labeled i, ii, iii) originally described by Castle et al. and re-analyzed by Balood et al. shows basal expression of Braf and Pten, but no detectable transcripts of Pnoc or Oprl1. E, F, Orthotopic B16F10-OVA cells (2×10⁵) were injected intradermally into the right hind paw of wild-type mice. Starting one day later, mice received daily intradermal paw injections of either vehicle (50 μL) or the OPRL1 antagonist SB612111 (3 mM, 50 μL). The evoked thermal pain hypersensitivity and the spontaneous mechanical sensitivity were assessed every other day with the Hargreaves test and the BlackBoxBio system, respectively. By day 11, OPRL1 blockade had heightened thermal hypersensitivity (E) and reduced paw luminance (F). G, Intradermal hind paw injection of recombinant N/OFQ (0.6 μg/kg, 20 μL) reduced the thermal pain hypersensitivity 3 hours post-injection in comparison to the vehicle injection. Data are shown as box-and-whisker plots (ranging from the minimum to the maximum values, with the box extending from the 25thto the 75thpercentile and the middle line indicating the median), for which individual data points (A, B), as scatter dot plots with medians in (C), as heatmap displaying gene expression as log2 transcripts per million (TPM) (D), and as mean ± s.e.m. (E, F, G). n as follows: A: 3–4 per group; B: 4 per group; C: 5 per group, D: 3; E, F: 11 (vehicle) and 12 (SB12111); G: 6 per group. p values were determined by nested one-way ANOVA with post hoc Tukey (A), two-sided unpaired Student’s t-test (B, C), or two-way ANOVA with post hoc Bonferroni (E, F, G).
Fig. 5.
Fig. 5.. OPRL1 activation reduces tumor growth and improves anti-tumor immunity.
A-G, Orthotopic B16F10-OVA cells (5×10⁵) were inoculated intradermally into the flank of wild-type mice. Starting one later, mice received daily intradermal injections of either vehicle (50 μL) recombinant N/OFQ (0.6 μg/kg; 50 μL) at five sites around the tumor. A, B, Fourteen days after tumor inoculation, recombinant N/OFQ administration significantly reduced tumor growth (A), and tumor weight (B). C-G, Immunophenotyping of tumor-infiltrating cells revealed increased total CD8+ T-cells (C) and proportion of CD8+ T-cells expressing IFNγ+ (D), TNFα+ (E), and IL2+ (F) in mice treated with N/OFQ. No change was observed in the proportion of PD1+ CD8+ T-cells (G). Data are shown as mean ± s.e.m. in (A) or as box-and-whisker plots with individual data points in (B-G). n as follows: 12 per group. p values were determined by two-way ANOVA with post hoc Bonferroni (A) or two-sided unpaired Student’s t-test (B-G).
Fig. 6.
Fig. 6.. OPRL1 blockade impairs immunosurveillance and increases tumor growth.
A-G, Orthotopic B16F10-OVA cells (5 × 10⁵ cells, i.d.) were inoculated into the flank of wild-type mice. Starting one day later, mice received daily intradermal injections of either vehicle (50 μL) or the OPRL1 antagonist SB612111 (3 mM; 50 μL) at five sites around the tumor. Thirteen days after tumor inoculation, mice treated with SB612111 showed increased tumor volume (A, B), and tumor weight (C). Immunophenotyping of tumor-infiltrating cells revealed decreased infiltration of CD8+ T-cells (D), and proportion of CD8+ T-cells expressing IFNγ+ (E), and TNFα+ (F) in mice treated with OPRL1 antagonist. OPRL1 antagonist treatment increased the number of CD8+ T-cells in tumor-draining lymph nodes (dLN) (G). Data are shown as mean ± s.e.m. (A), as representative image (B), and as box-and-whisker plots with individual data points indicated (C-G). n as follows: A-G: 8 (vehicle) and 7 (SB612111). p values were determined by two-way ANOVA with post hoc Bonferroni (A) or two-sided unpaired Student’s t-test (C-G).
Fig. 7.
Fig. 7.. CGRP regulates PNOC expression and tumor growth.
A, In silico analysis of single-cell RNA sequencing data (GSE115978) from skin cutaneous melanoma (SKCM) patient biopsies displays that intratumoral RAMP1-expressing B-cells showed substantially higher PNOC expression compared to RAMP1-negative B-cells. B, Orthotopic B16F10-OVA cells (2×10⁵) were inoculated into the right hind paw of wild-type mice. Starting one later, mice received daily intradermal injections of vehicle (50 μL) or the OPRL1 antagonist SB612111 (3 mM; 50 μL). On day 11, tumor explants were harvested, cultured, and exposed to capsaicin to induce peptide release. Conditioned media were then collected and assessed for CGRP by ELISA. SB612111-treated mice tumors released higher levels of CGRP. C-E, To deplete circulating B-cells, 8-week-old C57BL/6 male and female mice were treated with anti-CD19 (αCD19; 200 μg) once a week for three consecutive weeks. Subsequently (5 days later), the mice were inoculated in the right hind paw with B16F10-OVA cells (2×10⁵). Starting one day later, mice received daily intradermal injections of vehicle (50 μL) or SB612111 (3 mM; 50 μL). Under B-cell–depleted conditions, OPRL1 blockade did not affect tumor growth (C). The evoked thermal pain hypersensitivity was assessed every three days with the Hargreaves test. OPRL1 blockade did not alter tumor-induced thermal hypersensitivity (D). On day 20, tumor explants were harvested, cultured, and exposed to capsaicin to induce peptide release. Conditioned media were then collected and assessed for CGRP by ELISA. OPRL1 blockade had no effect on CGRP release in B-cell–depleted mice (E). F, Splenic B cells from naive C57BL/6 mice were cultured for 48 hours under LPS + IL-4 exposure. Cells were then treated daily for 96 hours with vehicle or CGRP (300 nM). CGRP-treated cells showed reduced Pnoc expression. G-I, Orthotopic B16F10-OVA cells (2×10⁵) were inoculated intradermally into the flank of wild-type mice. Starting one day later, mice received intraperitoneal injections of vehicle (100 μL) or the RAMP1 antagonist BIBN4096 (5 mg/kg) every other day. By day 12, BIBN4096 significantly reduced tumor growth (G) and tumor weight (H). Higher tumor weight negatively correlated with Pnoc expression in the tumor-draining lymph nodes (td-LN) (I). Data are shown as violin plots (A), as box-and-whisker plots (extending from the minimum to the maximum values, with the box spanning the 25thto 75thpercentiles and the middle line indicating the median), where individual data points are shown (B, E, H), as mean ± s.e.m.: (C, D, G), as scatter dot plots with medians (F) or as mantel-cox regression (I). n as follows: A: 811 (Ramp1neg) and 7 (Ramp1pos); B: 9 (vehicle) and 7 (SB612111); C: 5 (αCD19) and 9 (αCD19 + SB612111); D, E: 5 (αCD19) and 8 (αCD19 + SB612111); F: 3 per group; G-I: 8 per group. p values were determined by two-sided unpaired Student’s t-test (A, B, E, H), one-way ANOVA with Bonferroni post hoc (F), two-way ANOVA with Bonferroni post hoc (C, D, G), or simple linear regression (l).

References

    1. Darragh L. B. et al. Sensory nerve release of CGRP increases tumor growth in HNSCC by suppressing TILs. Med (New York, N.Y.) 5, 254–270.e8 (2024).
    1. Zhang Y. et al. Cancer cells co-opt nociceptive nerves to thrive in nutrient-poor environments and upon nutrient-starvation therapies. Cell Metab. 34, 1999–2017.e10 (2022). - PubMed
    1. Balood M. et al. Nociceptor neurons affect cancer immunosurveillance. Nature 611, 405–412 (2022). - PMC - PubMed
    1. McIlvried L. A., Atherton M. A., Horan N. L., Goch T. N. & Scheff N. N. Sensory Neurotransmitter Calcitonin Gene-Related Peptide Modulates Tumor Growth and Lymphocyte Infiltration in Oral Squamous Cell Carcinoma. Adv. Biol. 6, e2200019 (2022).
    1. Corder G. et al. Loss of μ opioid receptor signaling in nociceptors, but not microglia, abrogates morphine tolerance without disrupting analgesia. Nat. Med. 23, 164–173 (2017). - PMC - PubMed

Publication types

LinkOut - more resources