. 2025 Sep;171(9):001609.
doi: 10.1099/mic.0.001609.

Common food preservatives induce an oxidative stress response in Salmonella enterica serovar Typhimurium

Affiliations

Common food preservatives induce an oxidative stress response in Salmonella enterica serovar Typhimurium

Emma R Holden et al. Microbiology (Reading). 2025 Sep.

Abstract

Despite their frequent use, the mechanisms of action of common food preservatives are poorly understood. As there is a drive to develop alternative preservatives, understanding the mechanisms of action of current preservatives can inform the development of novel food preservatives to ensure their efficacy. Here, we used TraDIS-Xpress, a large-scale, genome-wide unbiased screen to determine the mechanisms of action of common food preservatives by determining the genes that affect preservative susceptibility in Salmonella enterica serovar Typhimurium. We identified genes associated with central metabolism and oxidative stress responses that were important for all four preservatives. Formate dehydrogenase activity and synthesis was crucial for survival in the presence of both sodium chloride and potassium chloride. We found some preservative-specific effects on pathogen susceptibility, for example, LPS synthesis which improved survival upon exposure to sodium nitrite but harmed survival when exposed to sodium chloride or potassium chloride. This research expands our understanding of how some current preservatives act and can inform the effective use of preservatives in current and emerging food products to ensure high standards of food safety.

Keywords: functional genomics; TraDIS; transposon mutagenesis.


Conflict of interest statement

The authors declare that there are no conflicts of interest.

Figures
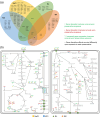
Fig. 1.
Fig. 1.. (a) Genes in S. Typhimurium that affect susceptibility to NaCl, KCl, SL and SN. (b) Genes mapped to metabolic models showing respiration (left) and membrane polysaccharide synthesis (right).
Fig. 2.
Fig. 2.. (a) Transposon insertion sites and frequencies in and around genes involved in LPS biosynthesis when treated with NaCl, KCl, SL and SN, relative to an untreated control. Genes highlighted in green were found by TraDIS-Xpress to affect growth in the presence of at least one of the preservatives tested (genes in grey are included for context). Red peaks show insertions on the forward strand, and blue peaks show insertions on the reverse strand. Y-axes have been normalized for each locus to show relative differences in insert abundance between conditions. (b) Growth of S. Typhimurium deletion mutants relative to the untreated WT in the presence of each preservative. Asterisks show significant differences between the WT and mutant exposed to each preservative (two-way ANOVA with Tukey post hoc analysis). (c) Change in the percentage of mutants in co-culture with WT S. Typhimurium over 24 h. Asterisks show changes in mutant abundance over 24 h (paired t-test). For both plots, points show a minimum of two biological and three technical replicates, and error bars denote 95% CIs (*P<0.05, **P<0.01, ***P<0.001 and ****P<0.0001).
Fig. 3.
Fig. 3.. (a) Transposon insertion sites and frequencies in and around sucA, crp and rpoS when treated with NaCl, KCl, SL and SN, relative to an untreated control. Red peaks show insertions on the forward strand, and blue peaks show insertions on the reverse strand. Y-axes have been normalized for each locus to show relative differences in insert abundance between conditions. Regions highlighted by ‘A’, ‘B’ and ‘C’ show where insertions indicate that overexpression of downstream genes could improve survival upon exposure to preservatives. (b) Growth of S. Typhimurium deletion mutants relative to the untreated WT in the presence of each preservative. Asterisks show significant differences between the WT and gene deletion mutant exposed to each preservative (two-way ANOVA with Tukey post hoc analysis). (c) Change in the percentage of mutants in co-culture with WT S. Typhimurium over 24 h of growth when exposed to preservative stress. Asterisks show significant changes in mutant abundance over 24 h (paired t-test). (d) Change in the percentage of ΔrpoS deletion mutants in co-culture with WT S. Typhimurium over 24 h of growth under aerobic and anaerobic conditions. Asterisks show significant differences in mutant abundance between aerobic and anaerobic conditions (Welch’s t-test). For all scatter plots, points show a minimum of two biological and three technical replicates, and error bars denote 95% CIs (*P<0.05, **P<0.01, ***P<0.001 and ****P<0.0001).
Fig. 4.
Fig. 4.. (a) Transposon insertion sites and frequencies in and around genes involved in formate dehydrogenase synthesis and activity when treated with NaCl, KCl, SL and SN, relative to an untreated control. Red peaks show insertions on the forward strand, and blue peaks show insertions on the reverse strand. Y-axes have been normalized for each locus to show relative differences in insert abundance between conditions. (b) Growth of S. Typhimurium deletion mutants relative to the untreated WT in the presence of each preservative. Asterisks show significant differences between each gene deletion mutant and the WT exposed to each preservative (two-way ANOVA with Tukey post hoc analysis). (c) Change in the percentage of deletion mutants in co-culture with WT S. Typhimurium over 24 h of growth in aerobic and anaerobic conditions. No significant changes in mutant abundance were found following 24 h of growth (paired t-test) or between aerobic and anaerobic conditions (Welch’s t-test). For both scatter plots, points show a minimum of two biological and three technical replicates, and error bars denote 95% CIs (*P<0.05, **P<0.01, ***P<0.001 and ****P<0.0001).

References

    1. Guan N, Li J, Shin H-D, Du G, Chen J, et al. Microbial response to environmental stresses: from fundamental mechanisms to practical applications. Appl Microbiol Biotechnol. 2017;101:3991–4008. doi: 10.1007/s00253-017-8264-y. - DOI - PubMed
    1. Henney J, Taylor C, Boon C. Strategies to Reduce Sodium Intake in the United States. Washington, DC: National Academies Press (US); 2010. Preservation and physical property roles of sodium in foods. - PubMed
    1. Li F, Xiong X-S, Yang Y-Y, Wang J-J, Wang M-M, et al. Effects of NaCl concentrations on growth patterns, phenotypes associated with virulence, and energy metabolism in Escherichia coli BW25113. Front Microbiol. 2021;12 doi: 10.3389/fmicb.2021.705326. - DOI - PMC - PubMed
    1. Majou D, Christieans S. Mechanisms of the bactericidal effects of nitrate and nitrite in cured meats. Meat Science. 2018;145:273–284. doi: 10.1016/j.meatsci.2018.06.013. - DOI - PubMed
    1. Albarracín W, Sánchez IC, Grau R, Barat JM. Salt in food processing; usage and reduction: a review. Int J of Food Sci Tech. 2011;46:1329–1336. doi: 10.1111/j.1365-2621.2010.02492.x. - DOI

MeSH terms

LinkOut - more resources