. 2025 Sep 15;15(1):32554.
doi: 10.1038/s41598-025-16925-2.

Cranberry improves metabolic syndrome-related organ dysfunction in rats by modulating AMPK/SREBP1, ROCK1 and TGF-β1

Affiliations

Cranberry improves metabolic syndrome-related organ dysfunction in rats by modulating AMPK/SREBP1, ROCK1 and TGF-β1

Sahar M Elashmony et al. Sci Rep. .

Abstract

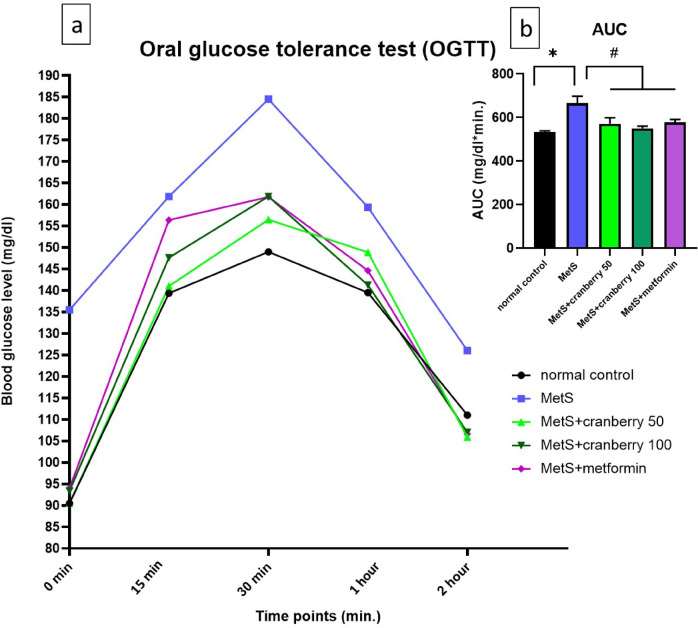
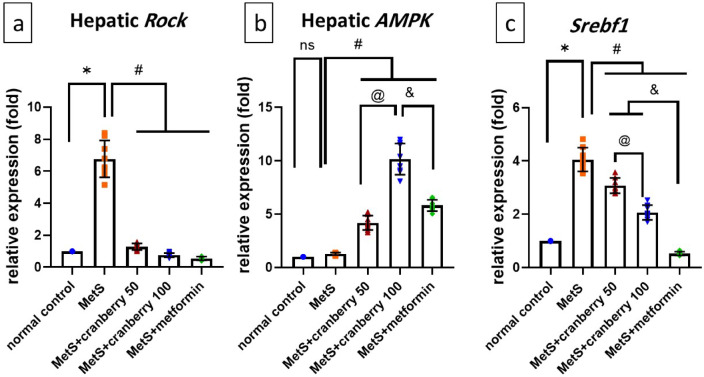
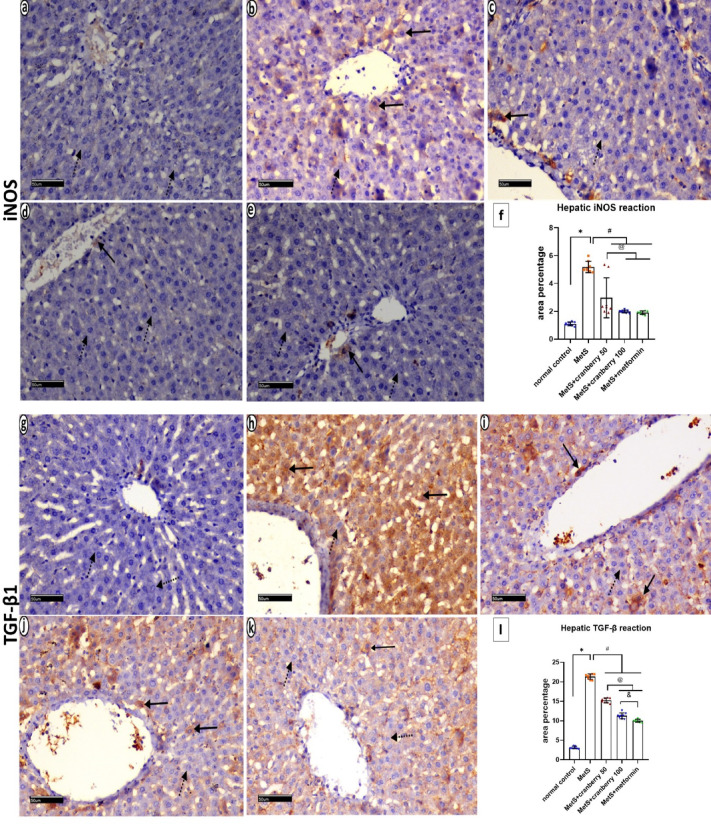
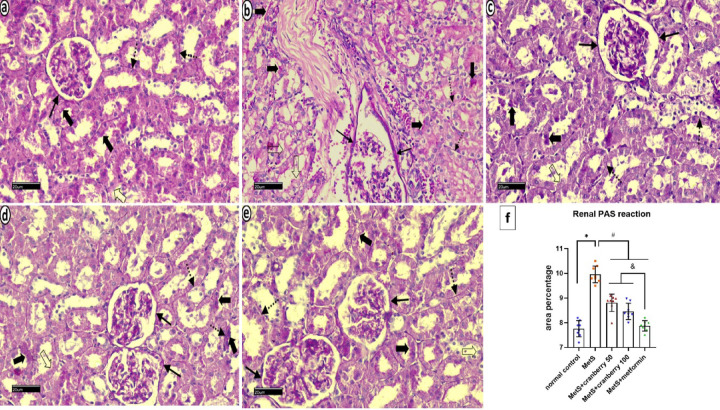
Metabolic syndrome (MetS) is a widespread, complex health issue that poses a substantial global health burden with increased healthcare costs and reduced quality of life, necessitating effective prevention and management strategies. This study aimed to investigate the potential therapeutic effects of cranberry extract (Vaccinium macrocarpon) and metformin on metabolic syndrome in a rat model. Forty rats were divided into the following groups: normal control, MetS (high fat and fructose for 4 weeks followed by streptozotocin 35 mg/kg, i.p.), MetS + cranberry (50 mg/kg), MetS + cranberry (100 mg/kg), and MetS + metformin (200 mg/kg) groups. Treatments were given orally for four weeks with the continuation of a high-fat and high-fructose diet. The evaluations included key metabolic parameters, liver and kidney pathology, and relevant molecular pathways. The present results revealed that MetS induction significantly increased body weight, BMI, fasting glucose, and OGTT results; impaired lipid profile, creatinine and blood pressure; and upregulated hepatic gene expression of Rho-associated protein kinase 1 (Rock1 ) and sterol regulatory element-binding transcription factor 1 (Srebf1), which encodes the protein SREBP-1c. In addition to hepatic and renal structural abnormalities, increased collagen and increased iNOS/TGF-β1 immunoreactivity were observed. Cranberry ameliorated metabolic parameters in a dose-dependent manner, upregulated adenosine monophosphate-activated protein kinase (AMPK), downregulated Rock1 and Srebf1 expression, improved the histopathology of the liver and kidney and decreased the immunoexpression of iNOS and TGF-β1. The results for cranberry were generally comparable to those for metformin. In conclusion, cranberry extract is potentially a safe therapeutic strategy for MetS, offering broad-spectrum action, organ protection, and molecular pathway modulation. These findings strongly support cranberry as a promising natural approach for managing MetS.

Keywords: Rock1; AMPK/Srebf1; Cranberry extract; Metabolic syndrome; TGF-β1.


Conflict of interest statement

Declarations. Competing interests: The authors declare no competing interests. Prior publication: The data presented in this manuscript have not been published previously.

Figures

Fig. 1
Fig. 1
Means and standard deviations of (a) body weight and organ weight (gm), (b) BMI (gm/cm2), (c) fasting glucose level (mg/dl), (d) serum creatinine level (mg/dl) and (eh) organ weight (gm) in all the studied groups. *Significant compared with the normal control group; #significant compared with the MetS group; &significant compared with the metformin group. Values of p < 0.05 were considered significant.
Fig. 2
Fig. 2
Effect of cranberry extract and metformin on oral glucose tolerance test (OGTT) and glucose area under the curve (AUC). (a) Blood glucose levels (mg/dl) at 0, 15, 30, 60, and 120 min after an oral glucose load. (b) Integrated area under the curve (AUC) for glucose (mg/dl*min.) derived from the OGTT data. Groups shown are: normal control (black circle), MetS (blue square), MetS + cranberry 50 mg/kg (green upward triangle), MetS + cranberry 100 mg/kg (dark green downward triangle), and MetS + metformin (purple diamond). Data are presented as mean values and standard errors. *Significant compared to normal control group; #Significant compared to MetS group. Values of p < 0.05 were considered significant.
Fig. 3
Fig. 3
Means and standard deviations of systolic (SBP), diastolic (DBP) blood pressure and mean arterial blood pressure (MAP) (mmHg) in all the studied groups. *: significant compared with the normal control group; #: significant compared with the MetS group. Values of p < 0.05 were considered significant.
Fig. 4
Fig. 4
Means and standard deviations in mg/dl of (a) triglycerides (TG), (b) cholesterol, (c) low-density lipoprotein-cholesterol (LDL-C), and (d) high-density lipoprotein-cholesterol (HDL-C) in all the studied groups. *: significant compared with the normal control group; #: significant compared with the MetS group; @: significant compared with the cranberry 50 group; &: significant compared with the metformin group. Values of p < 0.05 were considered significant.
Fig. 5
Fig. 5
Means and standard deviations of the relative fold changes in the expression of (a) Rock1, (b) AMPK, and (c) Srebf1 in all the studied groups. ns: non-significant, *: significant difference compared with the normal control group; #: significant difference compared with the MetS group; @: significant difference compared with the cranberry 50 group; &: significant difference compared with the metformin group. Values of p < 0.05 were considered significant.
Fig. 6
Fig. 6
Photomicrographs of H&E-stained liver sections from all experimental groups: Control group (a) showing normal histological architecture. Hepatocytes are arranged in radiating cords extending from the central vein (CV) and separated with blood sinusoids (S). Hepatocytes display granular acidophilic cytoplasm and vesicular nuclei with prominent nucleoli (arrows). Some hepatocytes are binucleated (dotted arrows). MetS group (b,c) showing numerous hepatocytes with cytoplasmic vacuolations (curved arrows). The other hepatocytes presents deep acidophilic cytoplasm and small dark pyknotic nuclei (red arrows). A dilated central vein with thickened walls (CV) and prominent inflammatory cell infiltration are observed (black rectangles). The MetS + Cranberry 50 group (d) shows almost normal hepatocytes with vesicular nuclei (arrows). However, few hepatocytes display small, dark pyknotic nuclei (red arrows) or cytoplasmic vacuolations (curved arrows). Mild inflammatory infiltration (black rectangle) is evident. The MetS + Cranberry 100 (e) and metformin (f) groups present restored normal hepatic architecture (arrows) with some binucleated cells (dotted arrows). Minimal inflammatory cells are observed (black rectangles). (H&E a,b,d,e,f x200 c x400)
Fig. 7
Fig. 7
Photomicrographs of PAS-stained liver sections from all the experimental groups. Control group (a) reveals normal distribution of glycogen in hepatocytes, with equal reactions across all the hepatic lobules (arrows). The MetS group (b) demonstrates many hepatocytes with negative PAS reactions (dotted arrows) and few with positive reactions (arrows). The MetS + Cranberry 50 group (c) demonstrated partial restoration of glycogen, with a mixture of PAS-positive (arrows) and negative hepatocytes (dotted arrows). The metS + cranberry 100 (d) and metformin (e) groups display strong PAS-positive reactions in numerous scattered hepatocytes (arrows). (PAS ×400). (f) Liver PAS reaction area percentages in different groups (n = 8). P values were considered significant at p < 0.05 via ANOVA followed by a post hoc test. *Versus control, #versus MetS, @ versus MetS + Cranberry50, & versus metformin.
Fig. 8
Fig. 8
Photomicrographs of liver sections stained with Masson’s trichrome from all experimental groups. Control group (a) reveals minimal collagen deposition around the central vein (red arrow) and in the portal area (arrow). The MetS group (b) exhibites extensive collagen fiber deposition around the central vein (red arrow) and in the portal area (arrow). MetS + Cranberry 50 group (c) showing moderate collagen deposition around the central vein (red arrow) and in the portal area (arrow). The MetS + Cranberry 100 (d) and metformin (e) groups present mild collagen deposition around the central vein (red arrow) and in the portal area (arrow). (Masson’s trichrome, x400). (f) Area percentage of liver collagen fiber deposition in the different groups (n = 8). P values were considered significant at p < 0.05 via ANOVA followed by a post hoc test. *Versus control, # versus MetS, @ versus MetS + Cranberry 50, & versus metformin.
Fig. 9
Fig. 9
Photomicrographs of immunohistochemical staining of iNOS- and TGF-β1-stained liver sections from all the experimental groups. The control group (a,g) presents minimal iNOS and TGF-β1 expression (dotted arrows). The MetS group (b,h) exhibits widespread positive cytoplasmic expression of both iNOS and TGF-β1 in many cells (arrows) and negative expression in a few other cells (dotted arrows). The MetS + Cranberry 50 (c,i) and MetS + Cranberry 100 (d,j) groups show a mixed pattern, with some hepatocytes displaying positive expression (arrows) and others negative expression (dotted arrows) of iNOS and TGF-β1. The metformin group (e, k) demonstrates reduced positive staining for both iNOS and TGF-β1 immunoreactions in few hepatocytes (arrows) and negative expression in many hepatocytes (dotted arrows). (iNOS and TGF-β1 × 200). (f,l) Representative area percentages of iNOS and TGF-β1 reactions in the different groups (n = 8). P values were considered significant at p < 0.05 via ANOVA followed by a post hoc test. *Versus control, # versus MetS, @ versus MetS + Cranberry 50, & versus metformin.
Fig. 10
Fig. 10
Photomicrographs of H&E-stained sections of the renal cortex from all experimental groups. (a) Normal histological architecture of renal corpuscles, formed of Bowman’s capsules lined with simple squamous epithelium (arrow), glomeruli (G) and normal capsular space (dotted arrow), is shown in the control group. The proximal (PT) and distal (DT) tubules have a normal epithelial lining. MetS group (b,c) showing retraction of glomerular tufts (G) with concomitant widening of the capsular space (dotted arrows). Proximal (PT) and distal (DT) tubules show cystic dilatation (stars), distortion of tubules (black circles), epithelial vacuolations (V), nuclear pyknosis (thick black arrows), epithelial cell detachment (hollow arrows), intraluminal eosinophilic debris (*), inflammatory infiltration (black rectangles) and extravasation of erythrocytes in Bowman’s space (right angled arrows). The MetS + Cranberry 50 group (d) shows normal architecture of the glomeruli (G) and apparent normal tubules (PT & DT) but persistent extravasation of erythrocytes (right angled arrows), in between tubules, epithelial cell detachment (hollow arrow), and intraluminal eosinophilic debris (*). MetS + Cranberry 100 group (e) showing near normal tubules (PT & DT) with minimal epithelial cell detachment (hollow arrow). The metformin group (f) generally presented a normal architecture of renal tissue with occasional extravasation of erythrocytes (right angled arrows), epithelial vacuolations (V), nuclear pyknosis (thick arrow), cystic dilatation (stars) and intraluminal eosinophilic debris (*) (H&E x400).
Fig. 11
Fig. 11
Photomicrographs of PAS-stained sections of the renal cortex from all experimental groups: the control group (a) reveales consistent, intense magenta‒red staining of Bowman’s capsule basement membrane (arrow), an intact tubular brush border (thick arrows), and tubular basement membranes (dotted arrows). The metS group (b) displays a thickened PAS reaction in Bowman’s capsule basement membranes (arrows), brush border disruption (thick arrows), and lost reaction in the brush border (hollow arrows) of many tubules. There is a faint PAS reaction in the basement membrane of a few tubules (dotted arrows). The MetS + cranberry 50 group (c) presentes prominent PAS reaction in basement membrane of Bowman capsule (arrows). Moderate positive PAS reaction in renal tubules brush border (thick arrows) and basement membrane of tubules (dotted arrows). There was no reaction in the luminal borders of few tubules (hollow arrow). The MetS+Cranberry 100 group (d) showing moderate positive PAS reaction in basement membrane of Bowman capsule (arrows), along the intact brush border (thick arrows) and regular basement membrane (dotted arrows) in majority of tubules. Few renal tubules show negative luminal brush border PAS reaction (hollow arrow). The metformin group (e) showing faint PAS reaction in capsular basement membrane (arrows), intact brush border (thick arrows) and basement membrane (dotted arrows) in majority of renal tubules. There is no reaction in luminal borders of few tubules (hollow arrow) (PAS x400). (f) Renal PAS reaction area percentages in different groups (n = 8). P values were considered significant at p < 0.05 via ANOVA followed by a post hoc test. * versus control, # versus MetS, @ versus MetS + Cranberry 50, & versus metformin.
Fig. 12
Fig. 12
Photomicrographs of kidney sections from all experimental groups stained with Masson’s trichrome. Control group (a) Normal glomerular and renal tubules with minimal collagen deposition in the perivascular (arrow) and intraglomerular regions (thick arrow) are shown. The MetS group (b) presented extensive collagen deposition, particularly in the perivascular regions (arrows) and Bowman’s capsule (red arrows). MetS + Cranberry 50 (c) demonstrates moderate collagen fibers deposition in Bowman’s capsule (red arrows) and between the tubules (dotted arrows). MetS + Cranberry 100 (d) exhibits mild deposition in Bowman’s capsule (red arrows). The metformin (e) group presented mild collagen deposition in the perivascular region (arrow) and Bowman’s capsule (red arrows). (Masson’s Trichrome ×200). (f) Area percentage of renal collagen fiber deposition in the different groups (n = 8). P values were considered significant at p < 0.05 via ANOVA followed by a post hoc test. *Versus control, # versus MetS, @ versus MetS + Cranberry 50, & versus metformin.
Fig. 13
Fig. 13
Photomicrographs of immunohistochemical staining of iNOS and TGF-β1 sections from the kidneys of all the experimental groups. Control group (a,g) reveals negative cytoplasmic expression of iNOS and TGF-β1 in the glomeruli (arrows) and proximal tubules (dotted arrows). Distal tubules appear with negative expression for iNOS and moderate TGF-β1 expression (thick arrows), which appears as a brownish color. The MetS group (b,h) presented moderate cytoplasmic expression of iNOS and TGF-β1 in the glomeruli (arrows) and proximal tubule tubules (dotted arrows), with extensive expression in the distal tubules which is prominent for TGF-β1 (thick arrows). The MetS + Cranberry50 (c,i) and MetS + Cranberry100 (d, j) groups presented mild positive cytoplasmic expression of iNOS and TGF-β1 in the glomeruli (thin arrow) and proximal tubules (dotted arrows) with moderate expression in the distal tubules which is prominent for TGF-β1 (thick arrows). The metformin group (e,k) presented negative cytoplasmic expression of iNOS in the glomeruli (arrow), proximal tubules (dotted arrow) and distal tubules (thick arrow), whereas TGF-β1 expression was mild in the glomeruli (arrows) and proximal tubules (dotted arrows) and moderate in the distal tubules (thick arrows). (iNOS and TGF-β1 × 400). (f,l) Representative area percentages of iNOS and TGF-β1 reactions in the different groups (n = 8). P values were considered significant at p < 0.05 via ANOVA followed by a post hoc test. *Versus control, # versus MetS, @ versus MetS + Cranberry 50, & versus metformin.

References

    1. Bruce, K. D. & Hanson, M. A. The developmental origins, mechanisms, and implications of metabolic syndrome. J. Nutr.140 (2010). - PubMed
    1. Tarry-Adkins, J. L., Grant, I. D., Ozanne, S. E., Reynolds, R. M. & Aiken, C. E. Efficacy and side effect profile of different formulations of metformin: A systematic review and Meta-Analysis. Diabetes Therapy12, (2021). - PMC - PubMed
    1. Aharaz, A. et al. Risk of lactic acidosis in type 2 diabetes patients using metformin: A case control study. PLoS One13, (2018). - PMC - PubMed
    1. Šedbarė, R., Sprainaitytė, S., Baublys, G., Viskelis, J. & Janulis, V. Phytochemical Composition of Cranberry (Vaccinium oxycoccos L.) Fruits Growing in Protected Areas of Lithuania. Plants12, (2023). - PMC - PubMed
    1. Xue, L., Liu, C., Ma, H., Seeram, N. P. & Neto, C. C. Anti-inflammatory activities of cranberry fruit extracts in human THP-1 monocytes are influenced by their phytochemical composition. ACS Food Sci. Technol.2, (2022).

MeSH terms

LinkOut - more resources