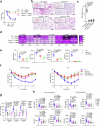
. 2025 Oct;26(10):1660-1672.
doi: 10.1038/s41590-025-02280-x. Epub 2025 Sep 15.

Delaying pyroptosis with an AI-screened gasdermin D pore blocker mitigates inflammatory response

Affiliations

Delaying pyroptosis with an AI-screened gasdermin D pore blocker mitigates inflammatory response

Jianhui Sun et al. Nat Immunol. 2025 Oct.

Abstract

The formation of membrane pores by cleaved N-terminal gasdermin D (GSDMD-NT) results in the release of cytokines and inflammatory cell death, known as pyroptosis. Blocking GSDMD-NT pores is an attractive and promising strategy for mitigating inflammation. Here we demonstrate that SK56, an artificial intelligence-screened peptide, effectively obstructs GSDMD-NT pores and inhibits pyroptosis and cytokine release in macrophages and human peripheral blood leukocyte-induced pyroptosis. SK56 prevents septic death induced by lipopolysaccharide or cecal ligation and puncture surgery in mice. SK56 does not influence cleavage of interleukin-1β or GSDMD. Instead, SK56 inhibits the release of cytokines from pyroptotic macrophages, mitigates the activation of primary mouse dendritic cells triggered by incubation with pyroptotic cytomembranes and prevents widespread cell death of human alveolar organoids in an organoid-macrophage coculture model. SK56 blocks GSDMD-NT pores on lipid-bilayer nanoparticles and enters pyroptotic macrophages to inhibit mitochondrial damage. SK56 presents new therapeutic possibilities for counteracting inflammation, which is implicated in numerous diseases.


Conflict of interest statement

Competing interests: The authors declare no competing interests.

Figures

Fig. 1
Fig. 1. Peptide screening using the Transformer model to identify GSDMD-NT pore blockers.
a, Workflow showing the modifications to the Transformer model, which involve the splitting and processing of input and output data and the use of atomic-level information of the interface, including coordinates, charge and atom type as input. b, Flow chart of data extraction and processing for interaction atomic training data showing how ~20,000 pairs of protein complex data from the PDB database were used to extract atoms at interaction interfaces (distance of ≤4 Å), calculate charge using a force field (ff14SB) and perform model training. c, Schematic showing how a slightly modified Transformer model as in a was used for interference peptide design in the target surface region of GSDMD-NT (PDB ID: 6VFE; this model was selected to obtain the atomic coordinates on the surface). Charges were calculated using a force field (ff14SB), combined with the atomic coordinates, typed into a matrix and used as the input of the model after removing hydrogen atom information. The model outputs the atomic coordinates, charges and types of the theoretical interaction interface corresponding to the input surface and uses the interface atomic information to perform a point registration search (coherent point drift) in the precomputed charge scaffold database. Scaffolds with higher scores obtained from the search were optimized using the Rosetta FastDesign module for residue optimization to obtain peptides that interact with the target protein.
Fig. 2
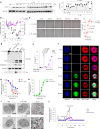
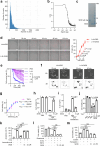
Fig. 2. SK56 delays pyroptosis and IL-1β release and prevents mitochondrial damage without affecting cleavage of GSDMD or IL-1β.
a, Immunoblots (left) and quantification (right) of IL-1β release in THP-1 cells differentiated with 120 nM PMA and treated with PBS, 1 μg ml−1 LPS + 5 mM ATP (L + A), 1 μg ml−1 LPS + 10 μM nigericin (L + N), 30 μM DSF or 15 μM of 12 candidate peptides (1–12; SK56 is peptide 11) at 2 h after the addition of LPS + nigericin; n = 3 repeats. b, ELISA of IL-1β and IL-18 release from THP-1 cells treated with DSF or peptides 1–12 in the presence of LPS + nigericin as in a. The red arrow indicates SK56 (peptide 11); n = 4 repeats; purple, **P = 8 × 10−7; black, **P = 1 × 10−8. c, Representative images from live-cell imaging experiments (see Supplementary Video 1; left) and the percentage of PI+ cells (right) among THP-1 cells incubated with LPS + nigericin + PBS or LPS + nigericin + SK56 (L + N + SK56; 15 µM) at 0, 20, 40, 60 and 80 min after the addition of LPS + nigericin; scale bar, 50 µm; n = 3 repeats. d,e, Representative immunoblotting of IL-1β and GSDMD cleavage (d; n = 2 repeats) and quantification of IL-1β release (e; n = 4 repeats) in THP-1 cells incubated with PBS or 1 μg ml−1 LPS + 10 μM nigericin together with 100 µM Z-VAD-fmk, PBS or 15 µM SK56 (d) or PBS, LPS or LPS + nigericin together with 100 µM Z-VAD-fmk or 0.6, 1.6, 5 and 15 µM SK56 (e) for 2 h. Sup, supernatant. fh, Representative images from live-cell imaging (see Supplementary Video 3; f) and relative fluorescence intensity of MitoTracker (MT; g) or SYTOX (h) in THP-1 cells incubated with 15 µM SK56–FITC at 0, 20, 30, 40, 50, 60 and 80 min after the addition of LPS + nigericin as in a; scale bar, 50 µm; n = 3 repeats. i, Representative TEM image showing mitochondrial morphology (arrows) in PMA-differentiated THP-1 cells treated with PBS, 15 µM SK56, LPS + nigericin or LPS + nigericin + 15 µM SK56 for 1.5 h; scale bar, 500 nm; n = 3 repeats. j, Real-time single-cell biochemistry showing ROS generation in THP-1 cells treated with 1 μg ml−1 LPS at 0 min, 10 μM nigericin at 30 min, and PBS, SK56 or DSF at 0 min. DCFH-DA is a ROS indicator. Data in ac, e and g were analyzed by two-tailed Student’s t-test and are shown as mean ± s.d. Source data
Fig. 3
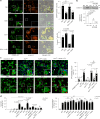
Fig. 3. SK56 inhibits pyroptosis by directly targeting GSDMD pore function.
a, Representative TEM images of cytomembranes from THP-1 cells (top) and representative biolayer interferometry traces from biotin–SK56 (bottom) incubated with PBS, 1 μg ml−1 LPS or 1 μg ml−1 LPS + 10 μM nigericin (top) or PBS, GSDMD-NT protein or cytomembranes from THP-1 cells incubated with PBS (CPBS), 1 μg ml−1 LPS (CLPS) or 312 nM–5 μM LPS + nigericin (CL + N) for 2 h (n = 2 repeats); scale bar, 200 nm. b, GSDMD immunoblotting of immunoprecipitated SUMO–SK56 in THP-1 cells treated with LPS + nigericin as in a; n = 2 repeats; IB, immunoblot; IP, immunoprecipitate. c, Representative live-cell images of mouse wild-type BMDMs transfected with BFP–GSDMD-NT or GSDMD-CT–BFP plasmids and incubated with 15 µM FITC–SK56 at 0, 40 and 80 min after LPS + nigericin treatment; scale bar, 2 µm. Arrowheads indicate colocalization; n = 2 cells. d, MST showing the binding affinity of SK56 to mature GSDMA–GSDME (n = 1 repeat). e,f, Representative images (e) and quantification of fluorescence (f) in PDA nanoparticle hydrogel incubated with PBS, 15 µM SK56, 5 μg ACE2 or 1 μM GSDMD-NT for 45 min or 1 μM GSDMD-NT for 30 min and then incubated with 15 μM SK56 for an additional 15 min; scale bar, 70 µm; n = 3 repeats. g, Cell viability in THP-1 cells incubated with PBS, 1 μg ml−1 LPS or LPS + nigericin in addition to PBS, 1.5 µM SK56 or 1.5 µM SK56 mutant peptides for 120 min; n = 4 repeats. h, Docking assay showing SK56–GSDMD-NT interaction. Critical residues (Arg 22–Glu 174 electrostatic interaction, Met 29–Pro 103 hydrophobic interaction and Tyr 26–Thr 63 hydrogen bond) are indicated. i, Proteomic analysis showing differentially expressed proteins (DEPs) in THP-1 cells treated with PBS, LPS + nigericin or LPS + nigericin + 15 µM SK56 for 90 min; n = 3 samples. Data in f and g were analyzed by two-tailed Student’s t-test and are shown as mean ± s.d. Source data
Fig. 4
Fig. 4. SK56 inhibits pyroptosis by ESCRT and reduces DC phagocytosis of the pyroptotic cytomembrane and IL-1β release.
a, Representative images of CHMP4–GFP puncta (arrowheads; left) and percentage of CHMP4 speckle+ (top right) or Annexin V+ (bottom right) cells in BMDMs incubated with PBS, 15 µM SK56, 2 mM EDTA or EDTA + SK56 at 2 h after the addition of 1 μg ml−1 LPS + 10 μM nigericin; scale bar, 50 µm; n = 5 repeats. b, Immunoblots (top) and quantification (bottom) showing GSDMD-NT in the supernatant from THP-1 cells treated with PBS, 30 µM DSF, 15 µM SK56 or 15 µM SK56 at 120 min after LPS + nigericin treatment; n = 3 repeats. c, Representative images (left) and percentage of GSDMD-NT–BFP/cytomembrane-CellMask Orange+ (right) cells in calcein-AM-labeled (green) mouse wild-type BMDCs incubated with 2 μg ml−1 pyroptotic cytomembrane fragments from mouse wild-type BMDMs transfected with a GSDMD-casp–BFP construct and incubated with LPS + nigericin (PCFBFP), 20 µM SK56 (PCFBFP + SK56) or 20 µM SK56scrambled (synthetic SK56 scrambled peptide; PCFBFP + SK56scrambled), pyroptotic cytomembrane fragments from mouse Gsdmd−/− BMDMs incubated with LPS + nigericin and PBS (PCFGsdmd−/−), cytomembranes from wild-type BMDMs incubated with PBS (NCF) or pyroptotic cytomembrane fragments from mouse BMDMs incubated with LPS + nigericin and 10 µg ml−1 BFP (PCF + BFP), 10 µg ml−1 GSDMD-NT–BFP or 10 µg ml−1 BFP for 2 h; green, calcein-AM+ BMDCs; red, CellMask Orange+ NCF, PCF or PCFGsdmd−/−; blue, GSDMD-NT–BFP, BFP or PCFBFP. The white arrow indicates cytomembrane outside BMDCs, and the red arrow indicates phagocytosed cytomembrane; scale bar, 25 μm; n = 3 repeats. d, ELISA of secreted (left) and cell-associated (right) IL-1β from wild-type BMDCs treated with PBS, 10 μg ml−1 BFP, 1 μg ml−1 GSDMD-NT, 20 µM SK56, SK56 + GSDMD-NT, 120 µM oxPAPC, SK56 + oxPAPC or 2 μg ml−1 pyroptotic cytomembrane fragments from mouse wild-type or Gsdmd−/− BMDMs as in c (NCF, PCF, PCF + SK56, PCFGsdmd−/−, PCFGsdmd−/− + SK56), treated or not treated with Pam3 for 12 h; n = 4 repeats. All data are shown as mean ± s.d., and P values were determined by two-tailed Student’s t-test; NS, not significant (P > 0.05). Source data
Fig. 5
Fig. 5. SK56 protects human alveolar organoids and blood leukocytes from pyroptosis-induced damage.
a, Representative images from live-cell imaging (see Supplementary Video 4; left) and relative PI stain intensity (top right) and calcein-AM staining (bottom right) in human alveolar organoids (calcein-AM+, green) cocultured with GSDMD-casp–BFP-transfected THP-1 cells treated with LPS + nigericin and incubated with PBS, 30 µM DSF, 25 µM DMF, 20 µM NSA or 15 μM SK56 at 0.5, 4, 8, 12 and 16 h after treatment with LPS + nigericin; scale bar, 40 μm; n = 3 repeats. b, Representative H&E staining (top) and percentage of the infiltration area (bottom) in fixed alveolar organoids + THP-1 cell cocultures as in a treated with PBS or LPS + nigericin together with PBS (L + N + PBS) or 15 μM SK56 at 8 h after the addition of LPS + nigericin; scale bar, 75 μm; n = 5 repeats. c, ELISA showing IL-1β release in the supernatant of alveolar organoids + THP-1 cell cocultures as in a treated with PBS, 15 μM SK56 or LPS + nigericin together with PBS or 15 μM SK56 or at 12 h after LPS + nigericin treatment; n = 4 repeats. d, Representative images (left) and percentage relative to DAPI+ cells (right) of GSDMD-NT+ (green) cells in human blood leukocytes incubated with PBS or LPS + nigericin together with PBS or 15 μM SK56 at 1 h after nigericin + LPS treatment; n = 20 repeats. e, Representative immunoblots of IL-1β and GSDMD-NT in whole human blood leukocytes treated as in d; n = 3 repeats. f, Heat map illustrating inflammatory cytokine profiles in whole human blood treated with normal saline (NSal) and LPS + nigericin together with normal saline (L + N + NS) or 15 μM SK56; *P < 0.05 L + N + SK56 versus L + N + NS, n = 4 samples. Data are shown as mean ± s.d., and P values were calculated by two-tailed Student’s t-test; *P < 0.05. Source data
Fig. 6
Fig. 6. SK56 improves survival in LPS-induced sepsis in mice.
a, Kaplan–Meier analysis of survival in wild-type (WT) and Gsdmd−/− mice challenged i.p. with 15 mg per kg (body weight) LPS and treated with normal saline, SK56 (1 mg per kg (body weight) i.v.) or 50 mg per kg (body weight) DSF, 50 mg per kg (body weight) DMF or 20 mg per kg (body weight) NSA i.p. at 16 h after LPS injection; n = 10 mice per group. b, Blood AST, BUN, ALT and CK levels in wild-type and Gsdmd−/− mice treated as in a at day 2 after LPS injection; n = 6 mice. c, Heat map displaying the expression of cytokines in the plasma of wild-type and Gsdmd−/− mice treated with normal saline or SK56 as in a at day 2 after LPS injection; n = 10 mice. d, Kaplan–Meier analysis of survival in wild-type mice challenged with 25 mg per kg (body weight) LPS i.p. and treated with SK56 (2 mg per kg (body weight) i.v.) or 50 mg per kg (body weight) DSF, 50 mg per kg (body weight) DMF or 20 mg per kg (body weight) NSA i.p. at 5 h after LPS injection; n = 20 mice per group. e, ELISA showing plasma expression of IL-1β every 3 h up to 48 h after LPS i.p. injection in wild-type mice treated with normal saline or SK56 (2 mg per kg (body weight) i.v.) as in d. f, Kaplan–Meier analysis of survival in wild-type mice challenged with 50 mg per kg (body weight) LPS i.p. and treated with normal saline, SK56 (4 mg per kg (body weight) i.v.) or 50 mg per kg (body weight) DSF, 50 mg per kg (body weight) DMF or 20 mg per kg (body weight) NSA i.p. at 4 h after LPS injection; n = 20 mice per group. g, ELISA showing plasma expression of IL-1β every 3 h up to 48 h after LPS i.p injection in mice treated with normal saline or SK56 as in f. Data in b, e and g were analyzed by two-tailed Student’s t-test and are shown as mean ± s.d. Data in a, d and f were analyzed by log-rank (Mantel–Cox) test. Arrows indicate treatment time.
Extended Data Fig. 1
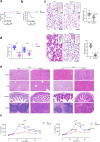
Extended Data Fig. 1. GSDMD deficiency protects mice from sepsis-induced organ damage.
a-b, Kaplan–Meier analysis of survival rates in wild-type (WT) C57BL/6 and Gsdmd−/− mice (n = 10 mice per group) challenged with LPS (15 mg/kg i.p., a) and cecal ligation and puncture (CLP) surgery (b). c, Pathology assay showing representative lung H&E staining (upper left) and lung injury scores (upper right, n = 15 samples) from WT and Gsdmd−/− mice 2 days post-LPS (15 mg/kg i.p.) treatment. representative lung H&E staining (lower left) and pathology scores (lower right, n = 16 samples) in WT and Gsdmd−/− mice 2 days post-CLP. Scale bars 1 mm (overview), 50 µm (zoomed-in). d, Pathology assay showing kidney injury scores in WT and Gsdmd−/− mice 2 day after LPS (15 mg/kg i.p. n = 15 samples) or CLP (n = 16 samples). e, Representative H&E staining showing kidney, liver, intestine and spleen in WT and Gsdmd−/− mice at 2 day post-LPS or CLP. n = 10 mice. f, ELISA assay showing IL-1β levels in blood from WT and Gsdmd−/− mice after LPS (left) or CLP (right). n = 3 samples. Data in c, d and f were analyzed using two-tailed Student’s t-test; NS (P > 0.05, not significant); means ± s.d. Data in a, b were analyzed by log-rank (Mantel-Cox) test.
Extended Data Fig. 2
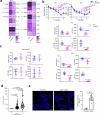
Extended Data Fig. 2. GSDMD deficiency reduces systemic inflammation and is activated in sepsis patients.
a, Heat map showing inflammatory cytokine profiles in peripheral blood of WT and Gsdmd−/− mice (n = 10 samples) at 2 days post LPS (15 mg/kg i.p.) or CLP. b, Changes in body weight of WT and Gsdmd−/− mice after LPS (15 mg/kg i.p.) or CLP (n = 10 mice per group). c, Biochemistry assay showing serum enzyme activity in WT and Gsdmd−/− mice 2 days post-LPS or CLP (n = 6 samples). d, Clinical assay showing serum IL-1β levels in healthy volunteers (n = 88), mild sepsis (SOFA ≥ 2, n = 137), and severe sepsis (SOFA > 11, n = 26) patients. e, Immunofluorescence image (left) and percentage of GSDMD-NT stained cells (right) in whole blood leukocytes from healthy volunteers (n = 5) and sepsis patients (n = 16). Scale bar, 25 µm. All graphs in this figure present mean ± s.d., and P values were determined using two-tailed Student’s t-test, NS (P > 0.05, not significant).
Extended Data Fig. 3
Extended Data Fig. 3. SK56 inhibits pyroptosis in vitro.
a, The atom frequency distribution histogram of the number at the interface (with H) involved in nearly 40,000 pairs of interaction interfaces. About 90% of the interfaces involved in the PDB database contain fewer than 350 atoms. b, The variation in loss during model training (total of 153k steps). c, SDS-PAGE image showing the prokaryotic expression and purification of SK56 (including tag cleavage). d, Live-cell imaging showing pyroptosis-induced cell rupture delay in BMDM cells treated with or without SK56 (15 µM). n = 3 repeats. Scale bar, 50 µm. e, ATP assay showing concentration-dependent suppression of pyroptosis by SK56 in BMDM cells. n = 3 repeats. f, 3D imaging showing THP-1 cell pyroptosis treated with or without SK56. Scale bar, 20 µm. g-h, ATP assay showing IC50 of SK56 in classical pyroptosis pathway (g) in THP-1 cells or nonclassical pyroptosis pathway in BMDM cells (h) at 3 h post-induction. n = 3 repeats. i, ELISA results showing the release of IL-1β during nonclassical pyroptosis treated with or without SK56 in BMDM cells. n = 3 repeats. j-m, Cell death assays showing HT29 (j, necrosis, TSZ: TNF-α + SM-164 + Z-VAD-FMK, n = 3 repeats), RAW264.7 (k, apoptosis, n = 4 repeats), AC16 (l, cuproptosis, n = 3 repeats), and MDA-MB-231 (m, ferroptosis, n = 3 repeats) cell responses to SK56. All graphs present mean ± s.d., and P values were determined using two-tailed Student’s t-test, NS (P > 0.05, not significant).
Extended Data Fig. 4
Extended Data Fig. 4. SK56 targets GSDMD-NT pore during pyroptosis.
a, Live-cell imaging showing SYTOX uptake in pyroptotic cells with or without SK56 (15 µM), n = 3 views. Scale bars, 10 µm. b, Immunofluorescence image showing GSDMD-NT (red arrow) localization in THP-1 treated with SK56 (15 µM). n = 5 views. c, Caspase-1 activity results showing SK56 effect on caspase-1. n = 4 repeats. d, Live-cell imaging showing mitochondrial membrane potential in pyroptotic cells. n = 3 cells. Scale bars, 4 µm. e-f, Single-cell biochemical assays showing ROS (e) and ATP (f) changes in THP-1 cells during pyroptosis with SK56 (15 µM) or DSF (30 µM) (n = 4 cells). g, lactate dehydrogenase (LDH) assay showing LDH release in pyroptosis THP-1 cells with SK56 or disulfiram (30 µM) (n = 3 repeats). All graphs present mean ± s.d., and P values were determined using two-tailed Student’s t-test, *P < 0.05, **P < 0.01, NS (P > 0.05, not significant).
Extended Data Fig. 5
Extended Data Fig. 5. Structural analysis of SK56 interaction with the GSDMD-NT pore.
a, Polydiacetylene (PDA) nanoparticles solidified by hydrogel were used to determine if SK56 has a repairing effect on preformed holes. Schematic presentation of installing PDA nanoparticles in the network of Poly (ethylene glycol) diacrylate (PEGDA) hydrogel. PDA nanoparticles can be chemically linked to the network of PEGDA hydrogels by photocrosslinking PEGDA monomers and acrylamide-modified PDA nanoparticles via addition polymerization. NPs, nanoparticles. b, MD simulation depicting residue-wise MM-GBSA binding free energy decomposition for SK56-GSDMD-NT interaction. n = 1 run. c, Structural analysis showing SK56-induced surface charge alterations in GSDMD-NT acidic patches (AP1/AP3).
Extended Data Fig. 6
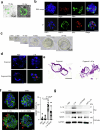
Extended Data Fig. 6. SK56 protects human alveolar organoid-macrophage co-cultures from pyroptosis.
a, Image showing LysoTracker+ alveolar type 2 cells in 15-day human alveolar organoids. b, RNA-scope/IF images showing alveolar type 1 (AQP5 or Aqp5) and alveolar type 2 (SPC or Sftpc) in 15-day organoids. n = 2 repeats, Scale bar 25 µm. c, Morphology assay showing growth progression of human alveolar organoids over 20 days. n = 1 repeat. d, Co-culture assay showing CM-DiI-labeled THP-1 derived macrophages (red) with organoids treated with 1 μg/ml LPS + 10 μM nigericin (L + N) or PBS for 4 hours. SYTOX+ pyroptotic macrophages or organoid cells compromise organoid integrity. n = 3 repeats. Hoechst 33342 (blue) is used to indicate nucleus. Scale bar, 25 µm. e, Histology assay showing H&E-stained organoids with or without PMA-differentiated THP-1 at 8 hours post-L + N added. n = 5 repeats. Scale bar, 75 µm. f, Representative immunofluorescence image showing GSDMD-NT membrane translocation (red arrow) in organoid-macrophage cocultures (12 hours post-inducing pyroptosis, n = 7 repeats). Scale bar, 25 µm. Graphs present mean ± s.d., and P values were determined using two-tailed Student’s t-test.g, Immunoblots of whole blood from healthy volunteers treated with PBS, SK56 or DSF 1 hour post L + N added. n = 3 repeats. Source data
Extended Data Fig. 7
Extended Data Fig. 7. SK56 inhibits cell death in human blood under pyroptosis condition.
Flow cytometry assay show changes in cell populations in peripheral blood samples from healthy volunteers (n = 7) and sepsis patients (n = 6; within 72 hours of sepsis confirmation). Blood from healthy volunteers was treated at 37 °C for 4 hours with 1 μg/ml LPS, 10 μM nigericin to induce pyroptosis, and DSF (disulfiram, 30 μM added 30 min before inducing pyroptosis). All graphs present mean ± s.d. Statistical significance was assessed using two-way ANOVA (NS, P > 0.05, no significance; *P < 0.05, **P < 0.01).
Extended Data Fig. 8
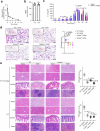
Extended Data Fig. 8. Pharmacokinetics and organ protection of SK56 in septic mice.
a, Serum concentrations of SK56 were measured following intravenous administration (i.v.) of 1 mg/kg SK56 in mice. n = 2 mice. b, Stability of SK56 in human whole blood was evaluated at 37 °C for 12 hours (n = 4 repeats). c, ELISA results showing plasma IL-1β dynamics in low-dose LPS (15 mg/kg, i.p.) sepsis mice with or without SK56 (n = 10 mice). The purple arrow indicates the time of SK56 administration. d, H&E-stained histopathological sections showing damage to lung tissues (2-day post-treatment) LPS-treated WT and Gsdmd−/− mice with or without SK56 (1 mg/kg i.v. n = 15 samples), along with the corresponding pathological score (right). Scale bars, 1 mm (whole section) and 50 µm (zoomed-in). e, H&E-stained histopathological sections illustrating damage to the kidneys, livers, intestines and spleens in WT or Gsdmd−/− mice treated with or without SK56 (1 mg/kg, i.v.), along with the pathological score (n = 30 in LPS; n = 27 samples in CLP) of the kidneys. All graphs show mean ± s.d., and P values were calculated using two-tailed Student’s t-test, NS (P > 0.05, not significant).
Extended Data Fig. 9
Extended Data Fig. 9. SK56 protects against sepsis induced by CLP.
a, Kaplan–Meier analysis of survival rates in WT and Gsdmd−/− mice challenged with CLP surgery and treated with SK56 (i.v. 1 mg/kg, 16 hours after CLP surgery) (n = 10 mice per group). b-c, Histopathology assay showing H&E-stained lung tissues (b) and pathological scores (c, n = 15 samples) in SK56-treated WT and Gsdmd−/− mice 2 days after CLP. Scale bars, 1 mm (whole section) and 50 µm (zoomed-in). d, Cytokine assay showing plasma cytokines level in SK56 treated or untreated CLP wild-type or Gsdmd−/− mice (n = 10 mice). e, Biochemistry assay indicating blood levels of organ damage markers in SK56 treated or untreated CLP mice (n = 6 mice). f, Body weight changes were monitored in mice subjected to LPS or CLP surgery with or without SK56 (n = 10 mice per group). g-h, SK56 and three GSDMD-NT pore formation inhibitors (DSF, disulfiram; DMF, dimethyl fumarate; NSA, necrosulfonamide) were evaluated for their impact on IL-1β levels (g) and biochemical markers (h) in LPS-treated mice blood (n = 10 mice). Data in c-e and g-h were analyzed using two-tailed paired Student’s t-test; NS (P > 0.05, not significant); means ± s.d. Data in a was analyzed by log-rank (Mantel-Cox) test.
Extended Data Fig. 10
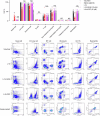
Extended Data Fig. 10. SK56 modulates immune cell populations in septic mice.
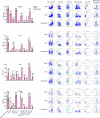
Flow cytometry assay showing immune cell populations changes in the spleen, lung, liver, and peripheral blood of LPS-treated mice with or without SK56 treatment (n = 5 mice). All graphs present mean ± s.d. Statistical significance was evaluated using two-way ANOVA (NS, P > 0.05, no significance; *P < 0.05).

References

    1. Ding, J. J. et al. Pore-forming activity and structural autoinhibition of the gasdermin family. Nature535, 111–116 (2016). - PubMed
    1. Shi, J. J. et al. Cleavage of GSDMD by inflammatory caspases determines pyroptotic cell death. Nature526, 660–665 (2015). - PubMed
    1. Evavold, C. L. et al. The pore-forming protein gasdermin D regulates interleukin-1 secretion from living macrophages. Immunity48, 35–44 (2018). - PMC - PubMed
    1. Heilig, R. et al. The gasdermin-D pore acts as a conduit for IL-1β secretion in mice. Eur. J. Immunol.48, 584–592 (2018). - PubMed
    1. Degen, M. et al. Structural basis of NINJ1-mediated plasma membrane rupture in cell death. Nature618, 1065–1071 (2023). - PMC - PubMed

MeSH terms

LinkOut - more resources