. 2025 Jul 29;135(18):e178446.
doi: 10.1172/JCI178446. eCollection 2025 Sep 16.

Elevated NR2F1 underlies the persistence of invasive disease after treatment of BRAF-mutant melanoma

Affiliations

Elevated NR2F1 underlies the persistence of invasive disease after treatment of BRAF-mutant melanoma

Manoela Tiago et al. J Clin Invest. .

Abstract

Despite the success of targeted inhibitors in cutaneous melanoma, therapeutic responses are limited by the aged tumor microenvironment and drug-tolerant residual cells. Given the similarities between drug tolerance and cellular dormancy, we studied the dormancy marker, nuclear receptor subfamily 2 group F member 1 (NR2F1), in response to BRAF-V600E inhibitors (BRAFi) plus MEK inhibitors (MEKi) in BRAF-mutant melanoma models. Transcriptomic analysis of melanoma patient samples treated with BRAFi + MEKi showed increased NR2F1. NR2F1 was highly expressed in the drug-tolerant invasive cell state of minimal residual disease in patient-derived and mouse-derived xenografts on BRAFi + MEKi. NR2F1 over-expression was sufficient to reduce BRAFi + MEKi effects on tumor growth in vivo, and cell proliferation, death, and invasion in vitro. Effects were linked to genes involved in mTORC1 signaling. These cells were sensitive to the combination of BRAFi, MEKi plus rapamycin. Melanomas from aged mice, known to exhibit decreased responses to BRAFi + MEKi, displayed higher levels of NR2F1 compared to tumors from young mice. Depleting NR2F1 in an aged mouse melanomas improved the response to targeted therapy. These findings show high NR2F1 expression in 'invasive-state' residual cells and that targeting NR2F1-high cells with mTORC1 inhibitors may improve outcomes in patients with melanoma.

Keywords: Drug therapy; Melanoma; Oncology; Therapeutics.


Conflict of interest statement

Conflict of interest: AEA has ownership interest in patent number 9880150. JAAG is a scientific co-founder, scientific advisory board member, and equity owner of HiberCell and receives financial compensation as a consultant for HiberCell, a Mount Sinai spin-off company focused on the research and development of therapeutics that prevent or delay the recurrence of cancer. MAD has been a consultant to Roche/Genentech, Array, Pfizer, Novartis, Bristol Myers Squibb (BMS), GSK, Sanofi-Aventis, Vaccinex, Apexigen, Eisai, Iovance, Merck, and ABM Therapeutics; and he has been the principal investigator of research grants to MD Anderson by AstraZeneca, Roche/Genentech, GSK, Sanofi-Aventis, Merck, Myriad, Oncothyreon, Pfizer, ABM Therapeutics, and LEAD Pharma. ATW is on the board of ReGAIN therapeutics. DAE has ownership interest in patent number US20200164054A1.

Figures

Figure 1
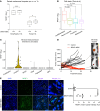
Figure 1. NR2F1 is highly expressed in melanoma lesions of patients on BRAFi + MEKi therapy.
(A) Normalized expression of NR2F1 for baseline or before treatment (Pre) and early during treatment (On) tumor samples from patients who received BRAFi + MEKi combination therapy in datasets from Song et al. (32) and Kwong et al. (30). (B) Box plot of NR2F1 RNA-Seq gene expression data for melanoma cell lines categorized across cell states according to the dataset from Tsoi et al. (33). (C) Violin plot of NR2F1 expression levels by cell state in a scRNA-Seq dataset of PDX melanoma following BRAFi + MEKi treatment, according to data from Rambow et al. (12). Cell types present during MRD are shown. NCSC, neural crest stem cell; SMC, “starved-like” melanoma cell. (D) Tumor volume in mice bearing 1205Lu-tdTomato–labeled xenografts following continuous BRAFi + MEKi (PLX4720 200 ppm + PD0325901 7 ppm) for 3 weeks. (E) Representative images of detection of tdTomato fluorescence representing tumor size in xenografts after 3 weeks on BRAFi + MEKi therapy and plot showing the mean nuclear intensity of NR2F1 protein expression in 1205Lu-tdTomato cells by immunofluorescence of tumor xenografts compared with the no-drug-treatment control group. Scale bars: 100 µm. Data are presented as the mean ± SD. *P < 0.05 and ***P < 0.001, by unpaired, 2-tailed Student’s t test.
Figure 2
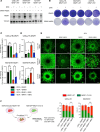
Figure 2. NR2F1 overexpression minimizes tumor inhibition effects by BRAFi and MEKi therapy.
(A) NR2F1 protein levels in human BRAF-mutant melanoma cell lines expressing DOX-inducible NR2F1, 1205LuTR-NR2F1, WM793TR-NR2F1, and A375TR-NR2F1 after 72 hours of treatment using BRAFi + MEKi + DOX (1 μmol/L PLX4720 + 35 nmol/L PD0325901 + 100 ng/mL DOX). (B) Colony assay for cell lines overexpressing DOX-inducible NR2F1 after 1 week of treatment using BRAFi + MEKi + DOX. Original magnification, ×20. (C) Detection of S-phase cell-cycle arrest following EdU staining for the BRAF-mutant human melanoma cell lines listed above after 72 hours of treatment with BRAFi + MEKi + DOX. *P < 0.05, by Tukey’s test. (D) PI uptake over cell confluence in the BRAF-mutant human melanoma cell lines listed above after 72 hours of treatment with BRAFi + MEKi + DOX as determined by IncuCyte analysis. *P < 0.05 and **P < 0.01, by Tukey’s test. (E) Representative images of 3D tumor spheroids of the human BRAF-mutant melanoma cell lines 1205LuTR-NR2F1, WM793TR-NR2F1, and A375TR-NR2F1 after 72 hours of treatment with BRAFi + MEKi + DOX (1 μmol/L PLX4720 + 35 nmol/L PD0325901 + 100 ng/mL DOX). 3D tumor spheroids were stained with calcein-AM (7 μmol/L) for cell viability evaluation. Scale bars: 100 μm. (F) Scheme of coculturing of tdTomato cells overexpressing DOX-inducible NR2F1 WT (94) and GFP cells overexpressing a DOX-inducible dominant-negative form of NR2F1 (38) harboring a C141S point mutation within its DNA-binding domain (C141S). Cells were mixed at a ratio of 1:1 and then cocultured for 72 hours with or without BRAFi + MEKi + DOX (1 μmol/L PLX4720 + 35 nmol/L PD0325901 + 100 ng/mL DOX). Cocultures from F were collected and analyzed by FACS for tdTomato and GFP positivity. (G) The percentage of tdTomato and GFP positivity was compared with DMSO. **P < 0.01 and ***P < 0.001, by 2-way ANOVA. Data are presented as the mean ± SD.
Figure 3
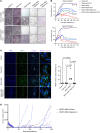
Figure 3. NR2F1 overexpression promotes tumor relapse following BRAF and MEK inhibitors therapy.
(A) IncuCyte live-cell analysis for DOX-inducible cells overexpressing NR2F1 after 4 weeks of treatment using BRAFi + MEKi + DOX (1 μmol/L PLX4720 + 35 nmol/L PD0325901 + 100 ng/mL DOX). Data show the percentage of cell confluence on the plate. (B) NR2F1 protein levels for the DOX-inducible NR2F1-expressing cell line 1205Lu-E2F-tdTomato(tdTW)-TR-NR2F1 after 72 hours of treatment with BRAFi + MEKi + DOX. (C) In vivo tumor growth curves and (D) survival of 1205Lu xenografts with DOX-inducible NR2F1 expression following BRAFi + MEKi (200 ppm PLX4720 + 7 ppm PD0325901 + 25 mg/mL DOX) treatment. ***P < 0.001 and ****P < 0.0001, by Kaplan-Meier analysis.
Figure 4
Figure 4. NR2F1 overexpression upregulates cell proliferation and mTORC1 signaling following BRAFi + MEKi therapy.
(A) Heatmap showing GSEA normalized enrichment scores (NES) for the hallmark gene set collection comparing NR2F1 expression with no DOX after 72 hours of treatment with BRAFi + MEKi + DOX (1 μmol/L PLX4720 + 35 nmol/L PD0325901 + 100 ng/mL DOX) in 1205LuTR-NR2F1, WM793TR-NR2F1, and A375TR-NR2F1 cell samples. NES values are displayed for enriched gene sets using a Benjamini-Hochberg FDR (BHFDR) cutoff of 0.05. (B) GSEA hallmark enrichment plots showing the mTORC1 response for the same cells and drug treatments as in A. (C) RPPA analysis of the BRAF-mutant human melanoma cell lines 1205LuTR-NR2F1 after 72 hours of treatment with BRAFi + MEKi + DOX. Results indicate the median-centered, log2-transformed group average RPPA expression data for targets with at least 25% change when comparing NR2F1 expression with no DOX after 72 hours of treatment. (D) Representative Western blot of the RPPA-identified proteins in C after treatment with BRAFi + MEKi for 72 hours (n = 2–3). Quantification of the band densitometry (phosphorylated proteins vs. total protein [e.g., RB (pS780)/RB] normalized to no BRAFi + MEKi + no-DOX conditions] is displayed under each band. Note that the NR2F1 blot is the same here and in Supplemental Figure 4A. (E) Heatmap showing hierarchical clustering of commonly enriched genes in mTORC1 GSEA results for all 3 cell line comparisons of BRAFi + MEKi + DOX. (F) MACS2 fold enrichment values are displayed for genes with NR2F1 ChIP-Seq binding in their promoter region (n = 17; each ChIP-Seq experiment is represented by a dot) from the genes in E.
Figure 5
Figure 5. Rapamycin targets NR2F1-overexpressing drug-tolerant cells and delays tumor growth.
(A) Colony assay for cell lines overexpressing DOX-inducible NR2F1 after 1 week of treatment with BRAFi + MEKi + mTORC1i (either 1 μmol/L AZD2014 or 1 μmol/L rapamycin). Original magnification, ×20. (B) IncuCyte live-cell analysis for DOX-inducible cells overexpressing NR2F1 after 4 weeks of treatment using BRAFi + MEKi + DOX. Cell growth was analyzed for percentage of cell confluence on the plate (representative of three independent experiments). (C) Images show the expression of NR2F1 in the MRD state following BRAFi + MEKi + rapamycin treatment (4 mg/kg) in vivo. Results are for mice bearing 1205Lu-tdTomato–labeled xenografts following continuous BRAFi + MEKi chow (200 ppm PLX4720 + 7 ppm PD0325901) for 3 weeks and then either control chow + vehicle (control), control chow + 4 mg/kg rapamycin (rapamycin), BRAFi + MEKi chow + vehicle (BRAFi + MEKi), or BRAFi + MEKi chow + rapamycin (BRAFi + MEKi + rapamycin) for 1 week. Plot on the right shows the mean nuclear intensity of NR2F1 protein expression in MRD tumor xenografts by immunofluorescence compared with the control. Statistical significance was determined by 2-way ANOVA. (D) Tumor volume results for mice bearing 1205Lu-tdTomato–labeled xenografts following continuous treatment with BRAFi + MEKi chow (200 ppm PLX4720 + 7 ppm PD0325901) until the tumors entered a state of MRD for several weeks (day 52 after BRAFi + MEKi), and were then given either continuous BRAFi + MEKi chow + vehicle (BRAFi + MEKi) or continuous BRAFi + MEKi chow + 4 mg/kg rapamycin twice per week (BRAFi + MEKi + rapamycin) for the duration of the experiment (treatment start indicated with dotted line on x axis). Tumor growth of the treated mice is shown. An “X” on a tracing denotes an animal that was euthanized for nonexperimental reasons. Data indicate the mean ± SD.
Figure 6
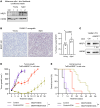
Figure 6. NR2F1 is overexpressed in aged BRAF-mutant melanoma models.
(A) NR2F1 protein expression in cells cultured in CM derived from fibroblasts isolated from young (<35 years old) and aged (>55 years old) individuals and (B) YUMM1.7 tumor allografts from young versus aged mice stained for NR2F1, with quantification of the percentage of positively stained nuclei using ImageJ (NIH). Original magnification, ×100. (C) NR2F1 inhibition by lentiviral DOX-inducible expression of an shRNA targeting NR2F1 (tumors in both groups were >500 mm3 in size). (D) In vivo tumor growth curves (**P = 0.004127, comparing BRAFi + MEKi alone with BRAFi + MEKi + DOX). (E) Survival of animals with YUMM1.7 allografts with DOX-inducible shRNA targeting NR2F1 following BRAFi + MEKi + DOX (200 ppm PLX4720 + 7 ppm PD0325901 + 25 mg/mL DOX) treatment. **P = 0.004, by Kaplan-Meier analysis. Data are presented as the mean ± SD.
Figure 7
Figure 7. Role of NR2F1 in the persistence of MRD in melanoma.
BRAFi + MEKi–tolerant persister cells express NR2F1 during MRD. NR2F1-overexpressing cells show upregulation of the mTORC1 pathway. Knockdown of NR2F1 or mTORC1 pathway inhibition delays tumor recurrence in cutaneous melanoma.

Comment in

  • NR2F1 and mTORC1 provide the bridge between melanoma dormancy and therapeutic resistance doi: 10.1172/JCI197764

References

    1. Michielin O, et al. Evolving impact of long-term survival results on metastatic melanoma treatment. J Immunother Cancer. 2020;8(2):e000948. doi: 10.1136/jitc-2020-000948. - DOI - PMC - PubMed
    1. Bhave P, et al. Melanoma recurrence patterns and management after adjuvant targeted therapy: a multicentre analysis. Br J Cancer. 2021;124(3):574–580. doi: 10.1038/s41416-020-01121-y. - DOI - PMC - PubMed
    1. Savoia P, et al. Clinical implications of acquired BRAF inhibitors resistance in melanoma. Int J Mol Sci. 2020;21(24):9730. doi: 10.3390/ijms21249730. - DOI - PMC - PubMed
    1. Fane M, Weeraratna AT. How the ageing microenvironment influences tumour progression. Nat Rev Cancer. 2020;20(2):89–106. doi: 10.1038/s41568-019-0222-9. - DOI - PMC - PubMed
    1. Bragado P, et al. Microenvironments dictating tumor cell dormancy. Recent Results Cancer Res. 2012;195:25–39. doi: 10.1007/978-3-642-28160-0_3. - DOI - PMC - PubMed

MeSH terms