. 2025 Sep 16;135(18):e193521.
doi: 10.1172/JCI193521.

Double-positive T cells form heterotypic clusters with circulating tumor cells to foster cancer metastasis

Affiliations

Double-positive T cells form heterotypic clusters with circulating tumor cells to foster cancer metastasis

David Scholten et al. J Clin Invest. .

Abstract

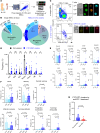
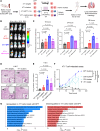
The immune ecosystem is central to maintaining effective defensive responses. However, it remains largely understudied how immune cells in the peripheral blood interact with circulating tumor cells (CTCs) in metastasis. Here, blood analysis of patients with advanced breast cancer revealed that over 75% of CTC-positive blood specimens contained heterotypic CTC clusters with CD45+ white blood cells (WBCs), which correlates with breast cancer subtypes, racial groups, and decreased survival. CTC-WBC clusters included overrepresented T cells and underrepresented neutrophils. Specifically, a rare subset of CD4 and CD8 double-positive T (DPT) cells was 140-fold enriched in CTC clusters versus their frequency in WBCs. DPT cells shared properties with CD4+ and CD8+ T cells but exhibited unique features of T cell exhaustion and immune suppression. Mechanistically, the integrin heterodimer α4β1, also named very late antigen 4 (VLA-4), in DPT cells and its ligand, VCAM1, in tumor cells are essential mediators of DPT-CTC clusters. Neoadjuvant administration of anti-VLA-4 neutralizing antibodies markedly blocked CTC-DPT clusters, inhibited metastasis, and extended mouse survival. These findings highlight a pivotal role of rare DPT cells in fostering cancer dissemination through CTC clustering. It lays a foundation for developing innovative biomarker-guided therapeutic strategies to prevent and target cancer metastasis.

Keywords: Breast cancer; Clinical Research; Diagnostics; Immunology; Oncology; T cells.


Conflict of interest statement

Conflict of interest: HL, DF, and ADH are scientific co-founders and equity shareholders of Exomira Medicine Inc., whose business is not currently related to the content of this manuscript. MC has the following financial relationships to disclose: (a) serving as consultant for AZ, Celcuity, Menarini-Stemline, Repare Therapeutics, Olaris, Syantra, BriaCell, Datar Cancer Genomics, and Biotheryx; (b) received a grant or research support from AZ and Celcuity; (c) received honoraria from AZ, Merck, Iylon, Menarini Silicon Biosystem, and Datar Cancer Genomics; and (d) participated in the Pfizer speaker bureau.

Figures

Figure 1
Figure 1. CTC frequencies in the blood biopsies of breast cancer patients and their clinical associations.
(A) Top: Schematic of CTC analysis via CellSearch with blood specimens drawn from patients with breast cancer (n = 1,529). Bottom: Representative CellSearch images of single CTC (left), homotypic CTC-CTC cluster (middle), or heterotypic CTC-WBC cluster (right) with merge channels of CK (green) and DAPI (magenta) as well as a single CD45 channel. Scale bars: 10 μm. (B) Frequency of CellSearch-detected CTC+ tests/scans (≥5 CTCs within 7.5 mL blood) among breast cancer patient biopsies (left; n = 1,529) and frequencies of homotypic CTC-CTC clusters (middle) and heterotypic (right) CTC-WBC clusters among CTC+ biospecimens (n = 661). (C) Counts of single CTCs and homotypic and heterotypic CTC clusters per 7.5 mL blood in 1,529 CellSearch tests. The range, mean, and median are 0–17,427; 47; and 0 for single CTCs; 0–2,265; 3; and 0 for homotypic clusters; and 0–1,017; 6; and 2 for heterotypic clusters. ****P < 0.0001 for any 2-group comparison using Wilcoxon’s matched-pair signed rank test. (D) Cox proportional hazard model odds ratio plot with 95% CI for risk of single CTCs (black), homotypic CTC-CTC clusters (red), and heterotypic CTC-WBC clusters (blue) among subtypes of breast cancer and self-identified racial groups of the patients. Filled squares highlight significant features calculated using Wald’s test (P < 0.05). (E) Scatter plots of single versus homotypic clusters and single versus heterotypic clusters with Pearson’s correlation coefficient and 2-tailed P value. (F) Kaplan-Meier survival curves of patients positive for single CTCs (≥5), homotypic clusters (≥1), or heterotypic clusters (≥1) versus the patients with negative results. Log-rank (Mantel-Cox) test P values and hazard ratio (HR) are displayed. (G) Kaplan-Meier survival curves of patients with breast cancer, divided by race (Black and White) and heterotypic cluster status. Log-rank (Mantel-Cox) test P value is shown.
Figure 2
Figure 2. DPT cells are 140-fold enriched in CTC-WBC clusters compared with single WBCs.
(A) Schematic of analyzing the frequency of broad classes of immune cell compositions in the blood biopsies of breast cancer patients via flow cytometry and ImageStream. N = 26 patients (n = 1,402 CTC-WBC clusters). (B) Frequency of immune cells (neutrophils, monocytes, NK cells, and B cells) and different T cell populations (DPT, CD4+ T, and CD8+ T) in patient blood (WBCs) (left pie chart) and CTC-WBC clusters (right pie chart). N = 26 patients (n = 698 CTC-T cell clusters). (C) Left: Flow dot plots of CD3+ T cells in single WBCs (top) and heterotypic CTC-WBC clusters (bottom). Top right: ImageStream photos of CD8+CD4+ DPT, CD4+T, and CD8+T cells. Bottom right: Representative images of CTC-DPT cluster via ImageStream imaging cytometry. Scale bars: 10 μm. (D) Frequency of subset T cells, neutrophils, monocytes, NK cells, and B cells from individual patients. Multiple Wilcoxon’s tests, *P < 0.05. N = 26. (E) MFI of various T cell markers (CD44, CD62L, CD45RO, CCR7, TIM-3, PD-1, CD25, and TIGIT) in human DPT cells of breast cancer patients compared with CD4+ and CD8+ single-positive T cells, as detected by flow cytometry. Friedman’s test with Dunn’s multiple-comparison test. N = 8. (F) Phenotypic characterization of human DPT cells in breast cancer patients compared with CD4+ and CD8+ single-positive T cells, including naive (CD62L+CD44), memory (CD45RO+), central memory (CD45RO+CCR7+), effector memory(CD45RO+CCR7), terminal effector (PD-1+TIM3), progenitor-exhausted (TIM3+PD-1), and terminal-exhausted cells (PD-1+TIM3+). N = 8 patients. Friedman’s test with Dunn’s multiple-comparison test. N = 8 breast cancer patients. *P < 0.05. (G) CTC-WBC clusters containing DPT cells (normalized counts) in patients who received anti–PD-1 treatment (pembrolizumab) before liquid biopsy. N = 20 patients who did not receive it (no anti–PD-1), and N = 6 patients who received it (+anti–PD-1). Mann-Whitney unpaired 2-sided t test.
Figure 3
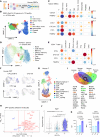
Figure 3. DPT tumor cell clustering promotes metastasis formation in an experimental metastasis assay in vivo.
(A) Schematic depicting experimental design of mouse DPT isolation, clustering with L2T-labeled 4T1 tumor cells ex vivo (controls groups including 4T1 cells [singles and clusters], and 4T1 and mouse splenocytes), tail vein infusion, and lung colonization monitored via bioluminescence imaging of L2T+ 4T1 cells and histology validation. (B and C) Representative images (B) and quantification (C) of in vivo bioluminescent signals in mouse lungs of L2T+ 4T1 tumor cells after clustering and tail vein injection. Kruskal-Wallis test with multiple comparison; n = 3 mice per group. (D and E) H&E staining images with inserted regions of control or micrometastasis in the mouse lungs (D) and quantification of metastasis lesions of lung sections (E) on day 6 after infusion of 4 groups of cells: 4T1 singles, 4T1 homoclusters, 4T1-DPT clusters, and 4T1-splenocytes. Arrows point to metastatic lesions. Scale bars: 100 μm. Three-way ANOVA with Dunn’s multiple-comparison test was used for P value calculations. N = 3 for 4T1-DPT and 4 for all other groups. (F) Repeated experiment of DPT-4T1 clustering–promoted metastatic seeding and colonization with single CD4+ and CD8+ T cell controls in mix clustering with 4T1 cells. Data in graphs represent mean ± SEM. Unpaired 2-tailed t test; *P < 0.05, ****P < 0.001. N = 6 biological replicates. (G) Enriched pathways upregulated (left) or downregulated (right) in 4T1 cells after being incubated with DPT cells versus those with splenocytes for 6 hours, identified via the Enrichr database (https://maayanlab.cloud/Enrichr/) (WikiPathways [WP]) based on scRNA-Seq (10X Genomics) data. The respective UMAP plots for each group are provided in Supplemental Figure 6B.
Figure 4
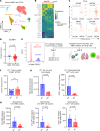
Figure 4. scRNA-Seq reveals enrichment of rare T cell subsets (DPTs) in the blood of breast cancer patients, dependent on CTC status.
(A) Schematic depicting the isolation of human WBCs and subsequent scRNA-Seq. (B) UMAP plots of 47,234 single WBCs from 19 breast cancer patients (n = 35,401 cells) and 12 healthy control liquid biopsies (n = 11,833 cells), with broad immune cell subsets annotated. (C) Correlation plots depicting χ2 test residuals to determine over- or underenrichment of each immune cell subset from the WBCs of breast cancer patients versus healthy controls (top) and by CTC status (bottom). Dot size corresponds to the absolute value of correlation coefficients, and color corresponds to χ2 residuals. (D) UMAP plots of T cell subsets (n = 20,930 cells). (E) Correlation plots of over- or underenrichment of each T cell subset from the WBCs of CTC-positive, -low, and -negative cancer patients and healthy controls. (F) DPT cells highlighted on T cell subset UMAP plots, split by CTC status. (G) UMAP plot of mouse T cells, including single-positive and DPT cells collected from BALB/c mouse splenocytes. (H) Volcano plot depicting most differentially expressed genes in DPT cells versus all other T cells in mouse splenic T cells. (I) Venn diagram showing the overlap between adhesion molecule genes expressed in total human T, mouse T, human DPT, and mouse DPT cells and a list of 32 genes shared among 4 groups. (J) Violin plots of mouse Itgb1 mRNA expression in mouse T cells isolated from splenocytes, as measured by scRNA-Seq. Kruskal-Wallis test P values are provided. (K) Bar graphs of Cd29 (encoded by Itgb1) and Cd49d (encoded by Itga4) expression (MFI) in mouse DPT, CD4+, and CD8+ cells isolated from BALB/c mouse splenocytes. One-way ANOVA with Tukey’s multiple-comparison test P values provided. N = 6 mice.
Figure 5
Figure 5. Targeting VCAM1 inhibits spontaneous lung metastasis and CTC-DPT clusters in vivo.
(A) UMAP plot of CTCs and WBCs analyzed from a scRNA-Seq dataset of patients with breast cancer. (B and C) Heatmap of ligand adhesion molecules (B) and gene expression bar graph of VCAM1 and control genes GAPDH, MKI67, and EPCAM via scRNA-Seq (C) in CTCs isolated from the patients with local and metastatic (Met) breast cancer (BC). Two-tailed unpaired t test. N = 138 for Met BC group and 14 for local BC group. (D) Plot of proteomic VCAM1 in nontreated breast cancer tumors of Black and non-Black patients. Unpaired, 1-tailed nonparametric t test. N = 14 for Black patients and 108 for non-Black. Black line on graph indicates median value. (E) Left: Flow histograms of mouse 4T1 tumor cells, WT, and Vcam1-KO. Right: Schematic depicting experimental design of orthotopic implants of eGFP+ 4T1 (WT and Vcam1-KO) tumors in BALB/c mice and subsequent analyses of tumor burden, CTCs, and lung metastasis. (F) Bar graphs of 4T1 primary tumor volumes, WT and Vcam1-KO, on day 9 (NS = not significantly changed, P > 0.05) prior to eGFP immunogen–triggered immune attacks in mice. N = 16 tumors. Two-tailed unpaired t test. (G) Bar graphs of lung metastatic signals of eGFP+ 4T1 cells detected via ex vivo fluorescence imaging of dissected lungs (left) and flow cytometry of dissociated eGFP+ cells from the mouse lungs (right). N = 3 for WT and 6 for KO. Unpaired, 2-tailed t test P values are displayed. (H) Bar graphs showing CTC-WBC clusters, CTC-T cell clusters, and CTC-DPT cell clusters in peripheral blood of mice with 4T1-NT control or VCAM1-KO tumors. N = 11 for WT and 14 for KO. Unpaired, 2-tailed t test P values are displayed.
Figure 6
Figure 6. Targeting VLA-4 inhibits spontaneous lung metastasis and CTC-DPT clusters in vivo.
(A) Schematic of anti–VLA-4 neutralizing antibody (αVLA-4 Ab) treatment for orthotopic 4T1 breast tumors on days 3, 5, 7, and 9. Blood/tissue harvests for primary tumors, CTCs, and lung metastasis analyses on day 10 (N = 6). The primary tumor was removed via survival surgeries with the rest of the mice (N = 7 per group) for extended survival analyses until 6 weeks. (B) Bar graphs of 4T1 tumor weight and photos of dissected tumors of IgG control and αVLA-4–treated groups on day 10. Unpaired 2-tailed t test (N = 6) between 2 groups. (C) Mouse survival after neoadjuvant treatment of IgG and αVLA-4 followed by a surgical removal of primary tumors on day 10 (N = 7). Log-rank P = 0.03846 for distinct survival of 2 groups of the mice by 6 weeks. Hazard ratio = 4.435 (0.9842–20.75, 95% CI of ratio) when the IgG group was compared with the αVLA-4–treated group. (D) Bar graphs of blood-detected CTC-WBC clusters (left) and CTC-DPT clusters (middle), and the burden of lung tumor cells (right) detected and quantified via flow cytometry on day 10 (N = 6). Unpaired, 2-tailed t test P values are shown.

Update of

References

    1. Ashworth T. A case of cancer in which cells similar to those in the tumours were seen in the blood after death. Aust Med J. 1869;14:146–147.
    1. Aceto N, et al. En route to metastasis: circulating tumor cell clusters and epithelial-to-mesenchymal transition. Trends Cancer. 2015;1(1):44–52. doi: 10.1016/j.trecan.2015.07.006. - DOI - PubMed
    1. Reduzzi C, et al. Unveiling the impact of circulating tumor cells: two decades of discovery and clinical advancements in solid tumors. Crit Rev Oncol Hematol. 2024;203:104483. doi: 10.1016/j.critrevonc.2024.104483. - DOI - PubMed
    1. Cristofanilli M, et al. The clinical use of circulating tumor cells (CTCs) enumeration for staging of metastatic breast cancer (MBC): international expert consensus paper. Crit Rev Oncol Hematol. 2019;134:39–45. doi: 10.1016/j.critrevonc.2018.12.004. - DOI - PubMed
    1. Cristofanilli M, et al. Circulating tumor cells, disease progression, and survival in metastatic breast cancer. N Engl J Med. 2004;351(8):781–791. doi: 10.1056/NEJMoa040766. - DOI - PubMed

MeSH terms

Substances