. 2025 Sep;103(9):e70080.
doi: 10.1002/jnr.70080.

Combination of Treadmill Training and Inosine Enhance Nerve Regeneration and Functional Recovery After Mice Sciatic Nerve Transection

Affiliations

Combination of Treadmill Training and Inosine Enhance Nerve Regeneration and Functional Recovery After Mice Sciatic Nerve Transection

Tiago Batos Taboada et al. J Neurosci Res. 2025 Sep.

Abstract

Peripheral nerve injuries are a major cause of disability, leading to significant sensorimotor impairment and functional loss. These injuries can result from traumatic or non-traumatic events, with severe cases posing therapeutic challenges. Neurorrhaphy is the gold standard for treating injuries where the gap between nerve stumps is less than 3 cm, while autografting is used for larger gaps. Despite various therapeutic approaches aimed at enhancing peripheral nerve regeneration, restoring pre-injury function remains difficult in clinical practice, prompting the exploration of experimental therapies. This study examined the effects of treadmill training and inosine treatment on sciatic nerve regeneration after transection in mice. Male C57/Bl6 mice (8-12 weeks) underwent sciatic nerve transection, with the proximal and distal stumps sutured to a polylactic acid tubular graft, creating a 3 mm gap. The mice were treated with saline or inosine (70 mg/mL) for 1 week, followed by treadmill exercise starting in the second week. The exercise protocol involved treadmill speeds of 6-12 m/min, three times per week for 10 min, continuing for 8 weeks. Functional recovery was assessed weekly using the Sciatic Functional Index, pinprick test, and Von Frey electronic analgesiometer. At the end of the study, electrophysiological tests and morphologic analysis were performed. The results showed that the combination of inosine with treadmill training significantly accelerated functional recovery and nerve regeneration, suggesting that this combined approach may offer a promising alternative for improving recovery outcomes in cases of peripheral nerve injury.

Keywords: inosine; nerve guidance conduit; nerve regeneration; peripheral nerve injury; treadmill training.


Conflict of interest statement

The authors declare no conflicts of interest.

Figures

FIGURE 1
FIGURE 1
Illustrative diagram of the three segments of the nerve and their respective processing. (A) Proximal nerve segment processed for scanning electron microscopy (SEM). (B) Mid‐regenerated nerve segment processed for transmission electron microscopy (TEM). (C) Distal segment to the lesion processed for immunohistochemical (IHC) analyses.
FIGURE 2
FIGURE 2
Functional assessment after sciatic nerve injury. (A) Graph showing SFI scores through the weeks. (B) Footprints at the day before lesion, 1 week and 8 weeks after injury. (C) Pinprick scores after the crush injury. (D) Graph showing paw withdrawal threshold in grams on electronic Von Frey analgesiometer. For functional assessment: Saline n = 6, inosine n = 6, saline + TT n = 6 and inosine + TT n = 6. Values represent mean ± SEM. (+ for Inosine + TT vs. Saline; # for Inosine + TT versus Inosine; $ for Inosine + TT versus Saline + TT; & for Saline + TT versus Saline; δ for Saline + TT versus Inosine; Φ for Inosine versus Saline for +, #, &, $, Φ and δ, p < 0.05; for ## and &&, p < 0.005; for +++ and ###, p < 0.0005; for ++++, p < 0.0001).
FIGURE 3
FIGURE 3
Electrophysiological analysis at 8 weeks post‐injury. (A) Compound muscle action potential (CMAP) traces for the uninjured (orange), saline (green), inosine (purple), saline + TT (red) and inosine + TT (blue) groups. Graphs showing (B) CMAP latency, (C) amplitude and (D) nerve conduction velocity (m/s) across the five groups. For electrophysiology: N = 4. Values represent mean ± SEM (**p < 0.005, ***p < 0.0005 and ****p < 0.0001).
FIGURE 4
FIGURE 4
Morphology of regenerating nerves. (A–H) Semi‐thin sections of segment B of the sciatic nerves from animals in the four groups. The nerves from groups treated with inosine, treadmill training, and the combined treatment (B–D) show a larger total area and a higher number of myelinated fibers compared to the saline group (A). Scale bar = 100 μm. At higher magnification (E–H), the treated groups (F–H) appear to have a more organized environment compared to the saline group (E). Scale bar = 20 μm. (I–L) Ultra‐thin sections of segment B of the sciatic nerves from animals in the four groups. The groups treated with inosine, treadmill training, and the combined treatment (J–L) appear to have more myelinated fibers, whereas the saline group (A) appears to have more fibers in the process of myelination. Scale bar = 2 μm.
FIGURE 5
FIGURE 5
Morphometry of regenerating nerves. (A) Number of myelinated fibers. (B) Axon area (μm2). (C) Myelin area (μm2). (D) Myelinated fiber area (μm2). (E) G‐ratio distribution of segment B of the regenerating sciatic nerve. (F) Mean G‐ratio of segment B of the regenerating sciatic nerve. (G–J) Relationship between G‐ratios and axon diameters (μm) in the saline (H), inosine (I), saline + TT (J), and inosine + TT (K) groups. For morphometric analyses: N = 3. Data presented as mean ± SEM. (*p < 0.05, **p < 0.005, ***p < 0.0005).
FIGURE 6
FIGURE 6
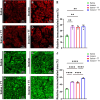
Analysis of relative immunostained areas for A2Ar and NF200. For A2Ar (A–D) note the staining intensity in the saline group (A) and increased intensity in the inosine (B), saline + TT (C), and inosine + TT (D) groups. Scale bar: 10 μm. (E) Quantification of relative immunostained area for A2A receptor (A–D). For NF‐200 (F–I) note the staining intensity in the saline group (A) and increased intensity in the inosine (B), saline + TT (C), and inosine + TT (D) groups. Scale bar: 10 μm. (J) Quantification of relative immunostained area for NF‐200. For A2Ar and NF‐200 immunostained area analysis: N = 3. Data presented as mean ± SE. (**p < 0.005 and ****p < 0.0001).
FIGURE 7
FIGURE 7
Quantification of cell bodies of motor and sensory neurons. (A–H) Transverse sections of DGR and (J–Q) Transverse sections of spinal cords, stained with 0.5% cresyl violet at 20× magnification (A–D; J–M) and 63× magnification (E–H; N–Q). (A, E, J, N) Saline; (B, F, K, O) Inosine; (C, G, L, P) Saline + TT; (D, H, M, Q) Inosine + TT. For quantitative analyses of nucleoli in sensory and motor neurons: N = 3. Data presented as mean ± SEM (*p < 0.05 and **p < 0.005). Scale bar: 10 μm (A–D; J–M) and 2 μm (E–H; N–Q).
FIGURE 8
FIGURE 8
Analysis of gastrocnemius muscles. (A) Image of the right (injured) and left (uninjured control) gastrocnemius muscles from the four groups. (B) Dry weight in grams of the injured medial and lateral gastrocnemius muscles from animals in the four groups. (C) Ratio between the dry weight of injured gastrocnemius muscles and uninjured control from the four groups. For gastrocnemius muscle analyses: N = 3. (D–I) Morphological analysis of gastrocnemius muscles stained with HE. (A) Transverse sections of gastrocnemius muscle from groups (D) saline; (E) inosine; (F) saline + TT; and (G) inosine + TT. (H) Mean area of muscle fibers (μm2). (I) Number of muscle fibers. Scale bar: 10 μm. For morphological analyses of gastrocnemius muscles: N = 3. Data presented as mean ± SEM (*p < 0.05, **p < 0.005 and ***p < 0.0005).

References

    1. Akram, R. , Anwar H., Javed M. S., et al. 2022. “Axonal Regeneration: Underlying Molecular Mechanisms and Potential Therapeutic Targets.” Biomedicine 10, no. 12: 3186. - PMC - PubMed
    1. Albus, C. A. , Rishal I., and Fainzilber M.. 2013. “Cell Length Sensing for Neuronal Growth Control.” Trends in Cell Biology 23, no. 7: 305–310. - PubMed
    1. Awad, A. S. , Huang L., Ye H., et al. 2006. “Adenosine A2A Receptor Activation Attenuates Inflammation and Injury in Diabetic Nephropathy.” American Journal of Physiology. Renal Physiology 290, no. 4: F828–F837. - PubMed
    1. Bauer, E. E. , Buhr T. J., Reed C. H., and Clark P. J.. 2020. “Exercise‐Induced Adaptations to the Mouse Striatal Adenosine System.” Neural Plasticity 2020, no. 1: 5859098. - PMC - PubMed
    1. Benowitz, L. I. , Goldberg D. E., Madsen J. R., Soni D., and Irwin N.. 1999. “Inosine Stimulates Extensive Axon Collateral Growth in the Rat Corticospinal Tract After Injury.” Proceedings of the National Academy of Sciences 96, no. 23: 13486–13490. - PMC - PubMed

MeSH terms

LinkOut - more resources