. 2025 Oct 23;99(10):e0088725.
doi: 10.1128/jvi.00887-25. Epub 2025 Sep 16.

Positive correlation between structural disorder of the HIV-1 Gag N-terminal segment and progeny virus particle formation

Affiliations

Positive correlation between structural disorder of the HIV-1 Gag N-terminal segment and progeny virus particle formation

Takaaki Koma et al. J Virol. .

Abstract

A class of unstructured peptide segments termed disordered regions plays a crucial role in the regulation of protein structure and function. Although the N-terminal region of the matrix (MA) domain of the HIV-1 Gag precursor protein is composed of an unstructured peptide, the mechanisms underlying the regulation of the unstructured state relating to control of viral phenotypes remain unclarified. We examined, in association, the structural, evolutionary, and biological roles of the MA N-terminal region via mutagenesis. Molecular dynamics simulation of a full-length Gag dimer model suggested that an amino acid residue at position 9 in the MA N-terminal region (MA-9) participates in the Gag dimerization. Information entropy analysis indicated that the MA-9 residue is variable in nature, but the hydrophobic amino acid substitution is evolutionarily maladaptive. Disordered region prediction study suggested that single hydrophobic amino acid substitutions at MA-9 reduce the disordered state of the MA N-terminal region. Consistently, NMR analysis indicated that such substitution reduces motional dynamics of the MA N-terminal region and alters the conformation of the MA domain. A site-directed mutagenesis study showed that hydrophobic amino acid substitutions at the MA-9 residue impair, to different degrees, the elementary and overall processes of virus particle formation in the cells. Importantly, the level of the virus particle formation was positively correlated with the level of disorder of the MA N-terminal region. These results indicate that the maintenance of structural disorder and dynamics of the Gag N-terminal segment is regulated by the MA-9 residue and critical for maintaining the optimal production of HIV-1 particles.IMPORTANCEA class of unstructured peptide segments termed disordered regions plays crucial roles in the regulation of protein structure and function. Although HIV-1 Gag precursor protein has multiple disordered elements, molecular mechanisms underlying regulation of unstructured state and viral phenotypes largely remain elusive. In this study, by analyzing in association the structural, evolutionary, and virological roles of the disordered N-terminal region of the HIV-1 Gag protein, we show that an amino acid residue at position 9 of the Gag is able to modulate the N-terminal disordered state, and the level of disorder of the Gag N-terminal region is positively correlated with the level of virus particle formation. Our findings gain new insights into molecular mechanisms of regulation of Gag structure and highlight the importance of a previously unappreciated survival strategy of HIV-1-namely, preservation of the Gag N-terminal disorder.

Keywords: Gag; HIV-1; structural disorder; virus particle production.


Conflict of interest statement

The authors declare no conflict of interest.

Figures

Fig 1
Fig 1
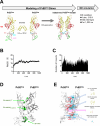
MD-based structural modeling of the full-length Gag precursor of HIV-1. (A) Disorder scores of the full-length Gag precursor (Pr55Gag) were estimated with PONDR VL-XT predictor (33–35) using the sequence from the HIV-1 NL4-3 strain (GenBank accession no. AF324493) (36). The dashed lines at the Y axis of the figures are the threshold lines for disordered/structured residues. (B) A three-dimensional model of the full-length Gag precursor of HIV-1 was constructed by superpositioning reported Gag domain structures, followed by homology modeling using the Molecular Operating Environment (MOE; Chemical Group Inc., Montreal, QC, Canada). The obtained initial Gag precursor model was subjected to MD simulations using modules in the Amber 16 program package (32). (C) RMSD between the structure of the initial Gag precursor structure and those at given time points of the MD simulation was calculated using the cpptraj module in AmberTools 16 as described previously (37, 38). (D) Side view of the Gag precursor model at 200 ns of MD simulation. (E and F) Analysis of relative areas of exposed surfaces of Gag domains (E) and interaction sites (F).
Fig 2
Fig 2
Characterization of molecular interactions between two Gag precursors. (A) The Gag precursor model at 200 ns of MD simulation in the equilibrium state under solution conditions was used for modeling of the Gag dimer model using Molecular Operating Environment (MOE). The CA C-terminal domain model (45) was used as a template for the Gag dimer interface. The initial two Gag precursors model was subjected to MD simulation under conditions of 1 atm and 310 K in 150 mM NaCl for 1,000 ns. (B) RMSDs between the structure of the initial two Gag precursors model and those at the given time points of the MD simulation are shown. (C) Numbers of hydrogen bonds formed between two Gag precursors during 1,000 ns of MD simulations. The trajectory files during 1,000 ns of MD simulations were used to calculate the number of hydrogen bonds between the two Gag precursors using the cpptraj module in AmberTools 16 (32). (D) Distribution of hydrophobic patches in the binding interface of the two Gag precursors. Hydrophobic patches with a minimum area of 50 Å2 for protein–protein interactions were estimated using the Protein Patch Analyzer tool in MOE as described previously (15, 38). (E) Visualization of contact sites in the two Gag precursors (red and blue stick models). Panel E depicts the same structure as in panel D but rotated 180°.
Fig 3
Fig 3
Types and frequencies of amino acid residues present in the N-terminal region of the Gag protein. (A) Amino acid variation at positions 1–10 of the N-terminal region of Gag-MA was analyzed with the Shannon entropy method (n = 25,222) and AnalyzeAlign (n = 6,574). HIV-1 Gag amino acid sequences were obtained from the HIV Sequence Database (http://www.hiv.lanl.gov). Shannon entropy was calculated on the basis of Shannon’s equation (left panel) (49). The red letters indicate hydrophilic amino acids. The AnalyzeAlign tool was used to make the Web Logo of the Gag sequences in February 2022 and to analyze the types and frequencies of amino acid residues at position 9 of Gag after gaps and unspecified amino acid residues were removed (right panel). (B) The types, properties, and frequencies of amino acid residues in MA-9 were summarized using the obtained Gag amino acid sequences.
Fig 4
Fig 4
Effects of MA-9 single substitutions on the disordered state of the MA N-terminal region. The disorder level of the N-terminal region of the HIV-1 Gag MA domain was estimated using AIUPred. A score of 0.5 or higher indicates a likely disordered region. Amino acids were classified into five groups according to their properties: aromatic (A), hydrophobic (B), hydrophilic (C), acidic (D), and basic (E).
Fig 5
Fig 5
Motion of the Gag-MA N-terminal region. (A) 2D 1H-15N HSQC spectrum of 100 µM 15N-labeled Gag-MA 6His at 35°C and pH 5.5. (B) Superimposition of the 2D 1H-15N HSQC spectra of 15N-labeled Gag-MA 6His and 15N-labeled Gag-MA-S9F 6His at 35°C. Signals exhibiting chemical shift perturbations are labeled with the residue number and a one-letter code. (C) Mapping of residues with profound chemical shift perturbation upon the introduction of the S9F substitution on the Gag-MA structure (PDB ID: 2H3F). (D) Steady-state NOE values are shown for 15N-labeled Gag-MA 6His (blue) and 15N-labeled Gag-MA-S9F 6His (red). (E) Expansion of the N-terminal region of Gag-MA. The positions of α-helical regions are shown at the top. (F) Molecular patches relevant to hydrophobic interactions. Light green portions indicate the hydrophobic patches. The N- and C-termini of Gag-MA are shown by the letters “N” and “C,” respectively.
Fig 6
Fig 6
Effects of Gag mutations on virion production and viral infectivity and relation between the disordered state and viral phenotype. (A) HEK293T cells were transfected with the indicated full-length proviral clones. The culture supernatants were collected at 24 h post-transfection to measure virion production by reverse transcriptase (RT) assays. RT activity is shown relative to that of NL4-3. Equal amounts of viruses, as determined by RT assays, were inoculated into TZM-bl cells. Cell lysates were prepared on day 2 post-infection for luciferase assays. Infectivity is presented as luciferase activity relative to that of NL4-3. Mean values ± SE from at least four independent experiments are shown. Significance relative to NL4-3 was determined by the Welch’s t-test (**P < 0.01; *P < 0.05). Gag-MA-G2A and Gag-CA-WMAA mutant clones were used as controls. (B) The relation between the mean disorder scores of the MA-NTD segment and the values of relative viral particle production. The mean disorder scores of the first nine amino acid residues of the Gag MA N-terminus were obtained for individual MA-9 mutants using the data from Fig. 4 (AIUPred [51]; left panel) and Fig. S5 (PONDR VL-XT [33–35]; right panel). The values were used to assess the relation between the disorder level and viral production in Fig. 6A (orange bars). R: Pearson’s correlation coefficient. (C) The relation between the mean disorder scores of the MA-NTD segment and relative viral infectivity values. The mean disorder scores were used to assess the relation between the level of disorder and viral infectivity values in Fig. 6A (gray bars).
Fig 7
Fig 7
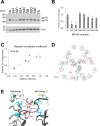
Effect of Gag-MA-S9 mutations on Env incorporation into virions. (A) The supernatants from HEK293T cells transfected with the indicated proviral clones were ultracentrifuged through a sucrose cushion, and the pellet samples were harvested for monitoring Env and Gag-p24 in virions. Equal amounts of samples (10 ng p24 for Env and 0.5 ng p24 for Gag) were analyzed by the Western blotting method. (B) Representative immunoblotting data from three independent experiments (performed twice for both S9R and S9E) are presented. Env incorporation into virions is presented as the normalized signal intensity (Env/p24) of each sample relative to that of NL4-3 (mean ± SE). The statistical analysis was conducted by Welch’s t-test. **P < 0.01; *P < 0.05. (C) The correlation between the relative Env incorporation and relative infectivity is indicated by the R-score. (D) Three-dimensional locations of the MA-S9 amino acid residue in the immature HIV-1 MA model. The immature HIV-1 MA trimer structure is derived from PDB code 7OVQ (30). (E) Molecular interactions between two MA trimers. The magenta-colored bars indicate hydrogen bonds.
Fig 8
Fig 8
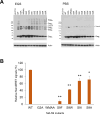
Effect of Gag mutations on Gag oligomerization in cells. (A) HeLa cells were transfected with the indicated proviral mutants derived from pNL4-3ΔPro/ΔEnv as a parental WT clone. At 24 h post-transfection, cells were treated with 0.1 mM EGS (left panel) or PBS (right panel) for 30 min. After quenching the reactions, cell lysates were prepared, and equal amounts of protein from the cell lysates (5 µg) were subjected to Western blot analysis using anti-Gag and anti-β-actin antibodies. Plasmid pUC19 and Gag mutants designated Gag-MA-G2A and Gag-CA-WMAA were used as controls. Predicted migration positions of Gag monomer (Gag1), dimer (Gag2), oligomerized Gag (Gag3, Gag4, and Gag5), and the residual Gag-Pol proteins are indicated at right. Representative data from three independent experiments are shown. *Unspecified bands. (B) Gag–Gag interactions were detected by NanoBRET. NanoBRET data are shown as values relative to the WT after subtracting the signal value of the dimerization-defective mutant WMAA (n = 6; mean ± SE). NanoBRET values for G2A were lower than those for WMAA and are plotted as 0. Significance relative to WT was determined by Welch’s t-test. **P < 0.01; *P < 0.05.
Fig 9
Fig 9
Effects of Gag-MA mutations on Gag localization to cell membranes. (A) HeLa cells were transfected with the indicated proviral mutants derived from pNL4-3ΔPro/ΔEnv as a parental WT clone. At 24 h post-transfection, cells were lysed to prepare the postnuclear supernatant for membrane flotation analysis (for details, see Materials and Methods). A sample in a sucrose solution (75%) was placed at the bottom of a centrifugation tube and layered with lowered concentrations of sucrose (65% and 10%) from bottom to top. After ultracentrifugation, fractions (1–12) were collected from centrifugation tubes (top to bottom) for examination of Gag by the Western blotting method. Gag proteins in the membrane fractions (MF; fraction numbers 3–5) and nonmembrane fractions (non-MF; fraction numbers 10 to 12) are indicated. Representative immunoblotting data from three independent experiments are shown. (B) The ratios of MF and non-MF Gag proteins for various clones are presented (mean ± SE). Significance relative to control NL4-3 was determined by Welch’s t-test. **P < 0.01; *P < 0.05. (C) The correlation between the relative gag localization and relative viral particle production was indicated by the R-score.
Fig 10
Fig 10
Effect of Gag-MA mutations on N-myristoylation of Gag proteins. (A) HEK293T cells were transfected with the indicated Gag-MA mutants derived from pNL4-3ΔPro/ΔEnv. At 24 h post-transfection, biotinylation reactions to detect any myristoylated proteins in cells were performed by using the Click-IT-based method (for details, see Materials and Methods). After the reactions, free biotin was removed from the samples, and equal amounts of samples (3.0 µg of total protein) were used for Western blotting analysis with horseradish peroxidase-conjugate streptavidin. Representative immunoblotting data from three independent experiments are shown. (B) Relative Myr-Gag/Gag is presented as described in Materials and Methods (mean ± SE). Significance relative to control NL4-3 was determined by Welch’s t-test. **P < 0.01; *P < 0.05. Myr-Gag, Myristoylated Gag; NL, NL4-3 WT; pUC, negative control.

References

    1. van der Lee R, Buljan M, Lang B, Weatheritt RJ, Daughdrill GW, Dunker AK, Fuxreiter M, Gough J, Gsponer J, Jones DT, Kim PM, Kriwacki RW, Oldfield CJ, Pappu RV, Tompa P, Uversky VN, Wright PE, Babu MM. 2014. Classification of intrinsically disordered regions and proteins. Chem Rev 114:6589–6631. doi: 10.1021/cr400525m - DOI - PMC - PubMed
    1. Tompa P. 2012. Intrinsically disordered proteins: a 10-year recap. Trends Biochem Sci 37:509–516. doi: 10.1016/j.tibs.2012.08.004 - DOI - PubMed
    1. Wright PE, Dyson HJ. 2015. Intrinsically disordered proteins in cellular signalling and regulation. Nat Rev Mol Cell Biol 16:18–29. doi: 10.1038/nrm3920 - DOI - PMC - PubMed
    1. Uversky VN, Dunker AK. 2010. Understanding protein non-folding. Biochim Biophys Acta 1804:1231–1264. doi: 10.1016/j.bbapap.2010.01.017 - DOI - PMC - PubMed
    1. Oldfield CJ, Dunker AK. 2014. Intrinsically disordered proteins and intrinsically disordered protein regions. Annu Rev Biochem 83:553–584. doi: 10.1146/annurev-biochem-072711-164947 - DOI - PubMed

MeSH terms

Substances

LinkOut - more resources