. 2025 Sep 16;23(9):e3003367.
doi: 10.1371/journal.pbio.3003367. eCollection 2025 Sep.

Genetic variation influences food-sharing sociability in honey bees

Affiliations

Genetic variation influences food-sharing sociability in honey bees

Ian M Traniello et al. PLoS Biol. .

Abstract

Individual variation in sociability is a central feature of every society. This includes honey bees, with some individuals well connected and sociable, and others at the periphery of their colony's social network. However, the genetic and molecular bases of sociability are poorly understood. Trophallaxis-a behavior involving sharing liquid with nutritional and signaling properties-comprises a social interaction and a proxy for sociability in honey bee colonies: more sociable bees engage in more trophallaxis. Here, we identify genetic and molecular mechanisms of trophallaxis-based sociability by combining genome sequencing, brain transcriptomics, and automated behavioral tracking. A genome-wide association study (GWAS) identified 18 single nucleotide polymorphisms (SNPs) associated with variation in sociability. Several SNPs were localized to genes previously associated with sociability in other species, including in the context of human autism, suggesting shared molecular mechanisms of sociability. Variation in sociability also was linked to differential brain gene expression, particularly genes associated with neural signaling and development. Using comparative genomic and transcriptomic approaches, we also detected evidence for divergent mechanisms underpinning sociability across species, including those related to reward sensitivity and encounter probability. These results highlight both potential evolutionary conservation of the molecular roots of sociability and points of divergence.


Conflict of interest statement

The authors have declared that no competing interests exist.

Figures

Fig 1
Fig 1. Experimental design and genomic correlates of honey bee trophallaxis frequency.
(a) For each replicate trial, a mix of ~500 bees from two source colonies was barcoded and transferred to a single honeycomb frame for automated monitoring of trophallaxis, foraging, and movement behaviors. After 10 days, bees were transferred to a petri dish and subjected to aggression and affiliative care assays. Immediately following behavioral assays, bees were flash-frozen and stored until the thorax and brain were dissected for DNA and RNA sequencing, respectively. Our final sample sizes for whole-genome resequencing and mushroom body RNA sequencing were 357 and 176, respectively, and a total of three source colonies were used across two replicate trials. (b) (Top) Genome-wide association study (GWAS) identified 18 single nucleotide polymorphisms (SNPs) significantly associated with variation in the frequency of trophallaxis (food-sharing) interactions, 12 of which were localized to the introns of gene models in the honey bee genome (HAv3.1). In vertebrates, variation in the expression or structure of three of these genes, neuroligin-2, NMDA receptor 2, and Nuclear factor I is associated with autism per the Simons Foundation Autism Research Initiative (SFARI) database. (Middle and bottom) In contrast, we did not identify any SNPs associated with variation in locomotion or turning kinematics, movements that contribute to, but do not fully encompass, trophallaxis interactions. Dashed red line indicates significance threshold (Bonferroni-corrected P-value < 0.05). Code and data underlying Fig 1b can be found in S1 Table and https://doi.org/10.6084/m9.figshare.29845490.
Fig 2
Fig 2. Genotype-specific variation in motor synchrony.
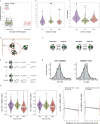
(a) A single source colony, R41, was found to be homozygous for nlg2 as well as the majority of trophallaxis-associated SNPs, while other colonies in this experiment contained the more prevalent reference allele. (b) Colony R41 also demonstrated the lowest levels of trophallaxis frequency, yet (c) was not the slowest-moving colony. (d) Images of proximal interaction were selected where two bees were physically close to each other (R ≤ 2 cm, where R is the Euclidean distance between the two bees’ barcodes). The X and Y coordinates of the barcode represent a given bee’s position in Euclidean space. (e) Drawing representing the dataset to which information partial directed coherence (iPDC) was applied. Each proximal interaction (interaction 1, … interaction n) is represented as a bivariate time-series of at least 30 time points (30 s), where the first time-series is the focal bee’s X or Y coordinate and the second time-series is its neighbor’s X or Y coordinate, respectively. For each focal bee, the identity of the neighbor varied across interactions. iPDC was calculated within each paired time-series and averaged across interactions to subsequently compute information flow in both directions. (f) Example of two bees with different levels of social influence. Arrow thickness is proportional to information transfer. On average, Bee #1697 influenced the movement of its neighbor with Iflow bee->neighbor = 0.035 bits, and was influenced by the movement of its neighbor with Iflow neighbor->bee = 0.019 bits. (g) Distributions of information flow across bees, representing the magnitude of movement influence-related information. (h) As for trophallaxis frequency, R41 bees were also least likely to influence, or be influenced by, other bees in their experimental cohort in terms of motor synchrony. Violin plots are constructed as follows: points represent raw data, solid black lines represent the mean, pale white shading above and below the mean represent a 95% confidence interval, and plot shape represents a smoothed density curve outlining the distribution of raw data. Letters above violin plots represent significance (P-value < 0.05) from a between-group Tukey post-hoc analysis following a one-way ANOVA. (i) Social influence was also negatively correlated with a per-bee polygenic risk score (Spearman’s rank correlation, P-value < 0.0001 for each correlation test); polygenic risk score was calculated by summing effect size-weighted SNPs associated with trophallaxis frequency via GWAS. Code and data underlying Fig 2 can be found in S1 Table and https://doi.org/10.6084/m9.figshare.29845490.
Fig 3
Fig 3. Neuromolecular correlates of trophallaxis frequency and social responsiveness in the honey bee mushroom bodies (MBs).
(a) Gene Ontology (GO) analysis identified highly specific terms associated with chemosensation and learning enriched in genes upregulated in Responders, while metabolic process terms were enriched in genes upregulated in NonResponders. Note that for GO term circle coloration in (a), all P-values are within the same order of magnitude. (b) GO enrichment analysis performed on genes positively correlated with trophallaxis frequency revealed the enrichment of several terms related to cell signaling and stimulus response, while genes negatively associated with trophallaxis were more strongly related to biosynthesis and metabolism, and (c) this gene set was significantly similar to genes with expression levels correlated with locomotion (hypergeometric overlap test). (d) Nlg2 levels were weakly but significantly correlated with trophallaxis frequency, (e) significantly lowest in colony R41 (one-way ANOVA with Tukey post-hoc test), and (f) differentially expressed in Responders compared to NonResponders in a lab-based assay examining behavioral responsiveness to social stimuli (Wilcoxon rank-sum test). For GO plots, circle diameter is inversely correlated to term specificity in the GO hierarchy, and more similar terms are more closely clustered in semantic space. Violin plots are constructed as previously described. Code and data underlying Fig 3 can be found in S2-S8 Tables and https://doi.org/10.6084/m9.figshare.29845490.
Fig 4
Fig 4. Whole-mount fluorescent in situ hybridization reveals neuroligin-2 (nlg2) expression patterns in the developing adult honey bee brain.
(a) Nlg2 is widely expressed in the adult worker brain as detected via HCR probes, while (b) no staining was observed with antisense probes. (c) Expression levels were highest in the mushroom body (MB) Kenyon cells (KCs), specifically the inner-compact KC (dashed white line), yet (d) were observed in the outer-compact KC as well. (e) We also identified strong signaling along the dorsal midline of the brain, in or around the neurosecretory cells that compose the pars intercerebralis. (f-k) Nlg2 expression was apparent throughout adulthood in the worker honey bee brain, although levels appeared highest in callows and 2-week-old bees (left and right columns are color and greyscale depictions of the same image, respectively). For each panel, nlg2 localization is shown in green and nuclei counterstained with DAPI are shown in blue.

References

    1. Gartland LA, Firth JA, Laskowski KL, Jeanson R, Ioannou CC. Sociability as a personality trait in animals: methods, causes and consequences. Biol Rev Camb Philos Soc. 2022;97(2):802–16. doi: 10.1111/brv.12823 - DOI - PubMed
    1. Barak B, Feng G. Neurobiology of social behavior abnormalities in autism and Williams syndrome. Nat Neurosci. 2016;19(6):647–55. doi: 10.1038/nn.4276 - DOI - PMC - PubMed
    1. Bonnell TR, Vilette C, Henzi SP, Barrett L. Network reaction norms: taking account of network position and plasticity in response to environmental change. Behav Ecol Sociobiol. 2023;77(3). doi: 10.1007/s00265-023-03300-2 - DOI
    1. Friedman DA, Johnson BR, Linksvayer TA. Distributed physiology and the molecular basis of social life in eusocial insects. Horm Behav. 2020;122:104757. doi: 10.1016/j.yhbeh.2020.104757 - DOI - PubMed
    1. Traniello IM, Hamilton AR, Gernat T, Cash-Ahmed AC, Harwood GP, Ray AM, et al. Context-dependent influence of threat on honey bee social network dynamics and brain gene expression. J Exp Biol. 2022;225(6):jeb243738. doi: 10.1242/jeb.243738 - DOI - PMC - PubMed

LinkOut - more resources