. 2025 Oct:120:105946.
doi: 10.1016/j.ebiom.2025.105946. Epub 2025 Sep 15.

Monocyte/macrophage-derived interleukin-15 mediates the pro-inflammatory phenotype of CD226+ B cells in type 1 diabetes

Affiliations

Monocyte/macrophage-derived interleukin-15 mediates the pro-inflammatory phenotype of CD226+ B cells in type 1 diabetes

Jingyue Li et al. EBioMedicine. 2025 Oct.

Abstract

Background: Type 1 diabetes (T1D) is characterised by the autoimmune-mediated destruction of pancreatic β-cells. Although traditionally viewed as a disease dominated by T cells, recent studies have emphasised the crucial role of B cells in the development of T1D. Genome-wide association studies (GWAS) have revealed that CD226 is related to susceptibility to several autoimmune diseases, including T1D. Our recent work identified a pathogenic role of CD226+ CD8+ T cells in T1D. However, the involvement of CD226+ B cells in T1D development remains unclear.

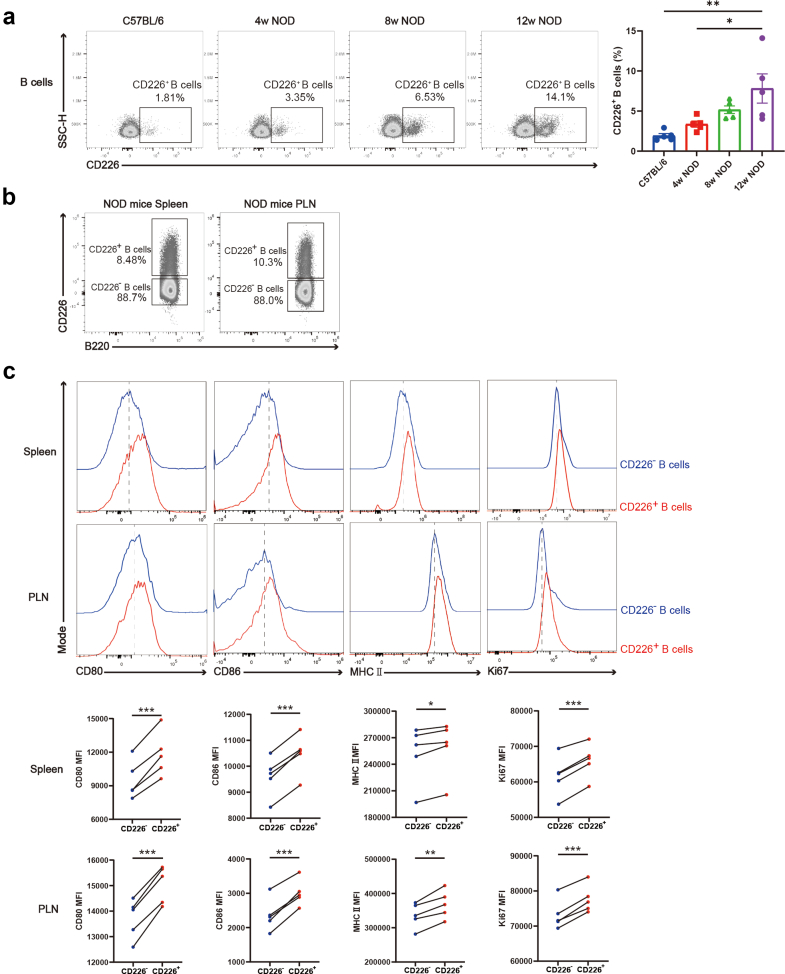
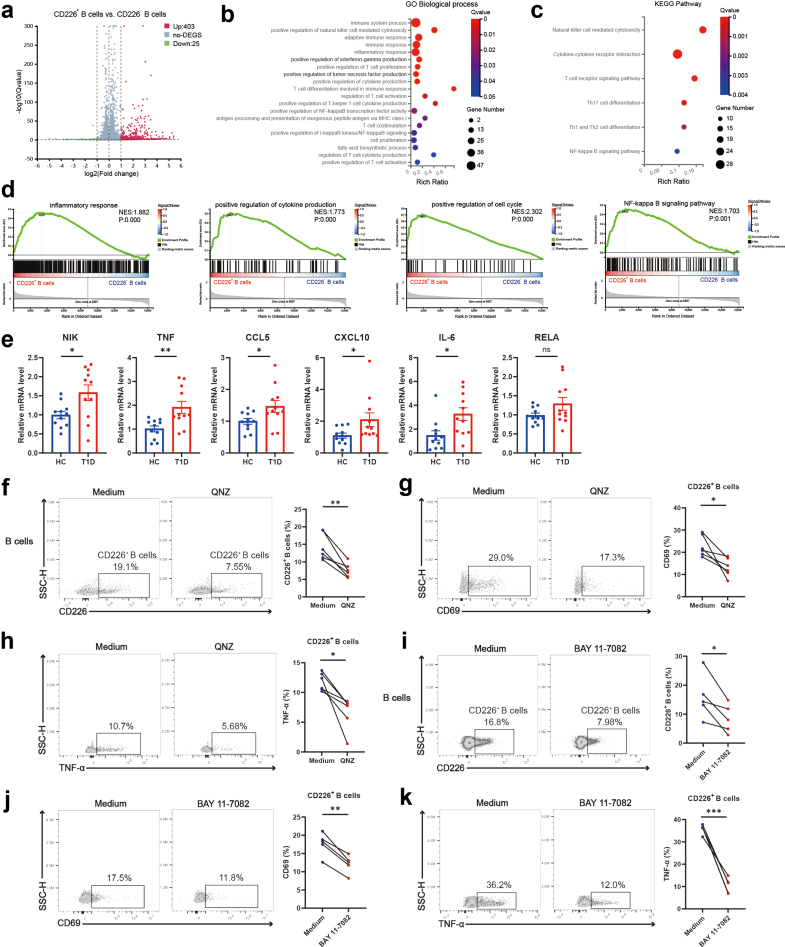
Methods: The expression and functional characteristics of CD226+ B cells in T1D patients and non-obese diabetic (NOD) mice were detected by flow cytometry. RNA sequencing and molecular biology experiments were performed to reveal regulatory mechanisms. In addition, in vivo interventions were conducted to explore potential preventive and therapeutic targets for T1D.

Findings: The percentage of CD226+ B cells is increased and positively correlated with disease severity in T1D. CD226+ B cells from T1D patients and NOD mice exhibit increased capability for activation, proliferation, and production of pro-inflammatory cytokines along with heightened glycolytic metabolism. Mechanistic studies have revealed that interleukin-15 (IL-15) secreted by monocytes or macrophages promotes the inflammatory response of CD226+ B cells. Importantly, the use of an anti-CD132 monoclonal antibody (anti-CD132) or an anti-IL-15 monoclonal antibody (anti-IL-15), which blocks IL-15 signalling, effectively prevented the disease onset of T1D. Furthermore, combination therapy with anti-CD3 monoclonal antibody (anti-CD3) and anti-CD132 synergistically reversed hyperglycemia in cyclophosphamide-accelerated NOD mice.

Interpretation: Our study demonstrates a novel role of the monocyte/macrophage-IL-15-CD226+ B cell axis in T1D immunopathogenesis and provides potential targets for T1D immunotherapy.

Funding: This work was supported by the Noncommunicable Chronic Diseases-National Science and Technology Major Project (2023ZD0507300, 2023ZD0507303, 2023ZD0508200, and 2023ZD0508201), the Natural Science Foundation of China (82570973, 82170795, 82470814, 82100949, and 82470931), the Scientific Research Program of FuRong Laboratory (2024PT5105) and the Central South University Research Programme of Advanced Interdisciplinary Studies (2023QYJC008).

Keywords: Autoimmune diabetes; B cells; CD226; Combination therapy; Type 1 diabetes.


Conflict of interest statement

Declaration of interests The authors declared that they have no conflict of interest.

Figures

Fig. 1
Fig. 1
The proportion of CD226+ B cells is correlated with disease progression in T1D patients. (a and b) Representative flow cytometry plots (a) and columnar scatter plots (b) displaying the expression of CD226 on B cells in HC (n = 40), T2D (n = 20), LADA (n = 20), and T1D (n = 40). One-way analysis of variance (ANOVA) followed by adjustments was used for multiple comparisons. Each point represents an individual. Horizontal bars represent the mean ± SEM. (c–f) Columnar scatter plots displaying the expression of CD226 on naive B cells (c), IgD+-memory B cells (d), switched memory (SM) B cells (e), and plasmablasts (f) in HC (n = 40), T2D (n = 20), LADA (n = 20), and T1D (n = 40), as assessed by flow cytometric analysis. One-way ANOVA followed by adjustments was used for multiple comparisons. Each point represents an individual. Horizontal bars represent the mean ± SEM. (g–j) Relationships between CD226+ B cells and clinical parameters from T1D (n = 40) and LADA (n = 20). Correlations between the percentage of CD226+ B cells and FBG (g), FCP (h) in T1D patients. Correlations between the percentage of CD226+ B cells and FBG (i), FCP (j) in LADA patients. (k and l) Relationships between CD226+ B cells and clinical parameters from T2D (n = 20) and HC (n = 40). Correlations between the percentage of CD226+ B cells and FBG in T2D (k) patients and HC (l). Pearson or Spearman’s rank correlation was used for correlation analyses. Linear regression is shown with 95% CIs (dotted area). (m and n) ROC curves for CD226+ B cells were used to predict T1D (m) and LADA (n). ∗P < 0.05. ∗∗P < 0.01. ∗∗∗P < 0.001. Abbreviations: HC, healthy controls; T2D, type 2 diabetes; LADA, latent autoimmune diabetes in adults; T1D, type 1 diabetes; SEM, standard error of the mean; IgD+-m B cells, IgD+-memory B cells; SM B cells, switched memory B cells; FBG, fasting blood glucose; FCP, fasting C-peptide; ROC, receiver operating characteristic curve; AUC, area under the curve.
Fig. 2
Fig. 2
Functional and metabolic analysis of CD226+ B cells and CD226 B cells in T1D patients. (a) Peripheral blood B cells were categorised into CD226+ and CD226 B cells on the basis of CD226 expression in T1D. (b–d) Representative flow cytometry plots and scatter plots for paired t-tests of CD69 (n = 11), CD86 (n = 11) (b), HLA-DR (n = 11) (c), TNF-α, IFN-γ, IL-6, and IL-12 (n = 5) (d) expression in CD226+ and CD226 B cells from T1D patients. (e) Representative flow cytometry plots and scatter plots for paired t-tests of TNF-α and IL-6 expression in B cells between control group and anti-CD226 group (n = 6). (f) Representative flow cytometry plots and scatter plots for paired t-tests of 2-NBDG, BODIPY, and MITO expression in CD226+ and CD226 B cells from T1D patients (n = 5). ∗P < 0.05. ∗∗P < 0.01. ∗∗∗P < 0.001. ∗∗∗∗P < 0.0001. Abbreviations: T1D, type 1 diabetes; SSC-H, side scatter height; 2-NBDG, 2-deoxy-2-[(7-nitro-2,1,3-benzoxadiazol-4-yl)amino]-D-glucose; BODIPY, boron-dipyrromethene; MITO, MitoTracker® Deep Red FM.
Fig. 3
Fig. 3
Functional analysis of CD226+ B cells and CD226 B cells in NOD mice. (a) The expression levels of CD226 on B cells in PLN at 4, 8, and 12 weeks of age in NOD mice and 10–12 weeks of age in C57BL/6 mice (n = 5). One-way ANOVA followed by adjustments was used for multiple comparisons. (b) B cells were categorised into CD226+ and CD226 B cells on the basis of CD226 expression in the spleen and PLN of NOD mice. (c) Representative flow cytometry plots and scatter plots for paired t-tests of CD80, CD86, MHC II, and Ki67 expression in CD226+ and CD226 B cells from the spleen and PLN of NOD mice (n = 5). ∗P < 0.05. ∗∗P < 0.01. ∗∗∗P < 0.001. Abbreviations: NOD, non-obese diabetic; SSC-H, side scatter height; PLN, pancreatic lymph node.
Fig. 4
Fig. 4
NF-κB signalling drives the heightened inflammatory response in CD226+ B cells. (a) Volcano plot illustrating the differential expression of genes between CD226+ B cells and CD226 B cells in NOD mice (n = 5). The adjusted P value of each gene was determined by DESeq2 with Benjamini-Hochberg false discovery rate (FDR) correction. Genes meeting the criteria of adjusted P < 0.05 and fold change > 2.0 were considered significant. (b and c) Functional annotation analysis of DEGs using GO (b) and KEGG (c) analyses. Statistical disparities between enriched terms and pathways were adjusted utilising Bonferroni’s test, applying FDR adjusted P-value ≤ 0.05 to ensure accuracy. (d) GSEA for inflammatory response, positive regulation of cytokine production, positive regulation of cell cycle and NF-kappa B signalling pathway associated genes in CD226+ B cells versus CD226 B cells. (e) Quantitative real-time PCR (qPCR) analysis for NF-κB target genes expression in B cells from T1D patients and HC (n = 11). Student’s t-test was used for comparing two groups. (f) Representative flow cytometry plots and scatter plots for paired t-tests demonstrating the inhibition of CD226 expression in B cells upon QNZ treatment (n = 6). (g and h) Representative flow cytometry plots and scatter plots for paired t-tests demonstrating the inhibition of activation (g) and inflammatory cytokine production (h) in CD226+ B cells upon QNZ treatment (n = 6). (i) Representative flow cytometry plots and scatter plots for paired t-tests demonstrating the inhibition of CD226 expression in B cells upon BAY 11-7082 treatment (n = 5). (j and k) Representative flow cytometry plots and scatter plots for paired t-tests demonstrating the inhibition of activation (j) and inflammatory cytokine production (k) in CD226+ B cells upon BAY 11-7082 treatment (n = 5). ∗P < 0.05. ∗∗P < 0.01. ∗∗∗P < 0.001. Abbreviations: DEGs, differential express genes; GO, Gene Ontology; KEGG, Kyoto Encyclopedia of Genes and Genomes; GSEA, gene set enrichment analysis; NES, normalised enrichment score; HC, healthy controls; T1D, type 1 diabetes; ns, not significant; SSC-H, side scatter height.
Fig. 5
Fig. 5
IL-15 promotes the generation and activation of CD226+ B cells. (a) Forecasting the regulator of the CD226 gene. (b) Representative flow cytometry plots and line charts of CD226 expression on B cells isolated from T1D patients following 48-h culture with either medium control, 20 ng/ml IL-21, 20 ng/ml IL-4, or 20 ng/ml IL-15R alpha & IL-15 (n = 6). One-way repeated measures ANOVA followed by adjustments was used for multiple comparisons. Lines connect the same sample. (c–f) Representative flow cytometry plots and line charts of CD69 (c), CD86 (d), TNF-α (e), and IL-6 (f) expression in CD226+ B cells from T1D patients after 48-h indicated stimulation (n = 6). One-way repeated measures ANOVA followed by adjustments was used for multiple comparisons. Lines connect the same sample. (g) The levels of IL-15 in the serum of HC and T1D patients (n = 8). Student’s t-test was used for comparing two groups. (h) The expression of IL-15R (CD122 and CD132) was compared between CD226+ B cells and CD226 B cells in T1D patients (n = 10). Paired t-test was used for comparing two groups. (i) The expression of IL-15R (CD122 and CD132) was compared between HC and T1D patient B cells (n = 12). Student’s t-test was used for comparing two groups. ∗P < 0.05. ∗∗P < 0.01. Abbreviations: SSC-H, side scatter height; HC, healthy controls; T1D, type 1 diabetes.
Fig. 6
Fig. 6
Monocyte/macrophage-derived IL-15 promotes the generation and activation of CD226+ B cells. (a) IL-15 expression in peripheral blood cell types. The relative expression of IL-15 across immune cell types was analysed using the publicly available dataset GEO: GSE107019 as referenced (https://doi.org/10.1016/j.celrep.2019.01.041), and visualised in a bar chart. (b) IL-15 secretion of monocytes and CD8+ T cells in T1D patients and HC, as assessed by ELISA (n = 5). Student’s t-test was used for comparing two groups. (c) Representative flow cytometry plots and bar graphs of IL-15 expression in monocytes from T1D patients and HC (n = 7). Student’s t-test was used for comparing two groups. (d) Representative flow cytometry plots and bar graphs of IL-15 expression by macrophages in PLN from NOD mice and C57BL/6 mice (n = 6). Student’s t-test was used for comparing two groups. (e) Representative flow cytometry plots and line charts of CD226 expression on B cells isolated from T1D patients following 48-h culture with either medium control, 20 ng/ml IL-15R alpha & IL-15, 20 nM QNZ, or 20 ng/ml IL-15R alpha & IL-15 and 20 nM QNZ (n = 6). One-way repeated measures ANOVA followed by adjustments was used for multiple comparisons. Lines connect the same sample. (f and g) Representative flow cytometry plots and line charts of CD69 (f) and TNF-α (g) expression in CD226+ B cells from T1D patients after 48-h indicated stimulation (n = 6). One-way repeated measures ANOVA followed by adjustments was used for multiple comparisons. Lines connect the same sample. ∗P < 0.05. ∗∗P < 0.01. ∗∗∗P < 0.001. ∗∗∗∗P < 0.0001. Abbreviations: HC, healthy controls; T1D, type 1 diabetes; SSC-H, side scatter height; NOD, non-obese diabetic.
Fig. 7
Fig. 7
Blocking IL-15 signalling pathway prevents cyclophosphamide-accelerated diabetes in NOD mice. (a) Flowchart of in vivo anti-CD132 intervention in cyclophosphamide-accelerated NOD mice. (b) Survival curves of diabetes onset in the anti-CD132 group and isotype control group in cyclophosphamide-accelerated NOD mice (n = 5). Diabetes incidence was compared by the log-rank test for survival. (c) Blood glucose levels in the anti-CD132 group and isotype control group in cyclophosphamide-accelerated NOD mice (n = 5). Blood glucose levels were compared by two-way ANOVA. (d) Histopathological H&E staining images of pancreatic islets and insulitis scores from the anti-CD132 group and isotype control group in cyclophosphamide-accelerated NOD mice. Scale bar: 50 μm. Insulitis scores were compared by the chi-square test. (e) Flowchart of in vivo anti-IL-15 intervention in cyclophosphamide-accelerated NOD mice. (f) Survival curves of diabetes onset in the anti-IL-15 group and isotype control group in cyclophosphamide-accelerated NOD mice (n = 5). Diabetes incidence was compared by the log-rank test for survival. (g) Blood glucose levels in the anti-IL-15 group and isotype control group in cyclophosphamide-accelerated NOD mice (n = 5). Blood glucose levels were compared by two-way ANOVA. (h) Histopathological H&E staining images of pancreatic islets and insulitis scores from the anti-IL-15 group and isotype control group in cyclophosphamide-accelerated NOD mice. Scale bar: 50 μm. Insulitis scores were compared by the chi-square test. ∗P < 0.05. Abbreviations: NOD, non-obese diabetic; CYC, cyclophosphamide; i.p., intraperitoneally; H&E, haematoxylin and eosin.
Fig. 8
Fig. 8
Combination therapy with anti-CD3 and anti-CD132 synergistically reverts the type 1 diabetes in NOD mice. (a) Experimental design for the four indicated groups. (b) Diabetes remission rates among the four indicated groups (n = 15). Diabetes remission rates were compared by cox proportional hazards regression test. (c) Blood glucose levels among the four indicated groups (n = 15). Blood glucose levels were compared by two-way ANOVA followed by Tukey’s multiple comparison test. (d) Histopathological H&E staining images of pancreatic islets and insulitis scores among the four indicated groups. Scale bar: 50 μm. Insulitis scores were compared by the chi-square test. (e) Representative flow cytometry plots and bar graphs of the proportions of CD226+ B cells in the PLN among the four indicated groups (n = 5). One-way ANOVA followed by adjustments was used for multiple comparisons. (f) Representative flow cytometry plots and bar graphs of the expression of CD80 in B cells in the PLN among the four indicated groups (n = 5). One-way ANOVA followed by adjustments was used for multiple comparisons. (g) Representative flow cytometry plots and bar graphs of the expression of CD69 in CD4+ T cells in the PLN among the four indicated groups (n = 5). One-way ANOVA followed by adjustments was used for multiple comparisons. (h) Representative flow cytometry plots and bar graphs of the expression of CD69 in CD8+ T cells in the PLN among the four indicated groups (n = 5). One-way ANOVA followed by adjustments was used for multiple comparisons. ∗P < 0.05. ∗∗P < 0.01. ∗∗∗∗P < 0.0001. Abbreviations: NOD, non-obese diabetic; CYC, cyclophosphamide; i.p., intraperitoneally; Anti-CD3, anti-CD3 monoclonal antibody; Anti-CD132, anti-CD132 monoclonal antibody; H&E, haematoxylin and eosin; SSC-H, side scatter height.
Fig. 9
Fig. 9
Working model of the monocyte/macrophage-IL-15-CD226+ B cell axis in the immunopathogenesis of T1D. There is increased secretion of IL-15 by monocytes or macrophages in T1D. IL-15 secreted by monocytes or macrophages binds to IL-15Rβ/γc on B cells. This further enhances the expression of CD226 on B cell surfaces and increases their pro-inflammatory cytokine production, activation, and proliferative capacity. The NF-κB signalling pathway promotes the generation and pro-inflammatory responses of CD226+ B cells. Targeting the IL-15-IL-15R signalling pathway reverses inflammatory phenotypes, mitigating disease severity, thereby representing a promising therapeutic strategy for preventing T1D. Abbreviations: T1D, type 1 diabetes; GLUT1, glucose transporter type 1.

References

    1. Herold K.C., Delong T., Perdigoto A.L., Biru N., Brusko T.M., Walker L.S.K. The immunology of type 1 diabetes. Nat Rev Immunol. 2024;24(6):435–451. - PMC - PubMed
    1. Quattrin T., Mastrandrea L.D., Walker L.S.K. Type 1 diabetes. Lancet. 2023;401(10394):2149–2162. - PubMed
    1. Warshauer J.T., Bluestone J.A., Anderson M.S. New frontiers in the treatment of type 1 diabetes. Cell Metab. 2020;31(1):46–61. - PMC - PubMed
    1. Roep B.O., Tree T.I. Immune modulation in humans: implications for type 1 diabetes mellitus. Nat Rev Endocrinol. 2014;10(4):229–242. - PubMed
    1. Lernmark A., Larsson H.E. Immune therapy in type 1 diabetes mellitus. Nat Rev Endocrinol. 2013;9(2):92–103. - PubMed

MeSH terms