. 2025 Nov 11;58(11):2734-2752.e9.
doi: 10.1016/j.immuni.2025.08.014. Epub 2025 Sep 15.

Integrin CD103 expression in naive CD8+ T cells promotes cytokine-driven acquisition of memory phenotype and effector function

Affiliations

Integrin CD103 expression in naive CD8+ T cells promotes cytokine-driven acquisition of memory phenotype and effector function

Can Li et al. Immunity. .

Abstract

Integrin CD103 binds to E-cadherin, a cell adhesion molecule predominantly expressed on epithelial cells, thus mediating the tissue residency of CD103+ T cells in barrier sites. Importantly, circulating naive CD8+ T cells also express large amounts of CD103, but whether CD103 contributes to CD8+ T cell immunity beyond its role in cell adhesion is unclear. Here, we report that CD103 expression in naive CD8+ T cells facilitates their engagement with E-cadherin-expressing cells, promoting their acquisition of memory phenotype and effector function. Notably, dendritic cell (DC) subsets expressing E-cadherin and producing type I interferons and interleukin-12 (IL-12) were responsible for this process. As a corollary, the DC-specific loss of E-cadherin resulted in diminished effector CD8+ T cell differentiation and increased tumor susceptibility, while the forced expression of CD103 enhanced the effector functions and anti-tumor activity of CD8+ T cells, revealing a regulatory role for CD103 in cytotoxic T cell immunity.

Keywords: E-cadherin; IFN-β; IL-12; IL-15; dendritic cells.


Conflict of interest statement

Declaration of interests The authors declare no competing interests.

Figures
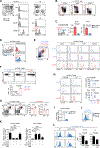
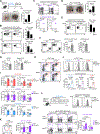
Figure 1.
Figure 1.. Characterization of CD103neg CD8+ T cells
(A) CD103 expression on thymocyte subsets (left) and CD4+ and CD8+ LN T cells (right) of C57BL/6 WT mice. (B) Expression of memory T cell markers on WT CD8+ LN T cells. CD103neg CD8+ T cells are identified by red boxes. (C) Frequencies of BrdU+ cells and IFN-γ+ cells in CD103neg and CD103+ WT CD8+ LN T cells. (D) CD103 expression on CD44loCD122lo versus CD44hiCD122hi WT CD8+ LN T cells. (E) Identification of three distinct CD8+ T cell subsets based on Ly6C versus CXCR3 (left): 1. Ly6CCXCR3 (LC.DN); 2. Ly6CintCXCR3 (L.SP); 3. Ly6ChiCXCR3+ (LC.DP). CD44, CD122, T-bet, and Eomes expression in LC.DN, L.SP, and LC.DP CD8+ LN T cells (right). (F) Frequencies of IFN-γ+ cells in LC.DN, L.SP, and LC.DP WT CD8+ LN T cells. (G) Frequencies and numbers of LC.DP CD8+ LN T cells in SPF and GF mice. (H) CD103 and β7 expression on LC.DN, L.SP, and LC.DP WT CD8+ LN T cells. (I-J) CD103 mRNA (I) and protein expression (J) in LC.DN CD8+ T cells after overnight (I) or 5–7 days of culture (J) with recombinant IL-15. (K) CD103 and Bcl-2 mRNA expression in LC.DN CD8+ T cells after overnight stimulation with recombinant IL-15 in the presence or absence of an Akt inhibitor (Wortmannin) or a STAT5/Akt dual inhibitor (Cat#124005, Calbiochem). (L) CD103 and β7 expression on LC.DN CD8+ LN T cells of WT and STAT5-CATg mice. Data are representative (A-B, D-E, J) of, or pooled (C, F-I, K-L) from 2–5 independent experiments (n=4–8/group). Error is expressed as ± SEM. Paired (C, I) and unpaired Student’s t-test (G, L), one-way ANOVA (F, H, K for CD103), and Kruskal-Wallis test (K for Bcl-2) were used. N.S., not significant. See also Figure S1, S2.
Figure 2.
Figure 2.. Identification and characterization of E-cadherin-expressing DCs
(A-B) Frequencies and numbers of CXCR3-gated CD44lo L.SP cells (A), and Ly6C expression on CXCR3-gated L.SP cells (B) in WT and Itgae−/− mice. (C) Schematic for adoptive transfer of Itgae−/− and CD45.1+ WT LC.DN cells into Thy1.1+ host mice (top), and the frequency and relative number of Thy1.2+ donor L.SP CD8+ T cells in pLNs of Thy1.1+ mice (right). (D-E) E-cadherin expression on thymic and pLN stromal cells (D), or pLN rDCs, mDCs, and pDCs (E) of WT mice. (F) Frequencies of mDCs, pDCs, and non-mDC/pDCs among E-cad+ DCs (top), and subpopulations of E-cad+ mDCs (bottom) in pLNs of WT mice. (G) UMAP plot of single-cell clusters after excluding contaminating NK/ILC1 cells. Clusters are color-coded. (H) Feature plots of ADT and gene expression of E-cadherin (CD324) in single-cell clusters from panel G. (I) Heatmap of transcripts for the indicated phenotypic markers in single-cell clusters from panel G. For some surface markers, expression of ADTs is also shown. Data are representative (D) of, or pooled (A-C, E-F) from 2–3 independent experiments (n=4–6/group). Error is expressed as ± SEM. Unpaired (A-B) and paired Student’s t-test (C), and one-way ANOVA (E-F) were used. N.S., not significant. See also Figure S2, S3.
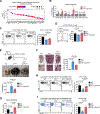
Figure 3.
Figure 3.. E-cad+ DCs induce L.SP CD8+ T cells by providing type I IFN signaling
(A-B) E-cadherin expression on rDCs, mDCs, and pDCs (A), and frequencies and numbers of CD44lo L.SP CD8+ T cells (B) in pLNs of Cdh1WT and Cdh1ΔDC mice. (C) Schematic for the adoptive transfer of CD45.1+ WT LC.DN cells into Cdh1WT or Cdh1ΔDC host mice, and the frequencies and numbers of donor L.SP CD8+ T cells in pLNs of indicated host mice. (D) GSEA of STAT1 signaling-related signature genes using RNA-Seq data of WT and Itgae−/− LC.DN CD8+ T cells. (E) Frequencies and numbers of CD44lo L.SP CD8+ T cells in pLNs of Stat1WT and Stat1ΔT mice. (F) Frequencies of L.SP cells after 2 days of in vitro culture of LC.DN CD8+ T cells in survival medium (+IL-7) with or without IFN-β or IFN-γ. (G) Schematic for the adoptive transfer of CD45.2+ Ifnar1−/− and CD45.1+ WT LC.DN cells into Thy1.1+ host mice, and the frequencies and relative numbers of L.SP cells in pLNs of Thy1.1+ mice. (H) CD44lo L.SP cells among pLN CXCR3 CD8+ T cells of PBS-injected Cdh1WT and Cdh1ΔDC mice, and IFN-β-injected Cdh1ΔDC mice after 24 hours of injection. Bar graphs show the frequency of L.SP cells and the abundance of Ly6C proteins on L.SP cells. (I) Frequencies of Ifnb1-EYFP+ cells among E-cadherin-expressing CD207 mDCs, CD207+ mDCs, and pDCs after in vitro stimulation of CpG for 24 hours. (J-K) L.SP cell differentiation upon 4 days of in vitro culture of LC.DN CD8+ T cells from CD45.1+ WT and CD45.2+ Ifnar1−/− mice in survival medium with or without CpG, IFN-β, CpG-stimulated pDC (J), or supernatants from CpG-stimulated pDC (K). Data are representative (A) of, or pooled (B-C, E-K) from 2–3 independent experiments (n=4–6/group). Error is expressed as ± SEM. Unpaired (B-C, E, J-K) and paired (G) Student’s t-test, and one-way ANOVA (F, H-I) were used. N.S., not significant. See also Figure S4.
Figure 4.
Figure 4.. CD103 controls the size and composition of the MP CD8+ T cell pool
(A) Schematic and experimental results of B16-F10-OVA melanoma lung metastasis in Cdh1WT and Cdh1ΔDC mice with adoptive transfer of LC.DN OT-I cells. Scale bar=1 cm. (B) IFN-γ and GzmA expression in donor OT-I cells from the lung of B16-F10-OVA cell-inoculated Cdh1WT and Cdh1ΔDC mice with adoptive transfer of LC.DN OT-I cells. (C) Frequencies and relative numbers of L.SP cells among donor cells from pLNs of Thy1.1+ host mice with adoptive transfer of 1:1 mixed CD45.1+ OT-I and CD45.2+ OT-IItgae−/− LC.DN cells. (D-E) Lung metastasis (D) and IFN-γ expression in donor OT-I cells (E) of B16-F10-OVA cell-inoculated Thy1.1+ host mice with adoptive transfer of OT-I or OT-IItgae−/− LC.DN cells. (F) CD103 expression on CD8+ LN T cells and the frequency of CD8+ LN T cells in WT and CD103Tg mice. (G) CD8+ T cell numbers in LNs and spleens of WT and CD103Tg mice. (H-I) Contour plots (H), and frequencies and numbers (I) of LC.DN, L.SP, and LC.DP CD8+ T cells in LNs and spleens of WT and CD103Tg mice. (J) CD103 expression on LC.DN, L.SP, and LC.DP CD8+ LN T cells of WT and CD103Tg mice. (K) Ly6C expression on CXCR3-gated L.SP CD8+ LN and spleen T cells of WT and CD103Tg mice. (L) Schematic for the adoptive transfer of unlabeled CD45.1+ WT, CTB-labeled Itgae−/− and CTV-labeled CD103Tg LC.DN CD8+ T cells into Cdh1WT or Cdh1ΔDC host mice, and the CD103 expression on donor CD8+ T cells and frequencies of donor L.SP CD8+ T cells in pLNs of indicated mice. Data are representative (H) of, or pooled (A-G, I-L) from 2–10 independent experiments (n=3–16/group). Error is expressed as ±SEM. Unpaired (A-B, D-E, F for CD103 ΔMFI, G, I-J) and paired Student’s t-test (C), Mann-Whitney test (F for CD8+ frequency), and two-way ANOVA (K-L) were used. N.S., not significant. See also Figure S5.
Figure 5.
Figure 5.. CD103 overexpression promotes the survival of MP CD8+ T cells
(A) Pearson correlation matrix of RNA-Seq datasets of LC.DP CD8+ T cells from WT and CD103Tg mice (left). Volcano plot shows DEGs that are either significantly upregulated (red), significantly downregulated (blue), or not significantly altered (gray). (B) Frequencies of BrdU+ cells among LC.DN, L.SP, and LC.DP CD8+ T cells of WT and CD103Tg mice. (C) Frequencies of active caspase-3+Annexin V+ cells among LN and splenic LC.DP CD8+ T cells of WT and CD103Tg mice. (D) Bubble plot of significantly enriched pathways involved in cell death and survival identified from the RNA-Seq data of LC.DP cells (CD103Tg/WT). Each bubble represents a pathway, and the x-axis shows the activation z-score of each pathway calculated by IPA. Color and size of the bubbles correspond to the −log10 adjusted P value and number of genes enriched in the pathway, respectively. (E) GSEA demonstrates significant enrichment in gene sets associated with apoptosis (left), and heatmap shows the expression of DEGs involved in cell survival (right). (F-G) Bcl-2, Bcl-xL, and Id2 mRNA (F) and protein expression (G) in LC.DP CD8+ LN T cells of WT and CD103Tg mice. (H) Frequencies of L.SP and LC.DP CD8+ LN T cells, and LC.DP versus L.SP cell ratios in WT and CD103Tg mice. (I) Schematic for adoptive transfer experiments, and frequencies of donor LC.DP CD8+ T cells in LNs of Rag2−/− host mice. (J) E-cadherin-mediated cell adhesion assay of LC.DP CD8+ LN T cells from WT and CD103Tg mice. Data are pooled (B-C, F-J) from 2–10 independent experiments (n=4–16/group). Error is expressed as ± SEM. Unpaired Student’s t-test (B-C, F-I) and two-way ANOVA (J) were used. N.S., not significant. See also Figure S5 and Table S1.
Figure 6.
Figure 6.. E-cad+ DC-derived IL-12 drives MP CD8+ T cell differentiation
(A-B) Representative contour plots (A), and frequencies and numbers of LC.DP CD8+ T cells (B) in LNs and spleens of WT, Il15−/−, and Il15−/−CD103Tg mice. (C) Frequencies of L.SP and LC.DP CD8+ LN T cells, and LC.DP versus L.SP cell ratios in Il15−/− and Il15−/−CD103Tg mice. (D) Frequencies of L.SP and LC.DP cells after 4 days of coculturing L.SP CD8+ T cells with E-cadherin-expressing pDCs, CD207+ mDCs, or CD207 mDCs from Il15−/− mice in IFN-β-supplemented survival medium. (E) Heatmap of indicated cytokine expression in the potential E-cadherin-expressing single-cell clusters, and violin plots of Il12b and Il15 expression in all single-cell clusters (from panel Figure 2G). (F) Frequencies of IL-12-producers among E-cad+ DCs (CD207+ mDC, CD207 mDC, and pDC) after 4 hours of BFA treatment in the presence or absence of LPS. (G) IL-12Rβ1 versus IL-12Rβ2 mRNA expression in LC.DN, L.SP, and LC.DP CD8+ T cells. (H) GSEA showing the enrichment of IL-12-STAT4 signaling-related genes in RNA-Seq data of LC.DP cells (CD103Tg/WT). Ly6a (indicated by the black line) was one of the top-ranked genes. (I) Ly6A expression on LC.DP CD8+ LN T cells of WT and CD103Tg mice. (J) Frequencies of LC.DP cells after 4 days of culture of L.SP CD8+ T cells in IFN-β-supplemented survival medium with or without IL-12 or IL-15. Data are representative (A, D) of, or pooled (B-C, F-G, I-J) from 2–12 independent experiments (n=6–15/group). Error is expressed as ± SEM. One-way ANOVA (B, J), unpaired Student’s t-test (C, I), and two-way ANOVA (F) were used. N.S., not significant. See also Figure S6, S7.
Figure 7.
Figure 7.. CD103 overexpression promotes CD8+ T cell effector function independently of IL-15
(A) Bubble plot of effector function-related genes. Each bubble represents a gene (x-axis), and the y-axis shows the log2FC in gene expression identified by RNA-Seq analysis of LC.DP cells (CD103Tg/WT). The color and size of bubbles correspond to the −log10 adjusted P value and average expression (AveExpr) of the gene, respectively. (B) qRT-PCR analysis of indicated genes in LC.DP CD8+ T cells of Il15−/− and Il15−/−CD103Tg mice. (C-D) Frequencies of IFN-γ-producing cells (C) and Id2 expression (D) in LC.DP CD8+ LN T cells of WT, Il15−/−, and Il15−/−CD103Tg mice. (E) Schematic illustration of B16-F10 melanoma metastasis and experimental results from WT, Il15−/−, and Il15−/−CD103Tg mice (top). Bar graph shows the number of metastatic nodules on day 14 after tumor inoculation (bottom). Scale bar=1 cm. (F) H&E staining of B16-F10 melanoma metastatic nodules in lungs of WT, Il15−/−, and Il15−/−CD103Tg mice (left). Bar graph (right) shows the tumor burden as percent tumor area. Scale bar=500 μm. (G-I) GzmB expression (G), and frequencies of IFN-γ-producing cells (H) and GzmA-producing cells (I) in lung CD8+ T cells of B16-F10 melanoma-inoculated WT, Il15−/−, and Il15−/−CD103Tg mice. Data are pooled (B-I) from 3–4 independent experiments (n=4–10/group). Error is expressed as ± SEM. Unpaired Student’s t-test (B) and one-way ANOVA (C-I) were used. N.S., not significant. See also Figure S7.

References

    1. Makaroff LE, Hendricks DW, Niec RE, and Fink PJ (2009). Postthymic maturation influences the CD8 T cell response to antigen. Proc Natl Acad Sci U S A 106, 4799–4804. 10.1073/pnas.0812354106. - DOI - PMC - PubMed
    1. Jameson SC, Lee YJ, and Hogquist KA (2015). Innate memory T cells. Adv Immunol 126, 173–213. 10.1016/bs.ai.2014.12.001. - DOI - PMC - PubMed
    1. Kwesi-Maliepaard EM, Jacobs H, and van Leeuwen F (2021). Signals for antigen-independent differentiation of memory CD8(+) T cells. Cell Mol Life Sci 78, 6395–6408. 10.1007/s00018-021-03912-9. - DOI - PMC - PubMed
    1. Quinn KM, Fox A, Harland KL, Russ BE, Li J, Nguyen THO, Loh L, Olshanksy M, Naeem H, Tsyganov K, et al. (2018). Age-Related Decline in Primary CD8(+) T Cell Responses Is Associated with the Development of Senescence in Virtual Memory CD8(+) T Cells. Cell Rep 23, 3512–3524. 10.1016/j.celrep.2018.05.057. - DOI - PubMed
    1. Haluszczak C, Akue AD, Hamilton SE, Johnson LD, Pujanauski L, Teodorovic L, Jameson SC, and Kedl RM (2009). The antigen-specific CD8+ T cell repertoire in unimmunized mice includes memory phenotype cells bearing markers of homeostatic expansion. J Exp Med 206, 435–448. 10.1084/jem.20081829. - DOI - PMC - PubMed

MeSH terms

LinkOut - more resources