. 2025 Sep 16;16(1):8289.
doi: 10.1038/s41467-025-63440-z.

Transgenerational inheritance of diminished ovarian reserve triggered by prenatal propylparaben exposure in mice

Affiliations

Transgenerational inheritance of diminished ovarian reserve triggered by prenatal propylparaben exposure in mice

Milu Li et al. Nat Commun. .

Abstract

Diminished ovarian reserve (DOR) is associated with heightened risk of infertility, premature menopause, and various long-term health issues. Our previous research demonstrated a correlation between prenatal propylparaben exposure and DOR in F1 mice. Here, we further reveal that the DOR phenotypes can be transgenerationally inherited in F1-F3 mice, manifested through increased follicular atresia and decreased anti-Müllerian hormone levels. Excessive apoptosis of granulosa cells is found to underlie these pathological processes. By combining diverse sequencing techniques, we identify persistent Rhobtb1 hypomethylation across multiple generations. Further exploration reveals that RhoBTB1 regulates FGF18 via ubiquitination, triggering MAPK pathway activation and subsequent granulosa cell apoptosis. Notably, similar Rhobtb1 hypomethylation patterns are observed in blood samples from DOR patients. Furthermore, intervention with a methyl-donor diet effectively ameliorates DOR phenotypes in F1-F3 offspring. These findings highlight the transgenerational effects of DOR, elucidate its underlying causes and pathogenic mechanisms, and propose potential epigenetic therapy strategies.


Conflict of interest statement

Competing interests: The authors declare no competing interests.

Figures
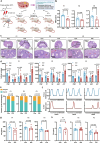
Fig. 1
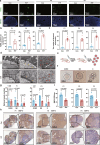
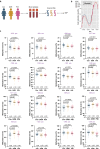
Fig. 1. Prenatal PrP exposure induced transgenerational transmission of diminished ovarian reserve to multiple generations.
a Schematic illustration of the animal experimental design. b AMH concentrations in the serum of F1–F3 female offspring mice in control (Con) and prenatal PrP exposure (PrP) at 12 w (F1 n = 8, F2 n = 7, F3 n = 7 biological replicates). Data are presented as mean ± SEM (unpaired two-tailed t-test). c Representative ovarian HE staining images of F1–F3 offspring mice in Con and PrP groups at 12 w. Red arrow: atretic follicles. d The number of follicles of F1–F3 female offspring mice in Con and PrP groups at 12 w (n = 5 biological replicates). Data are presented as mean ± SEM (unpaired two-tailed t-test). e The proportion of regular and irregular estrous cycles in Con and PrP groups of F1–F3 offspring mice at 12 w (F1 n = 36, F2 n = 20, F3 n = 30 for each group; Chi-squared test, two-sided). f Representative estrous cycles of F3 offspring mice in Con and PrP groups at 12 w. g Levels of serum E2 in F1–F3 offspring mice with or without prenatal PrP exposure (F1 n = 5, F2 n = 6, F3 n = 7 biological replicates). Data are presented as mean ± SEM (unpaired two-tailed t-test). h Levels of serum P4 in F1–F3 offspring mice with or without prenatal PrP exposure (F1 n = 5, F2 n = 8, F3 n = 7 biological replicates). Data are presented as mean ± SEM (unpaired two-tailed t-test). PMF: primordial follicles, PF: primary follicles, SF: secondary follicles, ANF: antral follicles, ATF: atretic follicles. Source data are provided as a Source Data file. Figure 1a is created in BioRender. Wang, S. (2025) https://BioRender.com/jnngb84.
Fig. 2
Fig. 2. Excessive granulosa cell apoptosis and deteriorated oocyte quality were observed in multiple generations.
a Representative ovarian images for TUNEL staining of F1–F3 offspring mice in Con and PrP groups at 12 w. b The number of TUNEL-positive cells per 1 mm2 in ovarian sections of F1–F3 offspring mice in Con and PrP groups (n = 5 biological replicates). Data are presented as mean ± SEM (unpaired two-tailed t-test). c The number of abnormal mitochondria in mice ovaries of F1–F3 generation (n = 3 biological replicates, two non-overlapping microscope fields per ovary). Data are presented as mean ± SEM (unpaired two-tailed t-test). d Representative TEM images of mice ovaries in F3 generation. Yellow arrow: synapses of granulosa cells. M: mitochondria. The experiment was repeated three times. e Schematic illustration of the ovulation induction. f Representative oocyte images after ovulation induction. g The number of oocytes of F1 and F3 offspring mice in Con and PrP groups after ovulation induction (F1 n = 9; F3 Con n = 6, PrP n = 5 biological replicates). Data are presented as mean ± SEM (unpaired two-tailed t-test). h Representative IHC images showing immunoreactivity against BMP15 in F1, F2 and F3 offspring ovaries. i IHC scores based on IOD/Area of anti-BMP15 in F1, F2 and F3 offspring ovaries (n = 5 biological replicates). Data are presented as mean ± SEM (unpaired two-tailed t-test). Source data are provided as a Source Data file. Figure 2e is created in BioRender. Wang, S. (2025) https://BioRender.com/bz8sq44.
Fig. 3
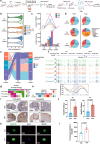
Fig. 3. Hypomethylated Rhobtb1 might mediate the transgenerational inheritance of DOR.
a Flowchart illustrating the WGBS process for ovarian tissues from F2 and F3 offspring (F2 ovaries n = 3 biological replicates; F3 ovaries Con n = 3, PrP n = 4 biological replicates), and scWGBS process for MII oocytes from F2 generation mice (F2 oocyte samples n = 3 biological replicates, 12 oocytes per sample). b The global DNA methylation levels of CpG sites in ovaries and oocytes of offspring mice are displayed in violin plots. The orange point represents median methylation level. c The number of DMRs and their associated genes in F2 and F3 ovarian tissues and F2 oocytes. d Plot illustrating the proportion of methylation areas falling within different genomic characteristics according to functional categorization. For locations that are hypomethylated and hypermethylated, plots are displayed. e Sankey diagram describing the methylation changes of all DMRs detected in the F2, F3 ovarian tissues and F2 oocytes between generations. f With DNA methylation peaks in the ovarian tissues and oocytes of control versus PrP-exposed offspring mice, representative UCSC Genome Browser views of the Rhobtb1 gene are shown. g The heatmap showing the methylation patterns in Rhobtb1 promoter region across control and PrP-exposed offspring. h The heatmap showing the expression of Rhobtb1 in F3 offspring ovaries (n = 3 biological replicates). i Representative IHC images of RhoBTB1 positivity in mouse ovaries of the F2 and F3 generations. j IHC scores based on IOD/Area of anti-RhoBTB1 in F2 and F3 offspring ovaries (n = 5 biological replicates). Data are presented as mean ± SEM (unpaired two-tailed t-test). k Representative immunofluorescence (IF) images showing immunoreactivity against RhoBTB1 in oocytes of F2 generation. l The fluorescence intensity of RhoBTB1 in oocytes of F2 generation (n = 6 biological replicates). Data are presented as mean ± SEM (unpaired two-tailed t-test). Source data are provided as a Source Data file. Figure 3a is created in BioRender. Wang, S. (2025) https://BioRender.com/pdr6sxc and https://BioRender.com/ao6ux02.
Fig. 4
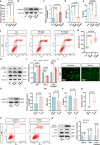
Fig. 4. The hypomethylation and overexpression of Rhobtb1 led to DOR by inducing GC apoptosis.
a The methylation levels of CpG site −1555 to TSS in the promoter region of Rhobtb1 following PrP exposure (n = 5 biological replicates). Data are presented as mean ± SEM (one-way ANOVA). b, c Protein levels of RhoBTB1 in KGN cells following PrP exposure. Data from (c) represent three independent experiments (mean ± SEM; one-way ANOVA). d AMH levels in KGN cells following PrP exposure (n = 3 biological replicates). Data are presented as mean ± SEM (one-way ANOVA). e E2 levels in KGN cells following PrP exposure (n = 3 biological replicates). Data are presented as mean ± SEM (one-way ANOVA). f, g Violin plot showing the apoptosis ratio of KGN cells after PrP exposure (n = 3 biological replicates; one-way ANOVA). The black dotted line represents median ratio. h, i The protein levels of BAX, BCL-2, and active-Caspase3 in KGN cells tested by western blotting following PrP exposure. Data from (i) represent three independent experiments (mean ± SEM; one-way ANOVA). j Representative images showing the infection of adenovirus with and without encoding Rhobtb1 in KGN cells. The experiment was repeated three times. k, l Protein levels of RhoBTB1 in GCs detected by western blotting following RhoBTB1 overexpression. Data from (l) represent three independent experiments (mean ± SEM; unpaired two-tailed t-test). m AMH levels in GCs following RhoBTB1 overexpression (n = 5 biological replicates). Data are presented as mean ± SEM (unpaired two-tailed t-test). n E2 levels in GCs following RhoBTB1 overexpression (n = 5 biological replicates). Data are presented as mean ± SEM (unpaired two-tailed t-test). o, p Violin plot showing the apoptosis ratio of GCs after RhoBTB1 overexpression (n = 3 biological replicates; unpaired two-tailed t-test). The black dotted line represents median ratio. q, r The protein levels of BAX, BCL-2, and active-Caspase3 in GCs detected by western blotting following RhoBTB1 overexpression. Data from (r) represent three independent experiments (mean ± SEM; unpaired two-tailed t-test). Source data are provided as a Source Data file.
Fig. 5
Fig. 5. Prenatal PrP exposure result in altered ovarian transcriptomic profiles and DNA methylation patterns in F3 offspring.
a Schematic representation of the process of RNA-seq and WGBS of ovaries from F3 generation mice. b Gene expression differences between F3 control and PrP-exposed ovaries are shown in a volcano plot (n = 4 biological replicates). The volcano plot represents the estimated log2 fold change as a function of the mean of normalized counts. The selection of significant genes required p-value of less than 0.05. c, d Upregulated and downregulated KEGG metabolic pathway in RNA-seq of F3 offspring ovaries. The p-value for significance is less than 0.05. e, g, i The heatmaps showing RNA expression patterns of genes associated with oxidative phosphorylation, p53 signaling pathway, and steroid biosynthesis in the ovaries of F3 generation mice respectively. f, h, j Relative mRNA expression levels of genes related to oxidative phosphorylation, p53 signaling pathway, and steroid biosynthesis in the ovaries of F3 generation mice respectively (n = 3 biological replicates). Data are presented as mean ± SEM (unpaired two-tailed t-test). k Circos plot showing the distribution of identified DMRs on each chromosome of F3 mouse ovarian tissues (Con n = 3, PrP n = 4 biological replicates). l Lollipop plots comparing the number of DMRs with the number of DMRs mapped to genes in F3 mouse ovarian tissues. m Plot illustrating the proportion of methylation areas falling within different genomic characteristics according to functional categorization. For locations that are hypomethylated and hypermethylated, plots are displayed. n Integrated evaluation of gene expression and DNA methylation levels. o Venn diagram shows the overlap between genes associated with hypermethylated and hypomethylated regions in ovarian tissues of PrP-exposed F3 mice (WGBS data) with the DEGs (n = 3 biological replicates) obtained from the RNA-seq analysis. p The table provides the five common genes found between WGBS and the RNA-seq. It details the methylation status, changes in gene expression, gene ontology related ovarian function, and references when it applies. Source data are provided as a Source Data file. Figure 5a is created in BioRender. Wang, S. (2025) https://BioRender.com/1uwa8dw.
Fig. 6
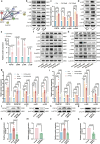
Fig. 6. RhoBTB1 induced GC apoptosis by up-regulating FGF18 and activating the MAPK pathway via a ubiquitination-dependent pathway.
a STRING database revealed strong interactions between RhoBTB1 and FGF18, RhoBTB1 and CTSK, respectively. b, c The protein levels of FGF18 and MAPK signaling pathway in KGN cells detected by western blotting following PrP exposure. Data from (c) are representative of three independent experiments (mean ± SEM; one-way ANOVA). d, e The protein levels of FGF18 and MAPK signaling pathway in KGN cells detected by western blotting following RhoBTB1 over-expression. Data from (e) are representative of three independent experiments (mean ± SEM; unpaired two-tailed t-test). f, g The protein levels of FGF18, RhoBTB1, and MAPK signaling pathway in GCs detected by western blotting following PrP exposure and siRNA-F02 interference of Fgf18. Data from (g) are representative of three independent experiments (mean ± SEM; one-way ANOVA). h, i The protein levels of RhoBTB1, FGF18, and MAPK signaling pathway in GCs detected by western blotting following PrP exposure and siRNA-R03 interference of Rhobtb1. Data from (i) are representative of three independent experiments (mean ± SEM; one-way ANOVA). j, k The protein levels of FGF18 in GCs following PrP exposure and MLN4924 treatment. Data from (k) are representative of three independent experiments (mean ± SEM; one-way ANOVA). l, m The protein levels of FGF18 in GCs following RhoBTB1 over-expression and MLN4924 treatment. Data from (m) are representative of three independent experiments (mean ± SEM; unpaired two-tailed t-test). n, o The protein levels of FGF18 in GCs following PrP exposure and MG132 treatment. Data from (o) are representative of three independent experiments (mean ± SEM; one-way ANOVA). p, q The protein levels of FGF18 in GCs following RhoBTB1 over-expression and MG132 treatment. Data from (q) are representative of three independent experiments (mean ± SEM; unpaired two-tailed t-test). The samples derived from the same experiment and that blots were processed in parallel. Source data are provided as a Source Data file.
Fig. 7
Fig. 7. Hypomethylated Rhobtb1 in blood samples may indicate DOR/POI in women.
a Illustration of the experimental plan in a schematic form. In a case-control research, genomic DNA was extracted from the blood samples. BSP was conducted by using specific primers for Rhobtb1. b Methylation levels in the promoter region of Rhobtb1. c The methylation levels of CpG sites −2632, −2621, −2593, −2577, −1555, −1396, −1391, −1349, −1311, −1259, −809, −805, −800, −1532, −1345, and −1247 to TSS in the promoter region of Rhobtb1 in women without and with DOR/POI (Con n = 60, DOR n = 63, POI n = 60 patients). Data are presented as mean ± SEM (unpaired two-tailed t-test). Source data are provided as a Source Data file. Figure 7a is created in BioRender. Wang, S. (2025) https://BioRender.com/69kr5sg.
Fig. 8
Fig. 8. Epigenetic therapy ameliorated DOR induced by prenatal PrP exposure in F1–F3 offspring mice.
a Scheme for the animal experiment. b The percentage of mice with normal and irregular estrous cycles at 12 weeks (w) (F1 Con n = 8, PrP n = 10, PrP+MD n = 13, MD n = 13; F2 Con n = 9, PrP n = 12, PrP+MD n = 12, MD n = 11; F3 Con n = 19, PrP n = 23, PrP+MD n = 22, MD n = 18; Fisher’s exact test). c AMH concentrations in the serum of F1–F3 female offspring mice with or without PrP/methyl-donor diet (MD) treatment at 12 w (n = 6 biological replicates). Data are presented as mean ± SEM (one-way ANOVA). df The number of follicles in F1–F3 offspring mice at 12 w with or without PrP/MD treatment (n = 5 biological replicates). Data are presented as mean ± SEM (one-way ANOVA). g Representative ovarian images for TUNEL staining of F1–F3 offspring mice with or without PrP/MD treatment at 12 w. h The number of TUNEL-positive cells per 1 mm2 in ovarian sections of F1–F3 offspring mice with or without PrP/MD treatment at 12 w (n = 5 biological replicates). Data are presented as mean ± SEM (one-way ANOVA). i Representative IHC images showing immunoreactivity against RhoBTB1 in F1–F3 offspring ovaries at 12 w with or without PrP/MD treatment. j IHC scores based on IOD/Area of anti-RhoBTB1 in F1–F3 offspring ovaries at 12 w with or without PrP/MD treatment (n = 5 biological replicates). Data are presented as mean ± SEM (one-way ANOVA). Source data are provided as a Source Data file. Figure 8a is created in BioRender. Wang, S. (2025) https://BioRender.com/aaoydng.

References

    1. Sharara, F. I., Scott, R. T. Jr. & Seifer, D. B. The detection of diminished ovarian reserve in infertile women. Am. J. Obstet. Gynecol.179, 804–812 (1998). - PubMed
    1. Devine, K. et al. Diminished ovarian reserve in the United States assisted reproductive technology population: diagnostic trends among 181,536 cycles from the Society for Assisted Reproductive Technology Clinic Outcomes Reporting System. Fertil. Steril.104, 612–619 (2015). - PMC - PubMed
    1. Canipari, R., De Santis, L. & Cecconi, S. Female fertility and environmental pollution. Int. J. Environ. Res. Public. Health17, 8802 (2020). - PMC - PubMed
    1. Barker, D. J. & Osmond, C. Infant mortality, childhood nutrition, and ischaemic heart disease in England and Wales. Lancet1, 1077–1081 (1986). - PubMed
    1. Nilsson, E. E., Sadler-Riggleman, I. & Skinner, M. K. Environmentally induced epigenetic transgenerational inheritance of disease. Environ. Epigenet.4, 1–13 (2018). - PMC - PubMed

MeSH terms

LinkOut - more resources