. 2025 Sep 16;16(1):8295.
doi: 10.1038/s41467-025-63990-2.

A mesothelial differentiation gateway drives fibrosis

Affiliations

A mesothelial differentiation gateway drives fibrosis

Safwen Kadri et al. Nat Commun. .

Abstract

Internal organs are encased by a supportive epithelial monolayer of mesodermal origin, termed mesothelium. The nature, evolution and function of mesothelial cells, and their genetic regulation impacting disease development are insufficiently understood. Here, we generate a comprehensive organ-wide single-cell transcriptomic compendium of mesothelium across healthy and diseased mouse and human organs, delineating the evolution of conserved activated states of mesothelial cells in response to disease. We uncover genetic drives behind each cell state and reveal a conserved metabolic gate into multipotent proteolytic, inflammatory and fibrotic cell differentiation, in mouse and human. Using lung injury models in mice, in combination with mesothelial cell-specific viral approaches, we show that direct metabolic reprogramming using Ifi27l2a and Crip1 on organ surfaces, blocks multipotent differentiation and protects mouse lungs from fibrotic disease. These findings place mesothelial cells as cellular exemplars and gateway to fibrotic disease, opening translational approaches to subvert fibrosis across a range of clinical indications.


Conflict of interest statement

Competing interests: The authors declare the following competing interests: A.F., M.M., S.K., and Y.R. have filed patent application WO2023079127A1 covering the use of these methods to study and manipulate mesothelial cells in lung fibrosis. The remaining authors declare no competing interests.

Figures

Fig. 1
Fig. 1. Steady-state and disease mouse mesothelial cell atlas.
a Schematic representation of the experimental procedure for the generation of the healthy state mouse mesothelial cell atlas. Thirty-two single cell datasets of healthy mouse mesothelial cells in twelve different organs were collected and integrated for the single-cell atlas generation. Preprocessed data and raw data were processed, annotated and then we extracted the mesothelial cells cluster based on the expression of Msln, Pdpn, Wt1 and the absence of Cd45, Cd34 and Epcam. Batch effect was then removed, and datasets were merged and analyzed. b UMAP embedding of 23,134 single cells in the steady-state atlas. The eight clusters identified through graph-based clustering are labeled with the most discriminative gene and indicated by different colors. c Hierarchical clustering of the different mesothelial cells, depending on the tissue of origin showing the hiearchy of the mesothelial cells in the different tissues. d UMAP embedding of 5,601 single cells in the mesothelial disease-state atlas. The three clusters identified through graph-based clustering are indicated by different colors. e UMAP embedding of the mesothelial disease-state atlas color coded with the expression of the highest enriched reactome terms. f Gene markers of the different disease states of the mesothelial cells. UMAP of mouse disease state mesothelial cell atlas, color coded for the different cluster markers. On the left bottom, is a heat map of the relative average expression, of the most strongly enriched genes for each cluster in the mesothelial disease state atlas (log(fold change), of one cluster versus all others. Created in BioRender. Kadri, S. (2025) https://BioRender.com/2qncy1b.
Fig. 2
Fig. 2. Time-resolved scRNA-seq data of mesothelial cells in the lung Bleomycin-induced fibrosis model.
a Schematic of the sample preparation for the high-resolution mesothelial cell scRNA-seq dataset. Wild type mice received a single shot of Bleomycin at day 0. Lungs were harvested on the selected days (day 2 to day 54) and digested. Single cell suspensions were then sorted using Max sorting (negative gating for Cd45, Cd31, Ter119, Lyve1). Single cell suspensions were analyzed using scRNAseq. b UMAP of the time-scaled high-resolution mouse Bleomycin mesothelial cell dataset, color-coded for the newly identified lineages. c UMAP of the novel mesothelial cell lineages, highlighting the expression of the gene markers of the different clusters: Klf9 for Healthy, Ifi27l2a for metabolically active, Dcn for proteolytic, Saa3 for immune-modulator and Mgp for fibrogenic. d Partition-based graphic abstraction of the trajectories between the different identified populations. Upon Bleomycin installation, mesothelial cells differentiate to metabolically active cells. These metabolically active cells give rise to proteolytic cells. The proteolytic cells differentiate into immune modulator cells then into fibrogenic cells which eventually revert back to metabolically active cells. e Graphic predicting trajectory of interconversion of different mesothelial cell population relative abundance during Bleomycin-induced injury (x axis, day 0 to day 54). Up-regulated genes are shown for each step in the illustration underneath. f Gene driver plot, produced using the CellRank package, of the differentiation from metabolically active to proteolytic (right plot) and from Immune modulator to Fibrogenic. Plots highlight the most distinguishing genes corrrelating with the phenotype differentiation process. Created in BioRender. Kadri, S. (2025) https://BioRender.com/onyksnk.
Fig. 3
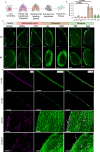
Fig. 3. Ex vivo functional validation of the mesothelial cell populations.
a Schematic representation of the precision cut lung slice protocol, in which mesothelial cells were transfected and ECM surface was labeled to assess ECM digestion and inward movement. The first step after lung harvesting was lung incubation with the viral particles (2 h) followed by the ECM labeling using NHS-FITC. The lung slices were cultured for 5 days. b Histogram of ECM movement (x axis) inside the lung slices after culture for 5 days with the overexpressed genes indicated on the y axis, colored according to the legend underneath. N = 3 biological replicates (C57BL/6J WT mice) and three independent experiments. A two-sided independent T-test was used for the comparison of two groups. Data are presented as mean values ± SEM. Source data are provided as a Source Data file. c Fluorescent microscopy images of lung slices, that had their surface ECM labeled at day 0, and were then transfected with the indicated AAVs: control virus, Ifi27l2a and Scd1 (markers of metabolically active), Dcn and Plac8 (markers of proteolytic), Mgp and Sparc (markers of fibrogenic). The thickness of the surface is indicated by white bars. N = 3 biological replicates (C57BL/6J WT mice) and three independent experiments. Scale bar is 2 mm. d High magnification multiphoton microscope images of the lung slices after 5 days of culture, highlighting the surface ECM (green labeling) and transfected mesothelial cells (magenta). Note the enormous increase of ECM in Dcn- and Plac8-transfected slices and the punctate expression of those proteins (white arrows in the merged image). N = 3 biological replicates (C57BL/6J WT mice) and three independent experiments. Scale bar is 100 µm.Created in BioRender. Kadri, S. (2025) https://BioRender.com/wburpzt.
Fig. 4
Fig. 4. Metabolically active mesothelial cell differentiation genes drive fibrosis.
a Treatment scheme for candidate gene overexpression in lung mesothelium. b Ashcroft scores by using the trichrome staining of the lung sections in the different conditions: Control PBS (Ctrl); Control AAV Bleomycin (Bleo); Ifi27l2a AAV PBS (Ifi27l2a PBS); Ifi27l2a AAV Bleomycin (Ifi27l2a Bleo); Dcn AAV PBS (Dcn PBS) and Mgp AAV PBS (Mgp PBS). N = 6 biological replicates (C57BL/6J WT mice) and three independent experiments. A two-sided independent T-test was used for the comparison of two groups. Data are presented as mean values ± SEM. Source data are provided as a Source Data file. c Daily body weight lost in the different groups. Data are presented as mean values ± SEM. Source data are provided as a Source Data file. d Experimental group survival rates. Source data are provided as a Source Data file. e Lung function impairment in the different conditions: Trichrome staining images of the control PBS, control bleomycin, Ifi27l2a PBS, Ifi27l2a bleomycin (from up to bottom) with arrows highlighting fibrotic clots (Ctrl and Bleo). On the right: confocal images of the lung stained with different staining: α-sma, Ki67 (both yellow) and mesothelial transfected cells (magenta). On the right-hand side, the quantification of the different immunostaining. N = 6 biological replicates (C57BL/6J WT mice) and three independent experiments. A two-sided independent T-test was used for the comparison of two groups. Data are presented as mean values ± SEM. Scale bar is 20 µm. Source data are provided as a Source Data file. f Lung function impairment in the different conditions: Trichrome staining images of the control PBS, Dcn PBS, control PBS, Mgp PBS (from up to bottom) with arrows highlighting fibrotic clots (Ctrl and Bleo). On the right: confocal images of the lung stained with different staining: extracellular matrix (NHS-FITC), Ctsb, α-sma (both yellow) and mesothelial transfected cells (magenta). On the right-hand side, the quantification of the different immunostaining. N = 6 biological replicates (C57BL/6J WT mice) and three independent experiments. A two-sided independent T-test was used for the comparison of two groups. Data are presented as mean values ± SEM. Scale bar is 20 µm. g Hydroxyproline measurements were performed for each group using the Enzymatic Hydroxyproline Assay. N = 6 biological replicates (C57BL/6J WT mice) and three independent experiments. A two-sided independent T-test was used for the comparison of two groups. Created in BioRender. Kadri, S. (2025) https://BioRender.com/s4fbbop.
Fig. 5
Fig. 5. Immunostaining of the different markers identified in the high resolution lung fibrosis mesothelial cell dataset.
a Immunostaining showing the AAV control specificity to the mesothelial cells. N = 6 biological replicates (C57BL/6J WT mice) and three independent experiments. Scale bar is 0.5 mm. b Immunostaining of α-sma of Bleomycin ctrl AAV group. Tile imaging was used to capture the lungs and performed measurements on fibrotic foci across at least 12 different regions of the affected lungs. N = 12 biological replicates (C57BL/6J WT mice) and three independent experiments. Data are presented as mean values ± SEM. Scale bar is 20 µm. Source data are provided as a Source Data file. c Immunostaining of α-sma in Ifi27l2a bleo day 14 group. N = 6 biological replicates (C57BL/6J WT mice) and three independent experiments. A two-sided independent T-test was used for the comparison of two groups. Data are presented as mean values ± SEM. Scale bar is 20 µm. Source data are provided as a Source Data file. d Immunostaining of Mmp8 in Dcn PBS day 14 group. N = 6 biological replicates (C57BL/6J WT mice) and three independent experiments. A two-sided independent T-test was used for the comparison of two groups. Data are presented as mean values ± SEM. Scale bar is 10 µm. Source data are provided as a Source Data file. e Experimental design of the collagen reporter AAV approach: AAV with col1 reporter was injected intrapleurally 4 day before the bleomycin instillation. At day 0 the bleomycin was administrated intratracheal and lungs were harvested 14 day after that. f Weight loss, survival curve and lung function of the different groups in the Col1 reporter experiment (from right to left). N = 6 biological replicates (C57BL/6J WT mice) and three independent experiments. A two-sided independent T-test was used for the comparison of two groups. Data are presented as mean values ± SEM. Source data are provided as a Source Data file. g Panel of trichrome staining and immunostaining of the Col1 reporter and the mesothelial cells. N = 6 biological replicates (C57BL/6J WT mice) and three independent experiments. Scale bar is 20 µm.Created in BioRender. Kadri, S. (2025) https://BioRender.com/p5gpax6.
Fig. 6
Fig. 6. Steady and disease-state human mesothelial cell atlases.
a UMAP embedding of human mesothelial single cells in the steady-state atlas. Nine clusters identified through graph-based clustering are indicated by color. b UMAP highlighting the expression levels of the different identified markers for each cluster. c Hierarchical clustering of the different mesothelial cells, depending on the tissue of origin, showing the cellular progenitors of the mesothelial cells in different tissues. d Cross-species analysis of the corresponding identified human and mouse mesothelial cell clusters in health. e UMAP of the identified human lung mesothelial cells in health and disease, color coded for the annotation of the healthy state (COX1+ and PTMA+) and disease (IPF, ILD-Covid and Smoker-Adenocarcinoma). f Heat maps of the relative average expression of the most highly enriched genes for each cluster in disease-state human lung mesothelial atlas (log(fold change) of one cluster versus all others. g Riverplot comparing the identified human lung clusters to the mouse newly identified clusters using scArches. h UMAPs and immunostainings of the different human mesothelial healthy and disease markers co-labeled with the mesothelial marker Gpm6a as indicated. On the right-hand side, the quantification of the different immunostaining. N = 6 biological replicates and three independent experiments. Data are presented as mean values ± SEM. Scale bar is 200 µm. Source data are provided as a Source Data file.
Fig. 7
Fig. 7. Upon lung injury mesothelial cells are activated into metabolically active mesothelial cells.
Upon injury, healthy mesothelial cells are activated with various upregulated metabolic processes and more active cell division. This population named “metabolically active” is characterized by the overexpression of Ifi27l2a, Crip1 and Scd1. The metabolically active state is the first stage of mesothelial cell differentiation upon injury that then gives rise to two other cell subtypes involved in the development of lung fibrosis. (i) First there are “proteolytic cells”, which overexpress proteases and are involved in the degradation of existing ECM. (ii) The second cell type are fibrogenic, with an active mesothelial to mesenchymal transition, de novo ECM deposition, and a tightened cell-ECM interaction, increased glycolytic cell decoration and immune cell invasion. Created in BioRender. Kadri, S. (2025) https://BioRender.com/k2y5xb4.

References

    1. Kawanishi, K. Diverse properties of the mesothelial cells in health and disease. Pleura Peritoneum1, 79–89 (2016). - PMC - PubMed
    1. Wang, N. S. The regional difference of pleural mesothelial cells in rabbits. Am. Rev. Respir. Dis.110, 623–633 (1974). - PubMed
    1. Mutsaers, S. E. & Wilkosz, S. Structure and function of mesothelial cells. Cancer Treat. Res.134, 1–19 (2007). - PubMed
    1. Rinkevich, Y. et al. Identification and prospective isolation of a mesothelial precursor lineage giving rise to smooth muscle cells and fibroblasts for mammalian internal organs, and their vasculature. Nat. Cell Biol.14, 1251–1260 (2012). - PMC - PubMed
    1. Mutsaers, S. E., Prêle, C. M.-A., Pengelly, S. & Herrick, S. E. Mesothelial cells and peritoneal homeostasis. Fertil. Steril.106, 1018–1024 (2016). - PubMed