Case Reports
. 2025 Sep 16;16(1):8292.
doi: 10.1038/s41467-025-63681-y.

SARS-CoV-2 infection dynamics in a MHCI-mismatched lung transplant recipient

Affiliations
Case Reports

SARS-CoV-2 infection dynamics in a MHCI-mismatched lung transplant recipient

Jonas Fuchs et al. Nat Commun. .

Abstract

A 48-year-old patient underwent lung transplantation because of severe COVID-19, which aggravated his underlying interstitial lung disease, despite the presence of detectable SARS-CoV-2. Subsequently, the graft is re-infected early in the post-procedural phase, leading to viral persistence for more than five months. By analyzing viral evolution and effector immune response within the transplanted organ, we observe three main findings. First, virus evolution differs in the transplanted organ compared to that in the upper respiratory tract and is affected by monoclonal SARS-CoV-2-specific antibodies and molnupiravir. Second, we show the potential clinical relevance of T cell HLA restriction that may facilitate viral clearance in the upper respiratory tract compared to the ongoing viral replication in the HLA mismatch organ. Third, close monitoring and modulation of immunosuppressive and antiviral therapy enables viral clearance in a lung transplantation setting despite incomplete SARS-CoV-2 clearance prior to transplantation.


Conflict of interest statement

Competing interests: A.L. indicates research grants from the German Research Foundation, the German Heart Foundation and the German Center for Infectious Research. A.L. indicates travel grants from Diaplan and participation in advisory boards of Bayer AG. B.C.F. indicates research support from Bristol-Myer Squibb and Relief Therapeutics unrelated to the manuscript, consulting and lecture fees from Advita Lifescience GmbH, Actelion, AstraZeneca, Boehringer Ingelheim, Novartis, Roche and Vifor, travel support from Boehringer Ingelheim. B.C.F. indicates the following intellectual property: WO2020225246A1; WO2021152119A1. DH indicates lecture fees from BioMerieux. D.St. reports financial support for lectures or participation at advisory boards from Astra-Zeneca AG, Novartis AG, GSK AG, Roche AG, Zambon, Pfizer, Schwabe Pharma AG, Vifor AG, Chiesi AG, MSD, Pfizer, Sanofi, Chemie Menarini, CSL-Behring, Boehringer Ingelheim outside the submitted work. N.K. indicates lecture fees from AstraZeneca. PA indicates personal lecture fees from Boehringer Ingelheim. SF indicates personal lecture fees from Astra Zeneca and CSL Behring outside the submitted work. All other authors declare no competing interests.

Figures

Fig. 1
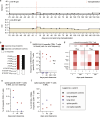
Fig. 1. Temporal overview of clinical parameters.
Day 0 indicates the time of lung transplantation. a Diagnostic SARS-CoV-2 qPCR cycle threshold (Ct) values of oropharyngeal swabs (gray) and bronchoalveolar lavage (BAL; blue). The horizontal dotted lines indicate the cut-off value (Ct ≥ 40) between positive and negative results. Treatment regimens with SARS-CoV-2-directed antivirals (200 mg once followed by 100 mg/day remdesivir or 2 × 800 mg/day molnupiravir) or single doses of SARS-CoV-2-specific antibodies (500 mg sotrovimab or 150 mg tixagevimab/cilgavimab) are indicated as highlighted regions and vertical lines, respectively. Circles indicate the sequenced patient samples. b HRCT two years and 10 days prior to lung transplantation. Arrows indicate subtle reticulations corresponding to underlying interstitial lung disease. Asterisks denote ground glass opacities and consolidations as a surrogate of acute inflammation superposed on underlying interstitial lung disease. Lung icon adapted from BioRender. Fuchs, J. (2025) https://BioRender.com/hv8kbn1. c Virus isolation positive cell culture with successful full-genome sequencing of SARS-CoV-2 after the initial passage. d Immunosuppressive regimens with prednisolone, mycophenolat mofetil, tacrolimus and everolimus and mAbs (1 g/dose rituximab, 800 mg/dose tocilizumab and 20 mg/dose basiliximab). For the tacrolimus and everolimus, the measured blood concentration (ng/L; light blue line) is shown on the right y-axis.
Fig. 2
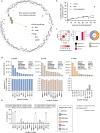
Fig. 2. Intra-host evolution of SARS-CoV-2.
a Phylogenetic analyses of the patient SARS-CoV-2 sequences in the context of Omicron BA.2 variant sequences from Freiburg, Germany (Supplementary Table 2). The maximum-likelihood phylogenetic tree was constructed with IQ-Tree (1000 bootstrap replicates, ModelFinder: GTR + F + R2) and rooted to the Wuhan-Hu-1 reference sequence (NC_045512). The tree was visualized with the R ggtree package. Bar indicates substitutions per site. b Count of viral mutations with a variant frequency > 50% compared to mutations already present at day -9 plotted against time. Linear regression was performed, excluding day 141. c Percentage of substitutions (left), substitution type (middle) and amino acid effect (right) of novel viral mutations with a variant frequency > 50% of the day 141 sequencing result compared to day -9. d, e The outbreak info R package was used to access and analyze 6.9 million SARS-CoV-2 genomes between 2021-12-01 and 2022-10-24 harboring the mutations K356T, L368I and T385I. d Specific prevalence (number of lineage sequences harboring the respective mutation/total number of analyzed sequences) of the top 10 lineages where the single mutations have been detected (upper plot) and the proportion (lower plot) of these mutations within the respective lineage. e Total sequence count of all sequences that have combinations of the indicated mutations within the dataset.
Fig. 3
Fig. 3. Sensitivity of patient isolates to SARS-CoV-2 specific monoclonal antibodies.
3D representations of (a) the Omicron BA.1 variant receptor-binding domain (RBD) in complex with the fab fragment of sotrovimab (pdb accession 7X1M:) or (b) the S RBD in complex with the fabs of cilgavimab and tixagevimab (pdb accession: 7L7E). The mutational sites at position R346, K356, L368 and T385 are highlighted in red. ce Neutralizing capacity of the therapeutic antibodies (c) sotrovimab, (d) cilgavimab and (e) tixagevimab. Serial 10-fold dilutions of the monoclonal antibodies were incubated with 100 pfu of the prototypic wildtype Omicron B.1 variant, a prototypic Omicron BA.2 variant or the two patient Omicron BA.2 isolates (d81 and d141) and analyzed by plaque assay. Neutralization titers 50 (NT50) values were calculated from individual curve fits of each serial dilution (3 biologically independent experiments). Shown are the mean and standard deviation. Statistics were performed on log-transformed values with a one-way ANOVA (Tukey’s multiple comparison test, **p ≤ 0.01, ***p ≤ 0.001).
Fig. 4
Fig. 4. SARS-CoV-2 directed adaptive immune response.
a Serological analysis of SARS-CoV-2 N-specific IgG (upper) and SARS-CoV-2 S- and N-specific IgM (lower) by ELISA. Horizontal dotted lines mark the detection limits. b Circulating CD8+ T cell responses against epitopes described to be restricted by the HLA-A/B types of the lung transplant recipient and healthy SARS-CoV-2 convalescent control. c SARS-CoV-2-specific CD8+ T cells detected in blood samples after pMHCI tetramer-based enrichment. CD8+ T cells targeting 2 to 5 distinct SARS-CoV-2 epitopes were analyzed in blood samples from the lung transplant recipient at three time points. Calculated ex vivo frequencies of A*03/S378- (red), A*03/N361- (red), A*01/S865- (blue), A*01/ORF3a207- (blue) and A*01/ ORF1ab4163- (blue) specific CD8+ T cells are depicted from samples of lung transplant recipient 1 day before and 49 and 238 days after complete SARS-CoV-2 clearance. For comparison, calculated ex vivo frequencies of A*03/S378- (black) specific CD8+ T cells are shown from healthy SARS-CoV-2 convalescent controls (n = 3) at > 180 days post-infection. Horizontal line marks the detection limit. d Production of IFN-γ, TNF and CD107a per SARS-CoV-2-specific CD8+ T cell after 14 days of in vitro expansion and peptide stimulation. IFN-γ, TNF and CD107a production is depicted for unstimulated (-) and peptide-stimulated (+) samples of lung transplant recipients. Samples were collected 1 day before and 238 days after complete viral clearance. e Recipient (A*03/S378 (red))- and donor (A*01/S865 (blue))-derived, spike-specific CD8+ T cells detected in BAL samples of the lung transplant recipient (n = 1) 1 day before and 49 and 238 days after complete SARS-CoV-2 clearance using ex vivo pMHCI tetramer staining. f CD103 and CD69 expression on recipient (A*03/S378 (red)) - and donor (A*01/S865 (blue))-derived, spike-specific CD8+ T cells detected in BAL samples of the lung transplant recipient (n = 1) at the indicated time points after complete SARS-CoV-2 clearance.

References

    1. Matthay, M. A. et al. A new global definition of acute respiratory distress syndrome. Am. J. Respir. Crit. Care Med.209, 37–47 (2024). - PMC - PubMed
    1. Lorusso, R. et al. In-hospital and 6-month outcomes in patients with COVID-19 supported with extracorporeal membrane oxygenation (EuroECMO-COVID): a multicentre, prospective observational study. Lancet Respir. Med.11, 151–162 (2023). - PMC - PubMed
    1. Aoyama, H. et al. Assessment of therapeutic interventions and lung protective ventilation in patients with moderate to severe acute respiratory distress syndrome: A systematic review and network meta-analysis. JAMA Netw. Open2, e198116 (2019). - PMC - PubMed
    1. Supady, A. et al. Respiratory indications for ECMO: focus on COVID-19. Intensive Care Med.48, 1326–1337 (2022). - PMC - PubMed
    1. Bellani, G. et al. Epidemiology, patterns of care, and mortality for patients with acute respiratory distress syndrome in intensive care units in 50 countries. Jama315, 788–800 (2016). - PubMed

Publication types