. 2025 Oct;4(10):1241-1257.
doi: 10.1038/s44161-025-00710-5. Epub 2025 Sep 16.

Smooth muscle expression of RNA editing enzyme ADAR1 controls activation of the RNA sensor MDA5 in atherosclerosis

Affiliations

Smooth muscle expression of RNA editing enzyme ADAR1 controls activation of the RNA sensor MDA5 in atherosclerosis

Chad S Weldy et al. Nat Cardiovasc Res. 2025 Oct.

Abstract

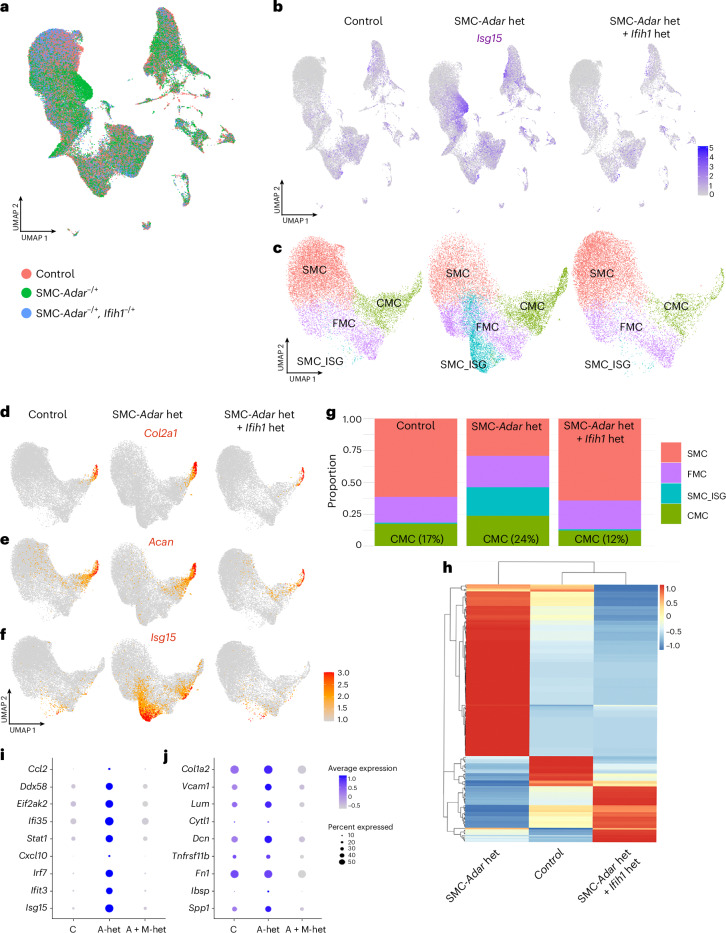
Although genetic risk in coronary artery disease (CAD) is linked to changes in gene expression, recent discoveries have revealed a major role for A-to-I RNA editing in CAD. ADAR1 edits immunogenic double-stranded RNA (dsRNA), preventing activation of the dsRNA sensor MDA5 (IFIH1) and downstream interferon-stimulated gene signaling. Using human plaque analysis and human coronary artery smooth muscle cells (SMCs), here, we show that SMCs uniquely require RNA editing and that MDA5 activation regulates SMC phenotype. In a conditional SMC-specific Adar deletion mouse model on an atherosclerosis-prone background, combined with Ifih1 deletion and single-cell RNA sequencing, we demonstrate that ADAR1 preserves vascular integrity and limits atherosclerosis and calcification by suppressing MDA5 activation. Analysis of the Athero-Express carotid endarterectomy cohort further shows that interferon-stimulated gene expression correlates with SMC modulation, plaque instability and calcification. These findings reveal a fundamental mechanism of CAD, where cell type and context-specific RNA editing modulates genetic risk and vascular disease progression.


Conflict of interest statement

Competing interests: C.S.W. is a consultant for AiRNA Bio and Avidity Biosciences. T.Q. serves on the scientific advisory board for Amgen. J.B.L. is a cofounder of AIRNA Bio and a consultant for Risen Pharma. J.B.L. and Q.L. are named inventors of a patent filed by Stanford University (WO/2023/239781), describing a method related to genetic prediction of RNA editing that relates to human prediction of dsRNA burden. S.W.v.d.L. has received Roche funding for unrelated work. The other authors declare no competing interests.

Figures

Fig. 1
Fig. 1. SMCs in atherosclerosis express immunogenic RNA and show evidence of ISG induction in phenotypic modulation.
a, Schematic of ADAR1 RNA editing of dsRNA. b, UMAP of scRNA-seq data from human carotid atherosclerotic plaques (Alsaigh et al.); Endo, endothelial cells; Fibro, fibroblasts; NKT, natural killer T cells; CTL, cytotoxic T lymphocytes; DC, dendritic cells; Mac, macrophages. c, Module score of immunogenic RNA expression. df, Clustering of SMC subset (d) with a violin plot showing the SMC marker MYH11 (e) and FMC/CMC marker TNFRSF11B (f). gi, Violin plots of the expression of ISGs ISG15 (g), IF135 (h) and IFI16 (i). j, Dot plot of the top ISGs within SMC clusters. kn, Using a mouse comprehensive integrated dataset of lineage-traced SMCs (from Sharma et al.), feature plots were generated of Myh11 (k) and Col2a1 (l) at 0 and 16 weeks of a high-fat diet and of Isg15 (l) and Ifit3 (m) in SMC phenotypic modulation. Source data
Fig. 2
Fig. 2. SMC-specific ADAR1 is required to maintain vascular integrity and survival.
a, Schematic of the SMC-Adar−/− model and accumulation of dsRNA and MDA5 activation. b, Survival curves for 56 mice treated with tamoxifen at 8 weeks of age (n = 15 control, n = 21 SMC-Adar−/+, n = 20 SMC-Adar−/−), comparing SMC-Adar−/−, SMC-Adar−/+ (Adarfl/WT; Myh11CreERT2; RosatdTomato; Apoe−/−) and control (AdarWT/WT; Myh11CreERT2; RosatdTomato; Apoe−/−) genotypes. c, Gross image of the aortic root and ascending aorta of an SMC-Adar−/− mouse at 2 weeks following tamoxifen treatment. d,e, Representative images of hematoxylin and eosin (H&E) staining from SMC-Adar−/− (d) and control genotype mice (e). f,g, Fluorescence imaging with autofluorescence (Auto) indicating elastin (green) and MYH11-derived cells labeled with tdTomato (red) in two SMC-Adar−/− mice with adventitial ballooning. h, Brightfield imaging of an aorta cross-section from an SMC-Adar−/− mouse corresponding to fluorescence imaging in g. i, CD68 immunostaining of an aorta cross-section from an SMC-Adar−/− mouse showing macrophage infiltration. j, Masson trichrome stain of an aorta cross-section from an SMC-Adar−/− mouse showing intramedial collagen deposition. The P value represents comparison of survival curves by log-rank (Mantel–Cox) test (b). Source data
Fig. 3
Fig. 3. Haploinsufficiency in MDA5 is adequate to prevent mortality in SMC-Adar−/− mice.
a, Survival curves for SMC-Adar−/− (Adar1fl/fl; Myh11CreERT2; RosatdTomato; Apoe−/−), SMC-Adar−/− + Ifih1−/+ (Adar1fl/fl; Ifih1−/+; Myh11CreERT2; RosatdTomato; Apoe−/−) and SMC-Adar−/− + Ifih1−/− (Adarfl/fl; Ifih1−/−; Myh11CreERT2; RosatdTomato; Apoe−/−) genotypes following tamoxifen treatment at 8 weeks of age (N = 32 mice total, n = 12 SMC-Adar−/−, n = 8 SMC-Adar−/− + Ifih1−/+ and n = 12 SMC-Adar−/− + Ifih1−/−). b, Weight curve at 0, 7 and 14 days following tamoxifen treatment between genotypes of surviving mice. c, Individual weight measures at 0, 7 and 14 days following tamoxifen treatment between genotypes of surviving mice. d, Schematic diagram of SMC-Adar−/− and Ifih1 haploinsufficiency or global KO protecting against mortality. P values represent comparison of survival curves by log-rank (Mantel–Cox) test (a and b). The data points in b are shown as mean ± s.e.m. Source data
Fig. 4
Fig. 4. SMC Adar controls ISG activation, phenotypic response and macrophage infiltration.
a, scRNA-seq UMAP from the aortic root and ascending aorta grouped by genotype of SMC-Adar−/− (Adarfl/fl; Myh11CreERT2; RosatdTomato; Apoe−/−) and control (AdarWT/WT; Myh11CreERT2; RosatdTomato; Apoe−/−) genotypes at 2 weeks following tamoxifen treatment (n = 7 control and n = 9 SMC-Adar−/− mice, 10 total libraries). b, UMAP with clustering and cell-type identification of combined SMC-Adar−/− and control genotype data. c, Feature plot of tdTomato expression showing SMC lineage tracing. d, Feature plot of Isg15 expression. e, RNAscope analysis of Isg15 expression in aortic tissue of SMC-Adar−/− mice showing highest Isg15 expression at the lumen aspect of the media, with additional adventitial expression. f, Feature plot of Ifnb1 expression. g, Heat map of network centrality scores for the CCL signaling network across cell clusters. h, Contributions of each receptor–ligand pair for CCL signaling. i, Chord diagram of receptor–ligand interactions between clusters for CCL5–CCR5. j,k, Feature plots of Ccl5 (j) and Ccr5 (k) expression. Source data
Fig. 5
Fig. 5. SMC-specific Adar haploinsufficiency activates the ISG response in atherosclerosis, increasing vascular chondromyoctye formation.
a, Schematic diagram of the 16-week, high-fat-diet atherosclerosis study. b, UMAP of scRNA-seq data from the atherosclerotic aortic root and ascending aorta at 16 weeks on a high-fat diet split by control (AdarWT/WT; Myh11CreERT2; RosatdTomato; Apoe−/−) and SMC-Adar−/+ (Adarfl/WT; Myh11CreERT2; RosatdTomato; Apoe−/−) genotypes (12 captures, 9 mice per group). c, Feature plot of Isg15 split by genotype. d, UMAP of SMC subset analysis grouped by genotype. e, UMAP of SMC subset cluster analysis split by genotype showing SMC, SMC_ISG, FMC and CMC cell clusters. f, Stacked bar chart showing cell populations of SMC subsets for SMC, SMC_ISG, FMC and CMC clusters. g, Feature plot of Isg15 in SMC subsets split by genotype. h, Lineage trajectory analysis using Slingshot within SMC subsets showing two distinct lineages (SMC_ISG dependent and independent) from SMC to CMC. i,j, RNAscope for Isg15 in aortic root sections in control (i) and SMC-Adar−/+ (j) mice. Source data
Fig. 6
Fig. 6. SMC-specific haploinsufficiency in Adar increases plaque size and calcification in atherosclerosis.
ah, Representative fluorescent images of aortic root plaque histology in control (a) and SMC-Adar−/+ (b) genotypes, with quantification of plaque area (c), plaque area normalized to IEL area (d) and media area (e), media area normalized to EEL area (f) and plaque area normalized to media area (g) and EEL area (h). il, Representative images of Ferangi Blue calcification staining in control (i) and SMC-Adar−/+ genotypes (j), quantification of Ferangi Blue area (k) and Ferangi Blue area normalized to plaque area (l). m, Schematic diagram showing the mechanism of dsRNA formation, MDA5 activation and impaired RNA editing by ADAR1 to accelerate SMC phenotypic modulation, calcification and atherosclerosis. Data are shown as mean ± s.e.m.; n = 13 per group. P values were calculated by unpaired two-tailed t-test.
Fig. 7
Fig. 7. Haploinsufficiency of Ifih1 prevents ISG activation and CMC formation in atherosclerosis in SMC-Adar−/+ mice.
a, UMAP of the integrated scRNA-seq data set between control (AdarWT/WT; Myh11CreERT2; RosatdTomato; Apoe−/−), SMC-Adar het (Adarfl/WT; Myh11CreERT2; RosatdTomato; Apoe−/−) and SMC-Adar het +Ifih1 het (Adarfl/WT; Ifih1−/+; Myh11CreERT2; RosatdTomato; Apoe−/−) genotypes following 16 weeks on a high-fat diet (18 captures, 9 mice per group). b, Feature plot of Isg15 split by genotype. c, UMAP of the tdTomato+ subset analysis with SMC, SMC_ISG, FMC and CMC clusters split by genotype. df, Feature plots split by genotype for Col2a1 (d), Acan (e) and Isg15 (f). g, Stacked bar charts showing the proportion of cells within ‘SMC’, ‘SMC_ISG’, ‘FMC’ and ‘CMC’ clusters split by genotype. h, Heat map visualization for normalized expression of marker genes for control, SMC-Adar het and SMC-Adar het +Ifih1 het genotypes in the tdTomato+ subset analysis. i,j, Dot plot gene expression split by genotype in SMC subsets for ISG genes (i) and FMC/CMC marker genes (j).
Fig. 8
Fig. 8. ISG expression in a human atherosclerotic plaque dataset (Athero-Express) correlates with markers of SMC modulation, plaque vulnerability, plaque calcification and decreasing SMC investment into plaques.
a, Schematic diagram of the Athero-Express cohort and data evaluation. b,c, Linear relationship analysis between CMC markers LUM (b) and HAPLN (c) and ISG15 in 1,093 human samples. d,e, Dot plots displaying linear regression analyses between ISGs and LUM (d) and HAPLN (e) showing –log10 (P value) on the y axis and gene on the x axis with β coefficient scaled by color. fh, Dot plots displaying linear regression analyses between ISGs and plaque phenotype corrected for covariates for plaque vulnerability (f), calcification (g) and SMC area within plaques (h).
Extended Data Fig. 1
Extended Data Fig. 1. ADAR1 regulates RNA editing in human coronary SMCs and RNA editing requirement is dependent on cell context.
(a) Schematic of SMC phenotypic modulation in vitro assay. (b) Linear regression analysis of ADAR1 expression and global RNA editing frequency in primary human coronary artery SMCs (HCASMCs) following siRNA KD of ADAR. (c) Grouped bar chart of RNA editing frequency with cellular treatment of scramble, ADAR, and ADAR + IFIH1 (MDA5) siRNA. (d) Volcano plot of bulk RNAseq DE gene analysis comparing scramble vs ADAR siRNA in serum starved conditions, (e) volcano plot comparing scramble vs ADAR + IFIH1 siRNA in serum starved conditions, (f) volcano plot comparing scramble vs ADAR siRNA in serum fed conditions, and (g) volcano plot comparing scramble vs ADAR + IFIH1 siRNA in serum fed conditions. (h) Principal component analysis (PCA) of bulk RNAseq data of principal components 1 and 2 for each HCASMC treatment. Grouped bar chart of normalized RNAseq reads across HCASMC treatments for (i) ACTA2, (j) CNN1, (k) ISG15, (l) KLF4, (m) EGR1, and (n) ATF3. P-values represent simple linear regression (c) or (c, i-n) two-way ANOVA with multiple comparisons post hoc analysis. N = 3 RNA seq libraries per condition. Source data
Extended Data Fig. 2
Extended Data Fig. 2. Global RNA editing is decreased in HCASMC following phenotypic modulation in vitro.
In HCASMC, editing site specific comparison of RNA editing frequency for siRNA control in serum starved (X axis) vs serum stimulated (Y axis)(a). Editing site specific comparison of RNA editing frequency for siRNA control versus siRNA ADAR + IFIH1 (MDA5) in serum starved (b) and serum stimulated (c) conditions. Venn diagram of ADAR-dependent differentially edited sites (DES) (d) and DES-containing genes (e). Table of distinct ADAR-dependent DES-containing genes for serum stimulated and serum starved conditions (f). Volcano plot of DE gene analysis for immunogenic RNA between scramble siRNA treated cells under serum starved and serum stimulated conditions (g). Grouped bar charts of normalized RNAseq reads for (h) all immunogenic RNA, (i) SWAP70, and (j) TCTA. (h-j) P-values represent two-way ANOVA with multiple comparisons post hox analysis. N = 3 RNA seq libraries per condition. Source data
Extended Data Fig. 3
Extended Data Fig. 3. Loss of ADAR1 regulates transcriptomic and inflammatory response to calcification in vitro.
Images of hTert immortalized human coronary artery SMCs following treatment with scramble, ADAR, ADAR + IFIH1, and IFIH1 siRNA and 7 days of culture in control medium (a) and calcification medium (b). (c) Volcano plot of DE gene analysis between scramble siRNA treated cells under control and calcification medium. (d-g) Grouped bar charts of normalized RNAseq reads for (d) FBLN5, (e) FMOD, (f) RANBP3L, (g) ISG15. (h) Principal component analysis (PCA) for PC1 and PC2 of bulk RNAseq data from each cell treatment. Grouped bar charts of normalized RNAseq reads for (i) NFKB1, (j) JUND, (k) MMP1, (l) MMP10. P-values represent two-way ANOVA with multiple comparisons post hoc analysis. N = 3 RNA seq libraries per condition. Source data
Extended Data Fig. 4
Extended Data Fig. 4. Loss of SMC Adar1 coordinates distinct response throughout vessel wall.
(a) Violin plot of Isg15, Ccl5, and Cxcl10 within SMC, SMC_cAdar1_KD_1, and SMC_cAdar1_KD_2 clusters of scRNAseq data clusters at 2 weeks following tamoxifen treatment for SMC-Adar1−/− (Adar1fl/fl, Myh11CreERT2, ROSAtdTomato, ApoE−/−) and control (Adar1WT/WT, Myh11CreERT2, ROSAtdTomato, ApoE−/−) genotypes. (b) Featureplot of Il6. (c) Violin plots of Cnn1 and Myh11 in SMC, SMC_cAdar1_KD_1, and SMC_cAdar1_KD_2 clusters. Featureplots of (d) Ly6a (Sca1), (e) Cd68, and (f) Gzma. (g) Chord diagram of receptor-ligand interaction between clusters for CCL2:CCR2. (h) Featureplot of Ccl2 and (i) Ccr2. (j) Chord diagram of receptor-ligand interaction between clusters for CCL4:CCR5. (k) Featureplot of Ccl4 and (l) Ccl7. P-value represents Wilcoxon Rank Sum test between groups (a, c). Source data
Extended Data Fig. 5
Extended Data Fig. 5. Homozygous deletion of MDA5 (Ifih1) prevents transcriptomic effect of SMC-Adar1−/−.
(a) UMAP of integrated scRNAseq data set between control (Adar1WT/WT, Myh11CreERT2, ROSAtdTomato, ApoE−/−), SMC-Adar1−/− (Adar1fl/fl, Myh11CreERT2, ROSAtdTomato, ApoE−/−), and SMC-Adar1−/−, Mda5−/− (Adar1fl/fl, Ifih1−/−, Myh11CreERT2, ROSAtdTomato, ApoE−/−) genotypes (total N=7 control, 9 SMC-Adar1−/−, and 9 SMC-Adar1−/−, Mda5−/− mice for 16 total libraries). Featureplot of (b) Isg15 and (c) Ccl5 split by genotype. Violin plot of tdTomato+ subset analysis split by genotype for (d) Isg15, (e) Ccl5, (f) Myh11, (g) Cnn1. (h) Heatmap visualization for normalized expression of marker genes for control, SMC-Adar1 KO, and SMC-Adar1 KO + Mda5 KO genotypes in tdTomato+ subset analysis. P-value represents Wilcoxon Rank Sum test between groups (d - g). Source data
Extended Data Fig. 6
Extended Data Fig. 6. ISG dependent trajectory analysis from SMC to CMC implicates distinct gene ontologies.
(a) Top genes for each ISG dependent trajectory cluster in DotPlot. (b) Top gene ontology pathways for marker genes of distinct clusters from ISG dependent trajectory. Source data
Extended Data Fig. 7
Extended Data Fig. 7. Isg15 RNAscope reveals increased Isg15 signal in plaque of SMC Adar1−/+ mice.
(a) Quantification of Isg15 + area within the vessel wall between control and SMC Adar1−/+ mice following 16 week of high fat diet (N = 6 per group). (b-c) Representative images of Isg15 (b) and Col2a1 (c) RNAscope. P-values represent t-test for comparison. Source data
Extended Data Fig. 8
Extended Data Fig. 8. SMC specific haploinsufficiency in Adar1 increased SMC lineage traced cell content in plaque without change in acellular area.
Representative images of tdTomato (SMC derived) and overlay images with FITC and brightfield images in control (Adar1WT/WT, Myh11CreERT2, ROSAtdTomato, ApoE−/−) (a) and SMC Adar1 het (Adar1fl/WT, Myh11CreERT2, ROSAtdTomato, ApoE−/−)(b) genotypes. Quantification of the percentage of tdTomato positive area in the plaque (c) and in the top 30 μm segment of the plaque representing the cap (d). Masson’s Trichrome staining with threshold analysis and acellular area quantification in control (e) and SMC-Adar1−/+ mice (f) with quantification (g). N = 13 per group. P-values represent t-test for comparison.
Extended Data Fig. 9
Extended Data Fig. 9. SMC specific haploinsufficiency of Adar1 has minimal effect on macrophage infiltration in atherosclerosis.
(a) UMAP of scRNAseq data of non-tdTomato lineage traced cells from atherosclerotic aortic root and ascending aorta at 16 weeks high fat diet split by control and SMC-Adar1−/+ genotypes. (b) Stacked bar chart comparing proportion of macrophage cell population between control and SMC-Adar1−/+ genotypes in the non-tdT+ cells. (c) Heatmap of network centrality scores for CCL signaling network across cell clusters. (d) Dot plot of outgoing and incoming interaction strength across cell clusters for all signaling networks (left) and CCL signaling network (right). (e-f) Cd68 immunohistochemical staining within the aortic root following in control (e) and SMC- SMC-Adar1−/+ (f) mice (N = 13 per group). (g) Total area of Cd68 positive stain showing a significant increase in Cd68 in SMC-Adar1−/+ compared to control, however this effect is not significant when normalizing to (h) plaque area, or (i) vessel area at the internal elastic lamina (IEL). P-values represent chi-squared test (b) and unpaired two-tailed T-test (g-i).
Extended Data Fig. 10
Extended Data Fig. 10. Variability of ISG expression between patient carotid endarterectomy samples with no difference between sexes in Athero-Express cohort.
Histogram plot of patient distribution for (a) normalized IFIH1 and (b) ISG15 expression split by sex (male – blue, female – red) in 1093 patient samples. Histogram plot of patient density by sex for (c) normalized IFIH1 and (d) ISG15 expression. Heatmap plot of correlation beta value for ISGs (e). (f) Dot plot displaying linear regression analysis between ISGs and macrophage area within plaque corrected for co-variates with -log10 P value as Y axis.

Update of

References

    1. GBD 2019 Diseases and Injuries Collaborators. Global burden of 369 diseases and injuries in 204 countries and territories, 1990–2019: a systematic analysis for the Global Burden of Disease Study 2019. Lancet396, 1204–1222 (2020). - PMC - PubMed
    1. Nikpay, M. et al. A comprehensive 1,000 genomes-based genome-wide association meta-analysis of coronary artery disease. Nat. Genet.47, 1121–1130 (2015). - PMC - PubMed
    1. Schunkert, H. et al. Large-scale association analysis identifies 13 new susceptibility loci for coronary artery disease. Nat. Genet.43, 333–338 (2011). - PMC - PubMed
    1. van der Harst, P. & Verweij, N. Identification of 64 novel genetic loci provides an expanded view on the genetic architecture of coronary artery disease. Circ. Res.122, 433–443 (2018). - PMC - PubMed
    1. Tcheandjieu, C. et al. Large-scale genome-wide association study of coronary artery disease in genetically diverse populations. Nat. Med.28, 1679–1692 (2022). - PMC - PubMed

MeSH terms

Grants and funding