. 2025 Oct;16(5):e70052.
doi: 10.1002/jcsm.70052.

Mechanical Stimulation Induces Yap Mediated OCTN2 Transcription to Enhance Carnitine Metabolism in Sarcopenia

Affiliations

Mechanical Stimulation Induces Yap Mediated OCTN2 Transcription to Enhance Carnitine Metabolism in Sarcopenia

Yahong Lu et al. J Cachexia Sarcopenia Muscle. 2025 Oct.

Abstract

Background: Sarcopenia is a systemic skeletal muscle disease that seriously affects the health of the aged population. Exercise prevents sarcopenia, but the underlying mechanobiological and metabolic mechanisms need to be further investigated.

Methods: Carnitine and organic cation transporter 2 (OCTN2) levels were assessed in humans and animals with sarcopenia. Skeletal muscle function and histomorphology were assessed in an animal model. Mitochondrial structure and function were assessed via MitoSox and JC-1 staining, seahorse assays and electron microscopy. Molecular mechanisms were assessed by Western blot analysis, qPCR, a luciferase reporter gene assay, chromatin immunoprecipitation and immunofluorescence in C2C12 myotubular cells.

Results: A total of 66 patients were included in the study (Healthy group, % females: 44.74%, mean age: 67.40 ± 8.2, mean BMI: 24.7 ± 3.80 kg/m2; Sarcopenia group, % females: 39.29%, mean age: 71 ± 8.42, mean BMI: 23.1 ± 2.98 kg/m2). Serum carnitine levels decreased in sarcopenia patients (10 868 ± 3466 ng/mL vs. 8469 ± 2360 ng/mL, p < 0.01). Carnitine is an independent protective factor for sarcopenia (OR, 0.757; 95% CI 0.599-0.923, p = 0.0107). Carnitine and OCTN2 levels also decreased in the muscles of mice with dexamethasone-induced muscle atrophy (carnitine: -16.5%, p < 0.05) and aged mice (carnitine: -32.03%, p < 0.01). Suppressed expression of OCTN2 led to a decrease in muscle carnitine (2983 ± 466.3 ng/mL vs. 2517 ± 355.3 ng/mL, p < 0.05), as well as muscle atrophy in mice. Swimming exercise enhanced mice carnitine-dependent fatty acid oxidation and increased OCTN2 expression (OCTN2: +8.4%, p < 0.05). Knockdown of OCTN2 partially reduced this effect during swimming. Cellular experiments revealed that mechanical stimulation upregulated OCTN2 expression. OCTN2 knockdown impaired myotube formation and led to the disruption of the cellular mitochondrial structure. Further mechanistic studies showed that mechanical forces enhanced OCTN2 transcription and regulated carnitine metabolic homeostasis through the Yap/Tead4 pathway. Yap agonist XMU alleviated dexamethasone-induced muscle atrophy (grip: +13%, p < 0.05; cross-sectional area of the gastrocnemius muscle: +8%, p < 0.05). In a high-fat diet mouse model and in cellular experiments, carnitine supplement improved mitochondrial structure and alleviated mitochondrial dysfunction by reducing excessive lipid accumulation and thus altered myocyte fate.

Conclusion: Swimming and carnitine supplementation alleviated sarcopenia. The mechanism was closely related to the enhancement of OCTN2 expression after Yap activation and the enhancement of carnitine-mediated lipid metabolism. These findings reveal exercise regulates skeletal muscle by coupling mechanics and metabolism synergetically. We provide a new therapeutic strategy for sarcopenia.

Keywords: OCTN2; Yap/Tead4; carnitine; fatty acids; lipid deposition; mechanical force; mitochondrial dysfunction; muscular atrophy.


Conflict of interest statement

The authors declare no conflicts of interest.

Figures
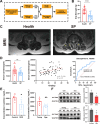
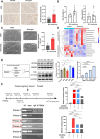
FIGURE 1
FIGURE 1
Dysregulation of OCTN2 and carnitine levels in patients and mice with sarcopenia. (A) Schematic of the retrospective analysis of the serum carnitine concentration in patients with sarcopenia. (B) Grip strength levels of sarcopenia patients and control patients. (C) Typical MR images of the psoas major muscle in non‐sarcopenia patients and sarcopenia patients. (D) Serum carnitine content in sarcopenia patients and control patients (left); Pearson correlation analysis between canitine level and grip (mid); ROC curves of carnitine distinguishing between SP patients and relatively healthy patients (right). (E) Carnitine levels in the muscles of mice with DEX‐induced sarcopenia and control mice as well as in the muscles of senescent mice and young mice. (F) OCTN2 protein levels were analysed by Western blot in the muscles of mice with DEX‐induced sarcopenia and control mice as well as in the muscles of senescent mice and young mice. The intensity of the OCTN band relative to that of the GAPDH band was quantified via ImageJ software (n = 3). *p < 0.05, **p < 0.01, ***p < 0.001, ****p < 0.0001, means ± SDs.
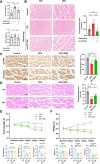
FIGURE 2
FIGURE 2
OCTN2 deficiency decreases the carnitine content, contributing to sarcopenia progression. (A) Cellular immunofluorescence was performed to assess OCTN2 expression in myotubes on day 0 versus day 6 of differentiation and quantitative fluorescence intensity analysis was performed; scale bar = 250 μm. (B) Representative images of MYH immunofluorescence in C2C12 myotubes transfected with shOCTN2 or shNC. Quantification of the MHC‐positive area/total area via ImageJ software. (C) Mitochondrial morphological changes in C2C12 myotubes transfected with shOCTN2 or shNC were observed via transmission electron microscopy. Quantitative statistics of the proportion of mitochondria with an intact crista structure to total mitochondria in each cell. (D) Experimental design model (left); Grip strength and body weight were measured for mice treated with adenoviral sh‐OCTN2 for 3 weeks (right). (E) H&E staining of mouse gastrocnemius muscle and statistics of the cross‐sectional area of sections. (F) Carnitine levels in the muscles of shOCTN2‐treated mice and shNC‐treated mice. *p < 0.05, **p < 0.01, ***p < 0.001, ****p < 0.0001, means ± SDs.
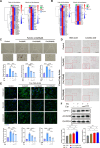
FIGURE 3
FIGURE 3
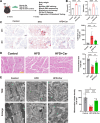
OCTN2 expression occurs in response to mechanical force through the Hippo/YAP/TEAD4 signalling pathway. (A) Immunohistochemical analysis of OCTN2 immunoreactivity in swimming mice (n = 7) versus WT mice born in the same litter (n = 6); scale bar = 50 μm. (B) The body weights and grip strengths of the mice were recorded and measured after 2 months of swimming. (C) Mouse muscle fibres were observed via transmission electron microscopy and muscle fibre diameters were measured. (D) Metabolomics of muscle tissues from swimming mice and control mice. (E) C2C12 myotubes were treated with Rhosin HCL, MSAB, XMU‐MP‐1 or Dooku1 alone for 24 h. OCTN2 protein expression was assessed via Western blot. C2C12 myotubes were treated with different concentrations of XMU‐MP‐1 for 24 h. OCTN2 protein expression was assessed via Western blot. The mRNA expression of OCTN2 was assessed via RT–qPCR. (F) ChIP analysis of Tead4 aggregates on the OCTN2 promoter region (left). Relative luciferase activity was measured in cell lysates to quantify the gene expression of OCTN2 in C2C12 cells (right). *p < 0.05, **p < 0.01, ***p < 0.001, ****p < 0.0001, means ± SDs.
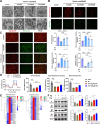
FIGURE 4
FIGURE 4
OCTN2 deficiency attenuates the response to mechanical forces and enhancing YAP with XMU improves muscle atrophy. (A) Grip strength and body weight of the mice. (B) H&E staining of the mouse gastrocnemius muscle and measurement of the cross‐sectional area. (C) Immunohistochemical analysis of mouse OCTN2 immunoreactivity. (D) Representative H&E staining of cross‐sections of the mouse gastrocnemius muscle and the corresponding cross‐sectional area. (E) Grip strength of the mice. (F) Body weights of the mice. *p < 0.05, **p < 0.01, ***p < 0.001, ****p < 0.0001, means ± SDs.
FIGURE 5
FIGURE 5
Carnitine reduces lipid accumulation caused by excess fatty acids. (A) Heatmap of the relative expression levels of β‐oxidation‐related genes and muscle differentiation‐related genes in the control (n = 3), high‐fat diet (n = 3) and carnitine treatment groups (n = 3) analysed via RNA‐Seq. (B) Heatmaps of the relative expression levels of β‐oxidation‐related genes and muscle differentiation‐related genes in the cells of the control (n = 3), palmitic acid‐treated (n = 3) and carnitine‐treated groups (n = 3) analysed via RNA‐Seq. (C and D) C2C12 myotube cells were treated with different free fatty acids (palmitic acid, oleic acid and linoleic acid) and different concentrations of carnitine for 24 h. Oil red O staining was performed to assess lipid accumulation. Relative quantitative analyses were performed. (E) C2C12 myotubular cells were treated with different free fatty acids (palmitic acid, oleic acid and linoleic acid) and different concentrations of carnitine for 24 h. Lipid droplet formation was assessed via fluorescence staining with BODIPY 493/503. Relative quantitative analysis was performed. (F) Western blot experiments were performed to assess the protein expression of CPT1 and ACADM in C2C12 myotubes treated with palmitic acid (200 μM) or different concentrations of carnitine (100 μM, 1000 μM). *p < 0.05, **p < 0.01, ***p < 0.001, ***p < 0.0001, means ± SDs.
FIGURE 6
FIGURE 6
Carnitine reverses lipid‐induced mitochondrial damage. (A) C2C12 myotubes were treated with palmitic acid and different concentrations of carnitine and morphological changes in the mitochondria were assessed via transmission electron microscopy. The mitochondrial long axis diameter was measured. (B) C2C12 myotubes were treated with palmitic acid and different concentrations of carnitine; quantitative analysis of MitoSOX Red fluorescence (red) intensity (n = 3). Intramitochondrial ROS were detected with a MitoSOX Red probe and intracellular ROS were detected with a DCFH‐DA fluorescent probe; quantitative analysis of DCFH‐DA fluorescence (green) intensity (n = 3). (C) C2C12 myotubes were treated with palmitic acid and different concentrations of carnitine and JC‐1 staining was used to assess the mitochondrial membrane potential; quantitative analysis of red/green fluorescence intensity showing the ratio of aggregated JC‐1 to monomeric JC‐1 under different treatment conditions. (D) A Seahorse mitochondrial respiration assay was used to assess the effects of palmitic acid and different concentrations of carnitine on C2C12 myotube cells. Maximum respiration, spare capacity and ATP production were analysed. (E) Heatmap of relative expression levels of mitochondrial respiratory chain‐related genes in control (n = 3), high‐fat diet‐fed (n = 3) and carnitine‐treated mice (n = 3) analysed via RNA‐Seq; Heatmap of the relative expression levels of mitochondrial respiratory chain‐related genes in the cells of the control (n = 3), palmitate‐treated (n = 3) and carnitine‐treated groups (n = 3) analysed via RNA‐Seq. (F) Western blot experiments were performed to assess the protein expression of Ndufv1, Sdha, Uqcrc1 and Cox4 in C2C12 myotubes treated with palmitic acid (200 μM) or different concentrations of carnitine (100 μM and 1000 μM). Quantitative analysis of the grayscale ratios of protein bands for Ndufv1, Sdha, Uqcrc1 and Cox4 and for GAPDH (n = 3). *p < 0.05, **p < 0.01, ***p < 0.001, ****p < 0.0001, means ± SDs.
FIGURE 7
FIGURE 7
Carnitine administration ameliorates high‐fat diet‐induced muscle atrophy. (A) Experimental design model. (B) Blood triglyceride and cholesterol levels. (C) Representative images of oil red O‐stained mouse gastrocnemius muscle. The oil red O‐positive area/total area was quantified via ImageJ software. (D) H&E staining of the mouse gastrocnemius muscle and measurement of the cross‐sectional area of the sections. (E) Transmission electron microscopy of mouse skeletal muscle mitochondrial morphology and quantitative statistics of mitochondrial crista density. *p < 0.05, **p < 0.01, ***p < 0.001, ****p < 0.0001, means ± SDs.
FIGURE 8
FIGURE 8
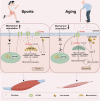
Graphic summary of this study. Under physiological conditions, stress stimulation promotes the transcription and expression of the specific carnitine transport channel protein OCTN2 through the YAP/TEAD4 pathway. Muscle cells take up sufficient amounts of carnitine into the cytosol via OCTN2. Carnitine in the cytoplasm selectively binds fatty acids and then enters the mitochondria for lipid metabolism to provide energy and maintain the physiological function of muscle cells. Under aging conditions, impaired lipid metabolism and lipid accumulation in muscle cells, as well as a decrease in OCTN2 expression due to reduced mechanical stimulation, lead to a decrease in carnitine uptake by muscle cells. The combined effects of these two factors lead to dysfunctions in mitochondrial β‐oxidation and the electron respiratory chain and to oxidative stress in muscle cells, which in turn aggravate lipid accumulation, generating a vicious cycle. Lipotoxicity and mitochondrial dysfunction caused by lipid accumulation in muscle cells accelerate muscle cell aging and ultimately lead to the development of sarcopenia.

References

    1. Pascual‐Fernández J., Fernández‐Montero A., Córdova‐Martínez A., Pastor D., Martínez‐Rodríguez A., and Roche E., “Sarcopenia: Molecular Pathways and Potential Targets for Intervention,” International Journal of Molecular Sciences 21 (2020): 8844. - PMC - PubMed
    1. Cruz‐Jentoft A. J. and Sayer A. A., “Sarcopenia,” Lancet 393 (2019): 2636–2646. - PubMed
    1. Fu X., Zhu M., Zhang S., Foretz M., Viollet B., and Du M., “Obesity Impairs Skeletal Muscle Regeneration Through Inhibition of AMPK,” Diabetes 65 (2016): 188–200. - PMC - PubMed
    1. Okun J. G., Rusu P. M., Chan A. Y., et al., “Liver Alanine Catabolism Promotes Skeletal Muscle Atrophy and Hyperglycaemia in Type 2 Diabetes,” Nature Metabolism 3 (2021): 394–409. - PubMed
    1. Sato A. Y., Richardson D., Cregor M., et al., “Glucocorticoids Induce Bone and Muscle Atrophy by Tissue‐Specific Mechanisms Upstream of E3 Ubiquitin Ligases,” Endocrinology 158 (2017): 664–677. - PMC - PubMed

LinkOut - more resources