. 2025 Sep 14;6(9):e70330.
doi: 10.1002/mco2.70330. eCollection 2025 Sep.

A Novel Genetic TDP-43 Pig Model Mimics Multiple Key ALS-Like Features

Affiliations

A Novel Genetic TDP-43 Pig Model Mimics Multiple Key ALS-Like Features

Chunhui Huang et al. MedComm (2020). .

Abstract

Amyotrophic lateral sclerosis (ALS) is a devastating neurodegenerative disease that lacks ideal models to comprehensively recapitulate its pathological features. TDP-43 pathology, a hallmark of neurodegenerative diseases, plays a critical role in disease progression. Given the anatomical and physiological similarities between pig and human brains, large animal models offer a unique advantage in more accurately simulating patient-specific disease characteristics. In this study, we rapidly established a TDP-43-induced neurodegenerative disease model in pigs through ear vein injection of the TDP-43M337V virus. Disease progression was systematically evaluated using behavioral assessments and pathological analyses. This porcine model produced extremely severe motor dysfunction accompanied by significant muscle atrophy and fibrosis. Additionally, characteristic TDP-43 pathological phenotypes were observed, including degeneration of spinal motor neurons and proliferation of glial cells in both the brain and spinal cord. Notably, TDP-43M337V induction led to a significant upregulation of TMEM106B, SOD1, and APOE4 levels. This TDP-43 porcine model recapitulates multiple key features of ALS and serves as a valuable complement to existing animal models, providing a robust platform for investigating TDP-43-related pathogenic mechanisms of TDP-43 and developing effective therapeutics.

Keywords: APOE4; SOD1; TDP‐43; amyotrophic lateral sclerosis; movement disorder; pig model.


Conflict of interest statement

The authors declare no conflicts of interest.

Figures
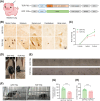
FIGURE 1
FIGURE 1
Ear vein injection of AAV9‐SYN‐Flag‐TDP‐43M337V produced severe ALS‐like movement disorders and behavioral deficits in pigs. (A) Schematic diagram of intravenous injection of AAV9‐SYN‐Flag‐TDP‐43 or AAV9‐SYN‐eGFP virus in the ear margin of pigs. (B) AAV9‐SYN‐Flag‐TDP‐43 was successfully expressed in the central nervous system of pigs by ear vein injection. Immunohistochemical staining of Flag tags in the central nervous system. (C) Body weight records for GFP PIG and TDP PIG (n = 6 per group, data are mean ± SD, *p < 0.05, two‐way ANOVA Sidak's multiple comparisons test was used for statistical, two‐tailed). (D) TDP‐43 pigs showed mobility impairment and limb incoordination. (E) Representative images of footprint experiments. (F) Representative images of treadmill experiments. (G) Quantification of footstep length in the footprint experiment. The distance between footprints of TDP‐43 pigs was significantly shortened (n = 6 per group, data are mean ± SD, ***p < 0.005, unpaired t test was used for statistical, two‐tailed). (H) Quantification of stride frequency per minute in treadmill experiment (n = 6 per group, data are mean ± SD, ***p < 0.005, unpaired t test was used for statistical, two‐tailed).
FIGURE 2
FIGURE 2
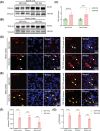
TDP‐43M337V overexpression caused TDP‐43 pathology. (A) Increased expression of TDP‐43 in spinal cord. (B) Increased expression of TDP‐43 in motor cortex. (C) Quantitative statistics of increased TDP‐43 expression in spinal cord and motor cortex (n = 6 per group, data are mean ± SD, **p < 0.01, ****p < 0.001, unpaired t test was used for statistical, two‐tailed). (D) Representative immunofluorescence of TDP‐43 increase in TDP‐43 porcine cytoplasm. (E) Immunofluorescent staining of p‐TDP‐43 (Ser409/410) in TDP‐43 porcine. (F) Statistical chart of abnormal TDP‐43 amounts in different brain regions (n = 6 per group, data are mean ± SD, ****p < 0.001, unpaired t test was used for statistical, two‐tailed). (G) Statistical chart of p‐TDP‐43 amounts in different brain regions (n = 6 per group, data are mean ± SD, ****p < 0.001, unpaired t test was used for statistical, two‐tailed).
FIGURE 3
FIGURE 3
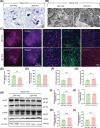
TDP‐43 pigs develop motor neuron degeneration and gliosis in spinal cord. (A) Representative image of toluidine blue‐stained of lumbar spinal cord ventral horn showing degenerating motor neuron with darkened and shrunken cytoplasm in TDP pigs. (B) Transmission electron microscopy image of a degenerating MN with nuclear cavities and electron dense granules in TDP pigs. (C) Representative immunofluorescent staining of CHAT‐positive, NeuN‐positive, GFAP‐positive, and Iba1‐positive cells in the lumbar spinal cord. (D–G) Quantitative statistics of CHAT‐positive (D), NeuN‐positive (E), GFAP‐positive (F), and Iba1‐positive (G) cells in the lumbar spinal cord (n = 6 per group, data are mean ± SD, **p < 0.01, unpaired t test was used for statistical, two‐tailed). (H) Western blot of CHAT, Tuj1, GFAP, and Iba1 in lumbar spinal cord. (I–L) Quantitative statistics of CHAT (I), Tuj1 (J), GFAP (K), and Iba1(L) in the lumbar spinal cord (n = 6 per group, data are mean ± SD, **p < 0.01, ***p < 0.005, unpaired t test was used for statistical, two‐tailed).
FIGURE 4
FIGURE 4
TDP‐43 pigs exhibit severe muscle pathology. (A) Representative H&E staining of skeletal muscle showing muscle atrophy. (B) More than three random fields (corresponding to 100 cross‐sectioned fibers per field) were examined for quantification of muscle fibers of different sizes. (C) Representative Masson staining of skeletal muscle graph showing increased muscle fibrosis in TDP‐43 pigs. (D) Quantitative statistics of skeletal muscle fibrosis (n = 6 per group, data are mean ± SD, ****p < 0.001, unpaired t test was used for statistical, two‐tailed). (E) The western blot of TDP‐43, p‐TDP‐43 (Ser409/410), and p62 expression levels in skeletal muscle. (F–H) Immunohistochemical staining of TDP‐43 (F), p‐TDP‐43 (Ser409/410) (G), and p62 (H) in skeletal muscle (n = 6 per group, data are mean ± SD, **p < 0.01, ***p < 0.005, unpaired t test was used for statistical, two‐tailed).
FIGURE 5
FIGURE 5
Lysosomal and autophagic dysfunction in TDP‐43 porcine spinal cord. (A) Representative immunohistochemical staining of TMEM106B in spinal cord. (B) Western blot of TMEM106B increase in spinal cord. (C) Quantification of TMEM106B increase in spinal cord (n = 6 per group, data are mean ± SD, **p < 0.01, unpaired t test was used for statistical, two‐tailed). (D) Western blot of increased GRN, LAMP1, and CTSD in the spinal cord. (E–G) Quantification of GRN (E), LAMP1 (F), and CTSD (G) increases in the spinal cord (n = 6 per group, data are mean ± SD, **p < 0.01, ****p < 0.001, unpaired t test was used for statistical, two‐tailed). (H) Western blot of increased autophagy marker p62 and the decrease of LC3BII/I in the spinal cord. (I and J) Increased autophagy marker p62 (J) and the decrease of LC3BII/I (J) in the spinal cord (n = 6 per group, data are mean ± SD, ***p < 0.005, ****p < 0.001, unpaired t test was used for statistical, two‐tailed).
FIGURE 6
FIGURE 6
Increased expression of SOD1 and APOE4 in spinal cord and motor cortex of TDP‐43 pigs. (A) Western blot of SOD1 increase in the spinal cord. (B) Western blot of SOD1 increase in motor cortex. (C) Quantification of SOD1 increase in spinal cord and motor cortex (n = 6 per group, data are mean ± SD, **p < 0.01, ***p < 0.005, unpaired t test was used for statistical, two‐tailed). (D) Western blot of APOE4 increase in the spinal cord. (E) Western blot of APOE4 increase in motor cortex. (F) Quantification of APOE4 increase in spinal cord and motor cortex (n = 6 per group, data are mean ± SD, **p < 0.01, unpaired t test was used for statistical, two‐tailed).
FIGURE 7
FIGURE 7
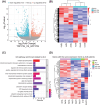
TDP PIG and GFP PIG spinal cord RNA seq results. (A) Volcano plot of differentially expressed genes between TDP PIG and GFP PIG (n  =  3 pigs per group). (B) Heat map of 1404 differentially expressed genes between TDP PIG and GFP PIG. (C) GO enrichment analysis of differentially expressed genes between TDP PIG and GFP PIG. (D) Heat map of genes that are consistent with changes in ALS patient data for differentially expressed genes between TDP PIG and GFP PIG.

References

    1. Brown R. H. and Al‐Chalabi A., “Amyotrophic Lateral Sclerosis,” New England Journal of Medicine 377, no. 2 (2017): 162–172. - PubMed
    1. Xu L., Liu T., Liu L., et al., “Global Variation in Prevalence and Incidence of Amyotrophic Lateral Sclerosis: A Systematic Review and Meta‐Analysis,” Journal of Neurology 267, no. 4 (2020): 944–953. - PubMed
    1. Chia R., Chio A., and Traynor B. J., “Novel Genes Associated With Amyotrophic Lateral Sclerosis: Diagnostic and Clinical Implications,” Lancet Neurology 17, no. 1 (2018): 94–102. - PMC - PubMed
    1. Lepine S., Castellanos‐Montiel M. J., and Durcan T. M., “TDP‐43 Dysregulation and Neuromuscular Junction Disruption in Amyotrophic Lateral Sclerosis,” Translational Neurodegeneration 11, no. 1 (2022): 56. - PMC - PubMed
    1. Rosen D. R., Siddique T., and Patterson D., “Mutations in Cu/Zn Superoxide Dismutase Gene Are Associated With Familial Amyotrophic Lateral Sclerosis,” Nature 362, no. 6415 (1993): 59–62. - PubMed

LinkOut - more resources