A Framework for Anemia Differential Diagnosis in Paleopathology Incorporating Metric Methods
- PMID: 40960151
- PMCID: PMC12442334
- DOI: 10.1002/ajpa.70125
A Framework for Anemia Differential Diagnosis in Paleopathology Incorporating Metric Methods
Abstract
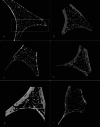
Objectives: This paper explores metric manifestations of anemia in crania undergoing growth and development using micro-CT imaging. It proposes a framework for assigning a most-likely diagnostic option for anemia, based on evaluating the parameters proposed in this study.
Materials and methods: Sixty-eight orbits/frontal bones of individuals aged birth to 15 years from Quebecois and Dutch archaeological collections dating to the 18th and 19th centuries underwent micro-CT analysis. Individuals were visually assessed for skeletal manifestations of marrow hyperplasia within the internal marrow space using a scoring rubric. Bone microarchitecture measurements were used to calculate T-scores and identify individuals who displayed potential manifestations of marrow hyperplasia. Relative cortical thickness ratios of the frontal bone were calculated for 16 individuals. Error testing was performed for all evaluations.
Results: Using the micro-CT analysis and our diagnostic framework, anemia was inferred in 16% (10/61) of the sample that was preserved well enough for the study. Trabecular separation T-scores were considered the most significant metric for evaluating anemia. Frontal bone ratios were regarded as less insightful due to the imaging technique used. Age had a significant effect on bone measurements, and high repeatability was seen across methods.
Discussion: In this study, recommendations for assigning a diagnostic option prioritize evaluating metric features strongly related to anemia through a biological approach that considers the etiology of marrow hyperplasia. Including a combination of metric and internal visual evaluation criteria provides clearer lines of evidence for the assessment of abnormal bone changes associated with anemia beyond the macroscopic evaluation of porous lesions.
Keywords: cribra orbitalia; marrow hyperplasia; micro‐CT; porotic hyperostosis; porotic lesions.
© 2025 The Author(s). American Journal of Biological Anthropology published by Wiley Periodicals LLC.
Conflict of interest statement
The authors declare no conflicts of interest.
Figures


References
-
- Agarwal, K. N. , Drar N., Shah M. M., and Bhardwaj O. P.. 1970. “Roentgenologic Changes in Iron Deficiency Anemia.” American Journal of Roentgenology 110, no. 3: 635–637. - PubMed
-
- Anderson, A. S. 2023. “Observer Agreement on the Morphology of Porous Cranial Lesions: Results From a Workshop at the 2019 Meeting of the Paleopathology Association.” International Journal of Paleopathology 43: 68–71. - PubMed
-
- Anderson, A. S. , Sutherland M. L., O'Donnell L., et al. 2021. “Do Computed Tomography Findings Agree With Traditional Osteological Examination? The Case of Porous Cranial Lesions.” International Journal of Paleopathology 33: 209–219. - PubMed
-
- Angel, J. L. 1966. “Porotic Hyperostosis, Anemias, Malarias, and Marshes in the Prehistoric Eastern Mediterranean.” Science 153, no. 3737: 760–763. - PubMed
-
- Appleby, J. , Thomas R., and Buikstra J.. 2015. “Increasing Confidence in Paleopathological Diagnosis–Application of the Istanbul Terminological Framework.” International Journal of Paleopathology 8: 19–21. - PubMed
Publication types
MeSH terms
Grants and funding
- Canada Research Chairs, 231563
- Department of Anthropology, McMaster University Shelley Saunders/Koloshuk Family Scholarship
- Canadian Association for Biological Anthropology, Shelley R. Saunders Thesis Research Grant
- Social Sciences and Humanities Research Council of Canada, Insight Grant (File Number: 435-2021-0665) and Joseph-Armand Bombardier Canada Graduate Scholarship
LinkOut - more resources
Full Text Sources
Medical
