. 2025 Sep 19;11(38):eadw9095.
doi: 10.1126/sciadv.adw9095. Epub 2025 Sep 17.

Mapping the genetic landscape of iron metabolism uncovers the SETD2 methyltransferase as a modulator of iron flux

Affiliations

Mapping the genetic landscape of iron metabolism uncovers the SETD2 methyltransferase as a modulator of iron flux

Anthony W Martinelli et al. Sci Adv. .

Abstract

Cellular iron levels must be tightly regulated to ensure sufficient iron for essential enzymatic functions while avoiding the harmful generation of toxic species. Here, to better understand how iron levels are controlled, we carry out genome-wide mutagenesis screens in human cells. Alongside mapping known components of iron sensing, we determine the relative contributions of iron uptake, iron recycling, ferritin breakdown, and mitochondrial flux in controlling the labile iron pool. We also identify SETD2, a histone methyltransferase, as a chromatin modifying enzyme that controls intracellular iron availability through ferritin breakdown. Functionally, we show that SETD2 inhibition or cancer-associated SETD2 mutations render cells iron deficient, thereby driving resistance to ferroptosis and potentially explaining how some tumors evade antitumoral immunity.


Figures

Fig. 1.
Fig. 1.. IRP2-Clover reporter cells provide a sensitive and dynamic readout for intracellular iron levels.
(A) Under conditions of iron repletion, IRP2 is targeted for proteasomal degradation by FBXL5 in an oxygen-dependent manner, whereas when iron is deplete, IRP2 binds IREs to exert posttranscriptional control of cellular iron homeostasis. (B) HeLa cells were treated with DFO (100 μM, 24 hours) or BafA (10 nM, 24 hours) with or without ferric iron supplementation (FAC, 100 μM, 24 hours) and protein levels of IRP2, ferritin heavy chain (FTH1), ferritinophagy cargo receptor NCOA4, and β-actin assessed by immunoblot (n = 3). (C) Schematic of the IRP2-Clover reporter construct. (D) HeLa IRP2-Clover cells were treated with iron depletion by BafA (10 nM, 20 hours) or DFO (100 μM, 20 hours) with or without addition of iron. Cells were analyzed by immunoblot for IRP2, NCOA4, FTH1, and β-actin (n = 4). (E) HeLa IRP2-Clover cells were treated with iron depletion by DFO (200 μM, 20 hours) with or without addition of iron and analyzed by flow cytometry (n = 5). (F) A549 IRP2-Clover cells were treated with iron depletion by DFO (200 μM, 20 hours) with or without addition of iron and analyzed by flow cytometry (n = 3). (G) HeLa IRP2-Clover cells were transduced with sgRNA targeting TFRC with cell surface antibody staining for TfR and analysis by flow cytometry (n = 3). (H) Cells were transduced with sgRNA targeting NCOA4 before analysis by flow cytometry (n = 3). IRP2-Cl, IRP2-Clover.
Fig. 2.
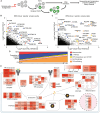
Fig. 2.. Genome-wide mutagenesis screens define the key regulators of intracellular iron metabolism.
(A) HeLa or A549 IRP2-Clover cells expressing Cas9 were mutagenized with genome-wide sgRNA libraries, selected for lentiviral integration, and underwent FACS for CloverHIGH cells after 8 days. Sorted cells were split between lysis for immediate DNA extraction and expansion for a second sort (days 16 to 18). DNA from phenotypically nonselected library cells was extracted for comparison, and cells were pooled before any selection event. (B and C) Bubble plots showing screen hits (genes overrepresented in sorted cells, as calculated by MAGeCK) identified in the A549 IRP2-Clover-TKOv3 screen (y axis) compared to the HeLa IRP2-Clover-Whitehead screen (x axis) at early (B, day 8) and late (C, day 16 or day 18, respectively) time points. Genes with related functions are highlighted. (D) Genes identified in either screen as top hits [−log(P value) >3] at early or late time points were manually annotated for function to assess changes over time, with genes of unknown function excluded (49/72 unknown at early time point and 44/104 unknown at late time point). (E) Across the HeLa IRP2-Clover-Whitehead and A549 IRP2-Clover-TKOv3 screens (both early and late time points), 150 unique genes were identified as registering a −log(P value) of >3 by MAGeCK analysis. Of these, 61 mapped to complexes and pathways with identifiable roles in cellular iron metabolism and 4 could be localized to the nucleus. For each gene, the color in the left box represents the highest −log(P value) of the two time points assessed for the HeLa IRP2-Clover screen and the color in the right box corresponds to the equivalent value for the A549 IRP2-Clover screen. IRP2-Cl, IRP2-Clover; MAGeCK, Model-based Analysis of Genome-wide CRISPR-Cas9 Knockout.
Fig. 3.
Fig. 3.. The exocyst complex, mitochondrial iron metabolism, and iron sulfur cluster assembly influence cellular iron flux.
(A) A549 IRP2-Clover cells were transduced with shRNA targeting EXOC1 and underwent immunoblot for IRP2 and β-actin. EXOC1 depletion was confirmed by reverse transcription quantitative polymerase chain reaction (RT-qPCR) (n = 3). (B) A549 IRP2-Clover cells were transduced with shRNA targeting EXOC1 and underwent flow cytometry for measurement of IRP2-Clover levels (n = 3). (C) HeLa IRP2-Clover cells were transduced with sgRNA targeting EXOC1 and stained with antibody targeting surface TfR before analysis by flow cytometry (n = 2). (D) TfR uptake and recycling. HeLa cells with or without knockdown of EXOC1 by shRNA were serum starved for 45 min, incubated with Tf-AF647 (5 μg/ml) for 5 min, washed with PBS, and recovered in serum-free medium for the indicated time periods. Internalized Tf-AF647 was assessed by flow cytometry. TfR surface levels were detected by flow cytometry (n = 3, note controls identical for both conditions). (E) A549 IRP2-Clover cells were transfected twice with siRNA targeting HSCB (48 and 24 hours before analysis by flow cytometry) ± ferric iron (FAC, 200 μM, 24 hours). Knockdown was confirmed by RT-qPCR (right) (n = 3). (F) A549 IRP2-Clover cells were transfected with siRNA targeting MFRN1 ± ferric iron (FAC, 200 μM, 24 hours) before analysis by flow cytometry (left). Knockdown was confirmed by RT-qPCR (right) (n = 3). IRP2-Cl, IRP2-Clover.
Fig. 4.
Fig. 4.. SETD2-mediated IRP2 accumulation is dependent on enzymatic activity.
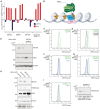
(A) Bar chart detailing the log2(fold change) in individual sgRNA counts for SETD2 in the A549 IRP2-Clover CRISPR screen, as well as an associated splicing regulator (SRSF3). DMT1 was included as a positive control, and SETD4 was included as a negative control. (B) Schematic illustrating the canonical role of SETD2 in H3K36me3 and regulation of splicing. Spliceosome components enriched for sgRNA in the screens are shown in dark green. (C and D) HeLa IRP2-Clover cells were transduced with sgRNA targeting SETD2 (C) (n = 4) or shRNA targeting SETD2 with a shRNA scrambled control (D) (representative of at least three biological replicates). IRP2-Clover fluorescence was measured by flow cytometry. (E) HeLa cells were transduced with shRNA targeting SETD2 and treated with or without ferric iron supplementation (FAC, 200 μM) for 24 hours before analysis by immunoblot (n = 4). (F and G) A549 IRP2-Clover cells were transduced with sgRNA (n = 3) or shRNA (n = 4) targeting SETD2 and treated with or without ferric iron supplementation (FAC, 200 μM, 24 hours) before analysis by flow cytometry. (H) HeLa cells were transduced with shRNA targeting SETD2, and cells were lysed before analysis by immunoblot for levels of SETD2, H3K36me3, IRP2, β-actin, and H3 (n = 4). (I) A549 IRP2-Clover cells were treated with EZM0414 (200 nM, 48 hours), with or without ferric iron supplementation (FAC, 200 μM, 24 hours) before analysis by flow cytometry for IRP2-Clover levels (left) and immunoblot for H3K36me3 and H3 (right) (n = 3). IRP2-Cl, IRP2-Clover.
Fig. 5.
Fig. 5.. Loss of SETD2 results in increased NCOA4 and altered ferritinophagy.
(A) HeLa cells were transduced with shRNA targeting SETD2 or a scrambled control. Cells were lysed in nitric acid before analysis by ICP-MS. Duplicate cell cultures were counted and measurements normalized to cell number (n = 4 in technical triplicate; P = 0.31, paired t test). n.s., not significant. (B) HeLa cells were transduced with shRNA targeting SETD2 and protein levels of SETD2, IRP2, NCOA4, and β-actin measured by immunoblot (representative of at least three biological replicates). (C) HeLa and HeLa IRP2-Clover cells were transduced with shRNA targeting SETD2 and underwent flow cytometry for surface TfR and IRP2-Clover (n = 3). Transcript levels of SETD2 and TFRC were measured by RT-qPCR (n = 7). (D) TfR uptake and recycling. SETD2 was depleted in HeLa IRP2-Clover cells using shRNA, along with a shRNA scrambled control. Cells were serum starved for 5 min, incubated with Tf-AF647, and recovered in serum-free medium for the indicated time points. Internalized Tf-AF647 was assessed by flow cytometry (n = 3). (E) Control or SETD2-depleted HeLa cells (shRNA) were treated with DFO (100 μM) for 0 to 8 hours and levels of NCOA4, FTH1, and β-actin measured by immunoblot (n = 3). Immunoblots were quantified and normalized to loading and 0-hour time points before calculation of the NCOA4:FTH1 ratio. hr, hours. (F) Publicly available RNA-seq data from wild-type and SETD2 stable KO (SETD2 null) 786-O cells (GSE150609) were analyzed using rMATS, and splicing events were quantified. IRP2-Cl, IRP2-Clover.
Fig. 6.
Fig. 6.. SETD2 depletion correlates with cancer cell survival and resistance to ferroptosis.
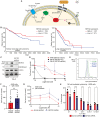
(A) Schematic describing the key pathways in ferroptosis [membrane icon from Servier (https://smart.servier.com/), CC BY 3.0 Unported, https://creativecommons.org/licenses/by/3.0/deed.en]. ROS, reactive oxygen species. (B) Kaplan-Meier survival analysis for ccRCC and lung adenocarcinoma comparing survival of patients with tumors with high (top 30%) and low (bottom 30%) SETD2 expression levels. Curves generated using OncoLnc, data from The Cancer Genome Atlas, log-rank P value = 0.02 (KIRC) and 0.04 (LUAD). (C) 786-O cells ± SETD2 knockdown were analyzed by immunoblot for levels of SETD2, H3K36me3, β-actin, and H3 in comparison to 786-O wild-type and A498 wild-type cells (n = 3). (D) A498 cells and 786-O cells were treated with increasing concentrations of erastin and live cells counted after 24 hours. 786-O cells were transduced with shRNA targeting SETD2 and the assay repeated (n = 5, as the percentage of untreated cells). (E) 786-O cells ± SETD2 knockdown were treated with erastin (1 μM, 24 hours) and stained with BODIPY C11 (5 μM, 35 min) before analysis by flow cytometry (n = 3). (F) A549 cells ± SETD2 knockdown were treated with erastin (1 μM, 48 hours) and live cells counted (n = 5, as the percentage of untreated cells; P = 0.03, paired t test). (G) A549 cells ± SETD2 knockdown were treated with erastin (10 nM to 10 μM, 48 hours) and ferrostatin (1 μM, 48 hours) and live cells counted (n = 3, as the percentage of untreated cells). (H) H838 cells ± SETD2 knockdown were incubated with primary ex vivo expanded human NK cells for 4 hours at a range of effector:target (E:T) cell ratios, with both cell groups labeled (CFSE or Tag-IT Violet). Proportion of dead target cells was measured by Fixable Viability Dye eFluor 780 staining and flow cytometry (n = 3 biological replicates; ****P < 0.0001, ****P < 0.0001, ***P = 0.0007, *P = 0.0147, *P = 0.0358, two-way repeated measures ANOVA with a post hoc test for each E:T ratio).

References

    1. Leibold E. A., Munro H. N., Cytoplasmic protein binds in vitro to a highly conserved sequence in the 5′ untranslated region of ferritin heavy- and light-subunit mRNAs. Proc. Natl. Acad. Sci. U.S.A. 85, 2171–2175 (1988). - PMC - PubMed
    1. Rouault T. A., Hentze M. W., Caughman S. W., Harford J. B., Klausner R. D., Binding of a cytosolic protein to the iron-responsive element of human ferritin messenger RNA. Science 241, 1207–1210 (1988). - PubMed
    1. Samaniego F., Chin J., Iwai K., Rouault T. A., Klausner R. D., Molecular characterization of a second iron-responsive element binding protein, iron regulatory protein 2. Structure, function, and post-translational regulation. J. Biol. Chem. 269, 30904–30910 (1994). - PubMed
    1. Guo B., Yu Y., Leibold E. A., Iron regulates cytoplasmic levels of a novel iron-responsive element-binding protein without aconitase activity. J. Biol. Chem. 269, 24252–24260 (1994). - PubMed
    1. Rouault T. A., Tang C. K., Kaptain S., Burgess W. H., Haile D. J., Samaniego F., McBride O. W., Harford J. B., Klausner R. D., Cloning of the cDNA encoding an RNA regulatory protein—The human iron-responsive element-binding protein. Proc. Natl. Acad. Sci. U.S.A. 87, 7958–7962 (1990). - PMC - PubMed