. 2025 Sep 19;11(38):eady5212.
doi: 10.1126/sciadv.ady5212. Epub 2025 Sep 17.

Gangliosides modulate the secretion of extracellular vesicles and their misfolded protein cargo

Affiliations

Gangliosides modulate the secretion of extracellular vesicles and their misfolded protein cargo

John Monyror et al. Sci Adv. .

Abstract

Gangliosides are glycosphingolipids with important roles in cell signaling and neuroprotection. While present on extracellular vesicles (EVs)-key mediators of intercellular communication-their role in EV biogenesis remains unclear. Here, we identify gangliosides as key modulators of EV biogenesis, with the specific composition of their glycan headgroup and the presence or absence of sialic acid and N-acetyl-d-galactosamine residues dictating whether they promote or inhibit EV biogenesis. GM1 and other complex gangliosides enhance EV secretion, while disruption of ganglioside synthesis impairs it. GM1 supplementation restores EV secretion in Huntington's disease (HD) fibroblasts and cell models with ganglioside deficiency, including models of neurodegenerative diseases caused by a genetic block of ganglioside synthesis. Notably, GM1 enhances EV-mediated secretion of pathogenic misfolded proteins, including mutant huntingtin (mHTT), α-synuclein, and tau, reducing intracellular burden and providing mechanistic insight into the mHTT-lowering effects of GM1 in HD models. Our findings shed light on the neuroprotective roles of gangliosides and their therapeutic potential in misfolded protein disorders.


Figures

Fig. 1.
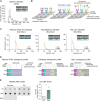
Fig. 1.. Administration of ganglioside GM1 promotes the secretion of EVs from murine and human cells of different origins.
(A) N2a cells were treated with GM1 [50 μM, 6 hours (h)]. EVs were collected in serum-free medium containing N-2 for 16 hours and counted by IFC (n = 3 experiments). (B) Representative IFC dot plots and quantification of DiD+-EVs secreted by control or GM1-treated N2a cells. GM1 (50 μM) was present throughout a 22-hour EV collection (n = 15 experiments). (C) Representative size-exclusion chromatogram and quantification (inset) of EVs secreted by N2a cells treated with GM1 or vehicle for 6 hours. DiD fluorescence in each fraction was normalized to cellular protein. Peaks correspond to EV-rich fractions (7 to 10). Inset, DiD+-EVs in the EV-rich fractions measured by IFC and normalized to total cellular protein (n = 4 experiments). (D) N2a cells were treated with GM1 (50 μM, 18 hours), washed, and EVs collected for 24 hours were isolated by ultracentrifugation. (Left) Representative immunoblot for flotillin-1 (EVmarker) and calnexin (cell contamination control). (Right) DiI fluorescence in the EV pellet was measured by fluorometry and normalized to total cellular protein (n = 4 experiments). (E) DIV15 rat cortical neurons were treated with GM1 (50 μM, 72 hours). Equal fractions of ultracentrifugation-isolated EVs from control and GM1-treated neurons were immunoblotted (n = 2 independent cultures). (F) Human i3Neurons were treated with GM1 (50 μM) during a 22-hour EV collection (n = 4 experiments). (G) HeLa cells were incubated with GM1 (50 μM, 18 h), washed, and EVs collected for 24 h (n = 4 experiments). (H) Human fibroblasts from a healthy donor were treated with GM1 (50 μM, 6 hours), washed, and EVs collected for 16 hours (n = 3 experiments). [(B) and (E) to (H)] DiD+-EVs in CCM was measured by IFC and normalized to total cellular protein. Bars show means ± SD. Two-tailed paired t test. *P < 0.05, ***P < 0.001.
Fig. 2.
Fig. 2.. Cell treatment with GM1 preserves EV size and tetraspanin profile but increases EV GM1 content.
(A) Particle size distribution profile of EVs secreted by N2a cells treated with GM1 compared to untreated cells, as measured by NTA. EV concentration was normalized to a common scale. The table reports the mean particle diameter ± SD and P values calculated by two-tailed paired t test (n = 3 experiments). (B) Schematic of the ExoView tetraspanin-capture chip to capture and profile EVs. EVs captured onto chips by anti-tetraspanin antibodies printed onto the chips are then labeled with fluorescent anti-tetraspanin antibodies and imaged for tetraspanin profiling and sizing by single-particle interferometric reflectance imaging (SP-IRIS). (C) Particle size distribution profile of EVs secreted by human i3Neurons (n = 2 experiments), human fibroblasts (n = 3 donor cell lines), and HeLa cells (n = 3 experiments) treated with GM1 compared to untreated cells, as detected by SP-IRIS. EV counts were normalized to a common scale. The table insets report the mean particle diameter ± SD and P values obtained by two-tailed paired t test. (D) Tetraspanin profile of EVs secreted by human i3Neurons (n = 2 experiments), human fibroblasts (n = 3 donor cell lines), and HeLa cells (n = 3 experiments) treated with GM1 compared to untreated cells. Colored bars show the proportion of EVs bearing the indicated tetraspanin combinations. *P < 0.05 by two-way analysis of variance (ANOVA) of probit-transformed data with Šídák’s post hoc test. (E) Representative dot blot of cholera toxin B binding to quantify GM1 in cell lysates and EVs from N2a cells treated with GM1 (50 μM, 6 hours), compared to untreated cells. GM1 was washed off, and EVs were collected for 16 hours and isolated by SEC. The graph shows the densitometric analysis of cholera toxin B binding to EV fractions, normalized to DiI EV fluorescence. Bars are means ± SD. *P < 0.05 by two-tailed paired t test (n = 3 experiments). (B) was created in BioRender Monyror, J. (2025) https://BioRender.com/r66v912.
Fig. 3.
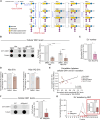
Fig. 3.. Lowered cellular ganglioside levels result in attenuated EV secretion.
(A) The ganglioside biosynthetic pathway. Glycan moieties follow the Symbol Nomenclature for Glycans (SNFG). Enzymes in blue; the major brain gangliosides are boxed in gray. Genz-123346 inhibits GlcCer synthase; the gene product of Ugcg. B4galnt1 was knocked-out using CRISPR-Cas9. [Adapted from Sipione et al. (29)]. (B) Representative dot-blot and densitometric analysis of cholera toxin binding to lysates from N2a and N2a 97Q cells lysates after 48 hours of treatment with 1 μM Genz-123346, to assess GM1 levels. Tubulin was the loading control (n = 5 experiments). (C) Fold-change in DiD+-EV secretion by mHTT-expressing N2a 97Q versus N2a cells, measured by IFC and normalized to cellular protein (n = 4 experiments). (D) DiD+- EV fluorescence in the CCM of N2a (left) and N2a 97Q (right) cells after 48 hours of 1 μM Genz-123346 treatment, normalized to cellular protein (n = 5 experiments). (E) Pearson correlation between cellular GM1 levels (quantified by cholera toxin binding and normalized to tubulin) and EV secretion (measured by IFC and DiD+-EV number normalized to total cellular DiD fluorescence) in N2a and N2a 97Q cells treated with DMSO (vehicle) or Genz-123346 for 48 hours (n = 5 experiments). (F) Dot-blot and densitometric analysis of cholera toxin binding to assess GM1 in N2a and N2a ΔB4galnt1 cell lysates after 22 to 24 hours in serum-free medium containing N-2. Tubulin was used as the loading control (n = 6 experiments). (G) Representative size-exclusion chromatogram of EVs secreted by N2a and N2a ΔB4galnt1 cells. DiI fluorescence in each fraction was normalized to cellular DiI. Peaks represent EV-rich fractions (7 to 10). Inset, DiI+-EVs in the EV-rich fractions measured by IFC and normalized to cellular DiI (n = 3 experiments). Bars show means ± SD. *P < 0.05, **P < 0.01, ***P < 0.001, ****P < 0.0001 by two-way ANOVA with Tukey’s post hoc test (B) or two-tailed paired t test [(C), (D), (F), and (G)].
Fig. 4.
Fig. 4.. GM1 administration rescues EV secretion in cells with impaired ganglioside synthesis.
(A) Total EV fluorescence in the CCM of N2a ΔB4galnt1 cells incubated with 50 μM GM1 or a 50 μM equimolar mixture of the major brain gangliosides (G. Mix: GM1, GD1a, GD1b, and GT1b) for 22 hours (n = 4 experiments). (B) Number of DiD+-EVs secreted by N2a 97Q cells treated with 50 μM GM1 for 6 hours compared to untreated cells (n = 4 experiments). (C) Number of EVs secreted by primary human fibroblasts from three healthy controls and three age-matched patients with HD incubated 50 μM GM1 for 22 hours, compared to untreated controls. EVs were captured and analyzed using the Exoview platform. Circles represent the data from different donors. EV fluorescence and numbers were normalized to total cellular protein content. Bars indicate means ± SD. *P < 0.05, **P < 0.01, ***P < 0.001 by one-way ANOVA with Tukey’s post hoc test (A), two-tailed paired t test (B), or two-way ANOVA with Tukey’s post hoc test (C).
Fig. 5.
Fig. 5.. Secretion of mHTT within EVs is modulated by the cellular ganglioside content.
(A) (Left) Representative immunoblots of EVs isolated by SEC from the conditioned medium of N2a 97Q cells treated or not with 1 μM Genz-123346 for 48 hours. EVs were collected in the last 24 hours of incubation. ALIX and CD9 are EV markers. EV-associated mHTT-EGFP was quantified by densitometry (graph on the right; n = 3 experiments). (B) mHTT-EGFP in EVs was quantified by ELISA and normalized to total cellular protein content (n = 3 experiments). (C) Representative immunoblot of mHTT-EGFP in N2a 97Q cell lysates and EVs isolated by ultracentrifugation after cell treatment with GM1 (50 μM, 18 hours), followed by EV collection for 24 hours. Flotillin-1 is an EV marker. Densitometric values (means ± SD) are shown below each band. Data were normalized over total cellular protein for EVs (n = 2 experiments) or total protein stain for lysates (n = 3 experiments). (D) ELISA quantification of mHTT-EGFP in SEC-isolated EVs from N2a 97Q treated with GM1 (50 μM, 22 hours). Data were normalized to total cellular protein (n = 3 experiments). (E) (Left) PC12 14A2.5 cells were induced with ponasterone A for 72 hours to express mHTT-EGFP and treated with GM1 (50 μM) for the last 24 hours. EVs in the CCM were analyzed by IFC. (Right) Representative IFC images of mHTT-EGFP- and mHTT-EGFP+-EVs. (F) Quantitation of total EVs (DiD+, left), mHTT+-EVs (DiD+/EGFP+, middle), and their mean EGFP intensity (right) by IFC (n = 3 experiments). EV counts were normalized to total cellular protein. Bars show means ± SD. *P < 0.05, **P < 0.01, ***P < 0.001 by two-tailed paired t test [(A), (B), and (F)] or ratio paired t test (D). (E) was created in BioRender. Monyror, J. (2025) https://BioRender.com/nuqysro.
Fig. 6.
Fig. 6.. Intracellular mHTT levels are reduced following GM1 treatment.
(A) PC12 14A2.5 cells were induced to express mHTT-EGFP with ponasterone A for 6 hours. Ponasterone A was then washed off to allow to follow mHTT clearance over time in untreated cells and cells incubated with 50 μM GM1 for up to 48 hours. (B) Representative immunoblot of the time course of mHTT-EGFP clearance after withdrawal of ponasterone A. (C) Densitometric analysis of mHTT-EGFP levels normalized to total protein stain and quantitation of cumulative mHTT-EGFP burden (area under the curve, AUC) (n = 3 experiments). (D) Total protein quantification in lysates of Ctrl and GM1-treated PC12 14A2.5 cells over 48 hours (n = 3 experiments). (E) Representative immunoblot and densitometric analysis of intracellular full-length (FL) mHTT in STHDh Q111/111 cells following treatment with 50 μM GM1 for 48 hours compared to untreated cells (n = 4 experiments). Bars show mean values ± SD. *P < 0.05 by two-tailed paired t test. (A) was in BioRender. Monyror, J. (2025) https://BioRender.com/76b8sqh.
Fig. 7.
Fig. 7.. GM1 promotes cellular secretion of α-synuclein and tau through EVs.
(A) N2a cells expressing A53T α-synuclein–EGFP were incubated with 50 μM GM1 for 22 hours in phenol red– serum-free medium supplemented with N-2. EVs were isolated by SEC and quantified by fluorometry (left). EV-associated A53T α-synuclein–EGFP was measured by ELISA (right). Data were normalized to total cellular protein content (n = 3 independent experiments). (B) WT GFP-Tau, N279K GFP-Tau, or P301L GFP-Tau expression was induced in HEK293T cells with doxycycline (10 ng/ml) for 72 hours. Cells were then incubated with 50 μM GM1 for 22 hours; EVs were isolated by SEC and quantified by IFC (left). EV-associated GFP-Tau was measured by ELISA (right). Data were normalized to total cellular protein content (n = 3 experiments). Bars show means. *P < 0.05, **P < 0.01 by paired t test (A) or two-way ANOVA with Tukey’s post hoc test (B).
Fig. 8.
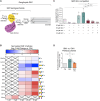
Fig. 8.. The effects of gangliosides on EV secretion depend on their ceramide tail and the presence of sialic acid and N-acetyl-d-galactosamine in their headgroup.
(A) Structure of ganglioside GM1 as a prototypical ganglioside. N-acetyneuraminic acid (sialic acid), N-acetyl-d-galactosamine (GalNac), and the ceramide tail are highlighted in purple, yellow and gray, respectively. The SNFG symbols for sialic acid and GalNac are shown in brackets beside the sugar residue name. (B) Heatmap of the log2 fold-change of the number of EVs secreted from N2a cells treated with different gangliosides and glycosphingolipids at the indicated concentrations for 22 hours compared to their respective controls. Blue shades indicate decreased EV secretion, and red shades indicate increased EV secretion. The SNFG structures of each tested ganglioside and glycosphingolipid are shown on the right of the heatmap. The number of EVs in the CCM was measured by IFC and normalized to total cellular protein content (n = 3 to 5 experiments). GlcCer and LacCer did not significantly affect EV secretion (P > 0.05 by Friedman’s test). All ganglioside treatments significantly affected EV secretion (P < 0.05 by Friedman’s test). (C) N2a cells were treated with ganglioside GM1 or GA1 individually or together at the indicated concentrations for 22 hours in phenol red- serum–free medium supplemented with N-2. The number of EVs in the CCM was measured by IFC and normalized to total cellular protein content (n = 3 experiments). (D) Fluorescence of EVs secreted by N2a cells treated with 50 μM GM1 or GM1 pentasaccharide (GM1 PS) for 22 hours. EV fluorescence was normalized to total cellular protein (n = 5 experiments). Heatmap cells are means. Bars represent means ± SD. *P < 0.05, **P < 0.01, ***P < 0.001 by Friedman’s test (B), repeated measures one-way ANOVA with Tukey’s post hoc test (C), or one-way ANOVA with Tukey’s post hoc (D).

References

    1. van Niel G., D'Angelo G., Raposo G., Shedding light on the cell biology of extracellular vesicles. Nat. Rev. Mol. Cell Biol. 19, 213–228 (2018). - PubMed
    1. Chang W. H., Cerione R. A., Antonyak M. A., Extracellular vesicles and their roles in cancer progression. Methods Mol. Biol. 2174, 143–170 (2021). - PMC - PubMed
    1. Takeuchi T., Pathogenic and protective roles of extracellular vesicles in neurodegenerative diseases. J. Biochem. 169, 181–186 (2021). - PubMed
    1. Liang W., Sagar S., Ravindran R., Najor R. H., Quiles J. M., Chi L., Diao R. Y., Woodall B. P., Leon L. J., Zumaya E., Duran J., Cauvi D. M., De Maio A., Adler E. D., Gustafsson A. B., Mitochondria are secreted in extracellular vesicles when lysosomal function is impaired. Nat. Commun. 14, 5031 (2023). - PMC - PubMed
    1. Budnik V., Ruiz-Canada C., Wendler F., Extracellular vesicles round off communication in the nervous system. Nat. Rev. Neurosci. 17, 160–172 (2016). - PMC - PubMed

LinkOut - more resources