. 2025 Oct 21;6(10):102360.
doi: 10.1016/j.xcrm.2025.102360. Epub 2025 Sep 16.

Tumor-specific but immunosuppressive CD39+CD8+ T cells exhibit double-faceted roles in clear cell renal cell carcinoma

Affiliations

Tumor-specific but immunosuppressive CD39+CD8+ T cells exhibit double-faceted roles in clear cell renal cell carcinoma

Yong Joon Lee et al. Cell Rep Med. .

Abstract

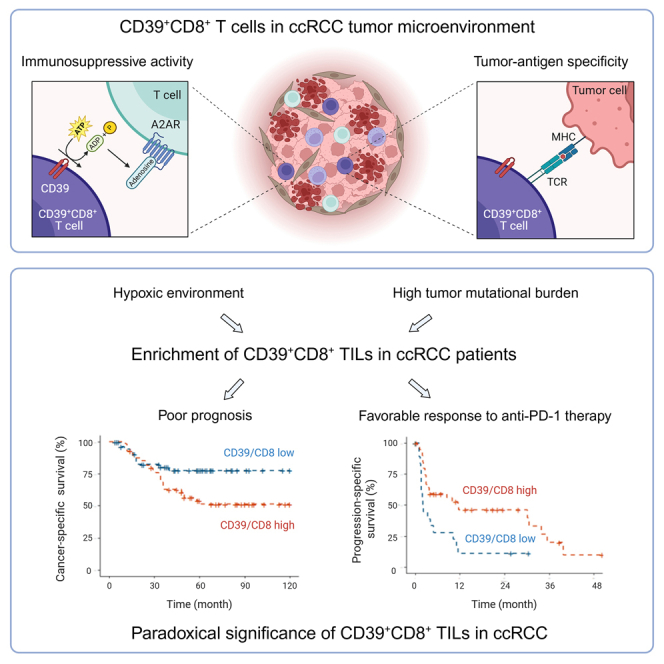
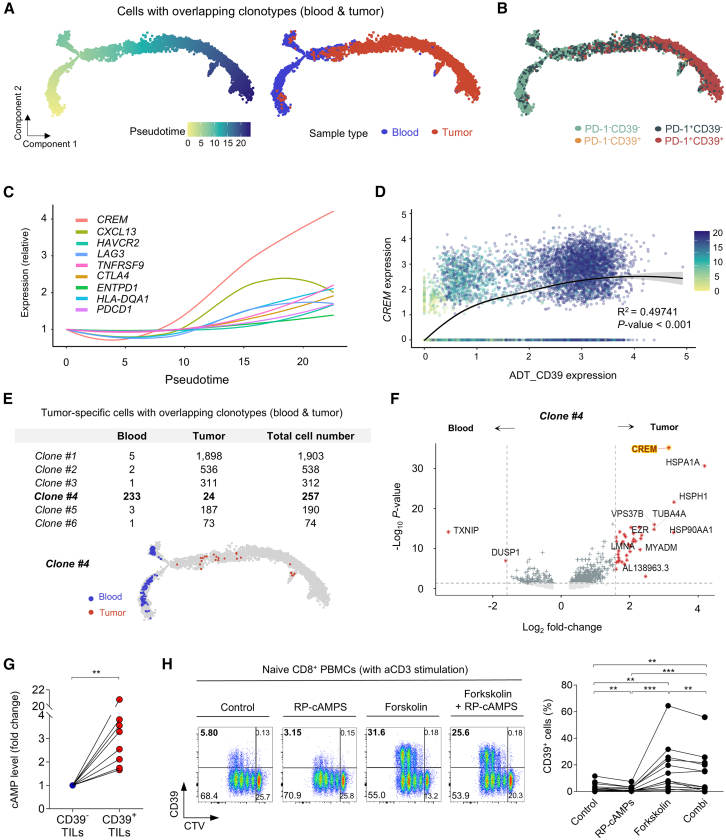
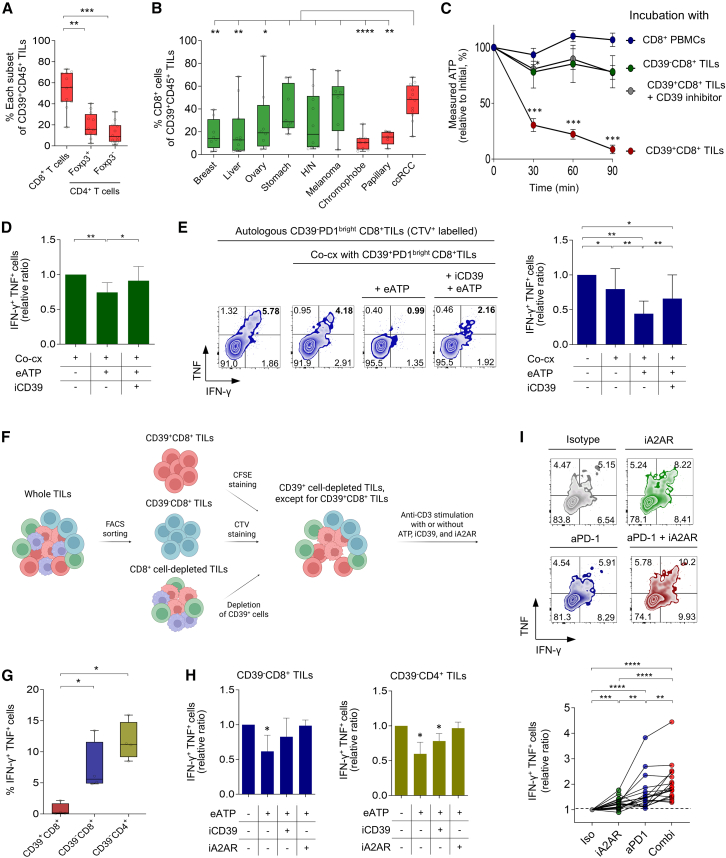
CD39+CD8+ T cells are known as tumor-antigen-specific cells among CD8+ tumor-infiltrating lymphocytes (TILs). However, CD39+CD8+ T cells also reportedly exhibit immunosuppressive activity in hypoxic tumor models. Here, we investigate CD39+CD8+ TILs in clear cell renal cell carcinoma (ccRCC), a Von Hippel-Lindau (VHL) mutation-associated hypoxic tumor. Single-cell analyses confirm that CD39+CD8+ cells are a terminally exhausted subset of tumor-specific CD8+ TILs. CD39+CD8+ T cell development is directly induced by cAMP and T cell receptor (TCR) signaling. Analysis of a renal cell carcinoma (RCC) cohort reveals that the proportion of CD39+CD8+ TILs is associated with a high tumor mutational burden and hypoxic features. Ex vivo functional assays reveal that CD39+CD8+ TILs exert immunosuppressive activity via ectonucleotidase activity- and adenosine-dependent mechanisms. CD39+CD8+ TIL enrichment predicts poor prognosis in patients with ccRCC yet also predicts favorable treatment responses to anti-programmed cell death protein 1 (PD-1) therapy. This paradoxical prognostic significance in ccRCC is explained by the dual properties of CD39+CD8+ TILs: tumor antigen specificity and immunosuppressive activity.

Keywords: CD39(+)CD8(+) T cells; adenosine pathway; anti-PD-1 therapy; clear cell renal cell carcinoma; hypoxia; immunosuppressive activity; paradoxical prognosis; tumor antigen specificity; tumor microenvironment.


Conflict of interest statement

Declaration of interests The authors declare no competing interests.

Figures

None
Graphical abstract
Figure 1
Figure 1
CD39+CD8+ T cells are terminally exhausted tumor-specific cells within tumors (A) Scheme of single-cell analysis. Memory CD8+ T cells (CCR7CD45RA and CCR7CD45RA+ subsets) were sorted from samples of three patients with RCC, including tumor tissue (n = 3) and peripheral blood (n = 2). (B) Uniform manifold approximation and projection (UMAP) plots of five CD8+ T cell clusters (left), distribution of cells according to the origin (middle), and frequency of each cluster among total cells from each origin (right). (C) In silico gating of CD8+ T cells using antibody-derived tags (ADTs) capturing PD-1 and CD39 (left), and UMAP plots showing the distribution of each subset (right). PD-1 and CD39 expression were classified as positive or negative based on reflection points determined in Figure S1D. (D) Schematic illustrating bulk TCR sequencing of tumor-reactive 4-1BB+CD39+CD8+ TILs after co-culturing with autologous tumor cells (EPCAM+ cells) and identification of tumor-specific cells by mapping tumor-reactive clonotypes onto the single-cell sequencing data. (E) CD8+ TILs are visualized using UMAP and color-coded based on clonal expansion. Each dot represents a single CD8+ T cell. (F) Pie charts show the distribution of clonal expansion levels in TILs for tumor-reactive clones (left, 175 clones) and all other non-reactive clones (right, 5,026 clones). (G) PD-1 and CD39 protein expression in tumor-specific CD8+ T cells (left). Bar plots show their distribution according to PD-1 and CD39 protein expression (middle) and across transcriptome-based clusters (right) in both blood and tumor. (H) PD-1 and CD39 protein expression in virus-specific CD8+ T cells (left). Bar plots show their distribution according to PD-1 and CD39 protein expression (middle) and across transcriptome-based clusters (right) in both blood and tumor. (I) Pie charts show the distribution of five transcriptional clusters within each subpopulation of tumor-specific CD8+ T cells classified by PD-1 and CD39 expression in blood and tumor. (J) Pattern of ADT expression in each subpopulation of tumor-specific CD8+ T cell classified by PD-1 and CD39 expression.
Figure 2
Figure 2
Tumor-infiltrating CD39+CD8+ T cells exhibit enhanced cAMP and TCR signaling (A and B) The ordering of CD8+ T cells with clonotypes that overlap between peripheral blood and tumor along pseudotime. (A) Annotated with the pseudotime ordering (left) and sample origin (right). (B) Annotated with CD8+ T cell subpopulations classified by PD-1 and CD39 expression. (C) Relative expression of selected genes related to T cell differentiation, according to the pseudotime. (D) Relative CREM expression according to the CD39 ADT expression. Trend line and error are for linear regression with 95% CI. Pearson’s R2 and two-sided p value are listed. (E) Table showing the number of cells for six tumor-specific T cell clones shared between blood and tumor (top). Clone #4 was the most abundant in blood (n = 233) and was also detected at relatively high frequency in tumor (n = 24). Distribution of clone #4 cells along the pseudotime trajectory (bottom). (F) Volcano plot showing differential gene expression between tumor-specific CD8+ T cells of clone #4 from blood and tumor. (G) Relative concentration of intracellular cAMP within CD39 and CD39+CD8+ TILs (n = 8). Fold change values are shown relative to CD39CD8+ TILs within each sample. ∗∗p < 0.01 by Wilcoxon matched-pairs signed-rank test. (H) CD39 expression in naive CD8+ T cells from PBMCs following anti-CD3 stimulation under indicated conditions: control, RP-cAMPS (cAMP-reducing agent), forskolin (cAMP-elevating agent), and forskolin + RP-cAMPS. Representative flow cytometry plots are shown on the left. The graph on the right shows the proportion of CD39+ cells under each condition, with data points from the same donor connected by lines. Pairwise Wilcoxon signed-rank tests with Benjamini-Hochberg correction for multiple comparisons. ∗∗p < 0.01, ∗∗p < 0.01, and ∗∗∗p < 0.001.
Figure 3
Figure 3
CD39+CD8+ T cell-enriched ccRCC tumors are characterized by higher TMB and enhanced hypoxic status (A) Proportions of CD39+ cells among CD8+ TILs across various cancer types: breast (n = 131), liver (n = 24), ovary (n = 17), stomach (n = 32), head and neck (n = 19), melanoma (n = 6), papillary RCC (n = 7), chromophobe RCC (n = 9), and ccRCC (n = 112). (B–F) WES data of 31 patients with RCC (ccRCC, n = 21; non-ccRCC, n = 10). (B) Summary of somatic mutation and copy-number variation of select genes, clinical information, and flow cytometry data. Bar plots at the top represent the TMB for each patient. The central heatmap displays the top 20 genes with the highest frequency of single-nucleotide variant (SNV) mutations across all samples, ordered by prevalence. Mutation types are color-coded based on SNV/INDEL categories and copy-number variations as indicated in the left. Clinical characteristics are shown directly beneath the mutation matrix. At the bottom, a heatmap represents flow cytometry-based immune profiling data. (C) Proportion of CD39+ cells among CD8+ TILs according to the histology of RCC. (D) Number of frameshift insertions and deletions (fsINDELs; left), and non-synonymous single-nucleotide variants (nsSNV) per megabase pair (right) according to the histology of RCC. (E) Number of nsSNV per megabase pair in ccRCC according to CD39 expression level on CD8+ TILs: CD39+ low (n = 10) and CD39+ high (n = 11). (F) Proportion of samples with SNV (left), copy-number loss (middle), and copy-number gain (right) in VHL gene according to the histology of RCC. (G and H) WTS data of 18 patients with RCC (ccRCC, n = 15; non-ccRCC, n = 3). (G) Heatmap showing gene set variation analysis (GSVA) scores for hypoxia-related gene sets in each patient, stratified by CD39+CD8+ T cell proportion (CD39+ low, n = 9 vs. CD39+ high, n = 9). Tumor stage and histology are annotated above the heatmap, as defined in (B). (H) Boxplots comparing GSVA scores for hypoxia-related gene sets between the two groups. (I) Expression of a hypoxic marker was assessed using Hypoxia Green Reagent, a dye that measures oxygen levels, by flow cytometry in CD39CD8+ TILs and CD39+CD8+ TILs (n = 8). The relative expression was calculated based on the mean fluorescence intensity. Data are represented as median with interquartile range; whiskers indicate the minimum and maximum values (A, C, D, E, and H). p < 0.05, ∗∗p < 0.01, ∗∗∗p < 0.001, and ∗∗∗∗p < 0.0001 by two-sided Mann-Whitney U test (A, C, D, E, and H) and Wilcoxon matched-pairs signed rank test (I).
Figure 4
Figure 4
CD39+CD8+ TILs exhibit CD39-dependent immunosuppressive activity (A) Proportions of each T cell subset among tumor-infiltrating CD39+CD45+ immune cells in ccRCC (n = 12). (B) Proportions of CD8+ TILs among tumor-infiltrating CD39+CD45+ immune cells across various cancer types: breast (n = 8), hepatocellular carcinoma (n = 11), ovary (n = 8), stomach (n = 8), head and neck (n = 10), melanoma (n = 6), chromophobe RCC (n = 9), papillary RCC (n = 5), and ccRCC (n = 12). (C) ATP concentrations were serially measured in culture medium after the indicated cells were cultured in the presence of exogenous ATP, with or without CD39 inhibitor (n = 6). (D) Relative proportions of IFN-γ+TNF+ cells among CD8+ PBMCs upon anti-CD3 stimulation (n = 8). CD8+ PBMCs were co-cultured with CD39+PD-1brightCD8+ TILs in the presence or absence of extracellular ATP (eATP) or a CD39 inhibitor (iCD39). (E) Relative proportions of IFN-γ+TNF+ cells among CD39PD-1brightCD8+ TILs upon anti-CD3 stimulation (n = 12). CD39PD-1brightCD8+ TILs were co-cultured with CD39+PD-1brightCD8+ TILs in the presence or absence of eATP or iCD39. (F–H) Cytokine production assay in a co-culture system, where TILs were reconstituted without a CD39 source from non-CD8+ TILs (n = 4). (F) Experimental schematic for reconstitution of TILs in which CD39 is expressed only among CD8+ TILs. (G) Proportions of IFN-γ+TNF+ cells upon anti-CD3 stimulation in each population. (H) Relative proportions of IFN-γ+TNF+ cells among CD39CD8+ TILs (left) and CD39CD4+ TILs (right) upon anti-CD3 stimulation in the presence or absence of eATP, iCD39, or iA2AR. (I) Relative proportions of IFN-γ+TNF+ cells among CD8+ TILs upon anti-CD3 stimulation with or without anti-PD-1-blocking antibody (aPD-1) and iA2AR (n = 18). Data are represented as median with interquartile range; whiskers indicate the minimum and maximum values (A, B, and G). Data are represented as mean ± SEM (C, D, E, and H). p < 0.05, ∗∗p < 0.01, ∗∗∗p < 0.001, and ∗∗∗∗p < 0.0001 by Mann-Whitney U test (A, B, D, E, G, and H), repeated measures ANOVA (C), and Wilcoxon matched-pairs signed-rank test (I).
Figure 5
Figure 5
Enrichment of CD39+CD8+ TILs predicts poor prognosis of patients with ccRCC (A) Experimental schematic of multiplex IHC (mIHC) staining of ccRCC tumors. (B) Representative images of mIHC staining for CD8 and CD39 in the tumor field. Scale bars, 200 μm. (C) Cancer-specific survival curves stratified according to the proportion of CD39+ cells among CD8+ TILs (n = 110). Patients were divided into low (n = 55) and high (n = 55) groups. p value was calculated by log rank test. (D) Count of CD8+ TILs (left) and proportion of CD39+ cells among CD8+ TILs (right), according to disease recurrence during follow-up. Non-recur, non-recurrence (n = 49); Recur, recurrence (n = 21). (E) ROC curve for predicting cancer-specific survival using the proportion of CD39+ cells among CD8+ TILs. A red asterisk marks the optimal threshold. (F) Forest plot of multivariate Cox regression analysis for cancer-specific survival (CSS) in patients with ccRCC. The group of CD8+ TILs was stratified by its median value. The group of CD39+ cells among CD8+ TILs was stratified using the optimal cutoff value identified in (E). HR, hazard ratio; CSS, cancer-specific survival; CI, confidence interval. Data are represented as median with interquartile range (D). ∗∗p < 0.01 by Mann-Whitney U test (D).
Figure 6
Figure 6
Enrichment of CD39+CD8+ TILs predicts favorable treatment responses to anti-PD-1 therapy (A–D) mIHC-based evaluation of the association between CD39+CD8+ TIL abundance and prognosis following anti-PD-1 therapy (n = 59). (A) Experimental schematic of mIHC staining in patients with metastatic ccRCC undergoing anti-PD-1 blockade after surgery. (B) Count of CD39+CD8+ TILs according to the objective response to anti-PD-1 blockade: PD (n = 23) or CR + PR + SD (n = 33). (C) Kaplan-Meier curve for progression-free survival (PFS) of patients with metastatic ccRCC undergoing anti-PD-1 blockade. p value was calculated using log rank test. (D) Forest plot of multivariate Cox regression analysis for PFS in patients with metastatic ccRCC undergoing anti-PD-1 blockade. (E–G) mIF-based evaluation of the association between CD39+CD8+ TIL abundance and prognosis following anti-PD-1 therapy in an independent cohort (n = 57). (E) Experimental schematic of mIF staining in patients with metastatic ccRCC undergoing anti-PD-1 blockade after surgery. (F) Count of CD39+CD8+ TILs according to the objective response to anti-PD-1 blockade: PD (n = 21) or CR + PR + SD (n = 36). (G) Kaplan-Meier curves for PFS (left) and overall survival (right) of patients with metastatic ccRCC undergoing anti-PD-1 blockade. p values were calculated using log rank test. (H and I) Gene set variation analysis (GSVA) scores for the CD39+ T cell signature in RNA-seq data of tissue samples from clinical trials of nivolumab (n = 29) (H) and everolimus (n = 27) (I) for IMDC-poor risk patients with ccRCC, according to clinical benefit. NCB, non-clinical benefit; ICB, intermediate clinical benefit; CB, clinical benefit. (J and K) Progression-free survival of patients with metastatic ccRCC undergoing nivolumab (n = 29) (J) and everolimus (n = 27) (J) in clinical trials, according to GSVA scores for the CD39+ T cell signature in IMDC-poor risk patients with ccRCC. p values were calculated by log rank test. Data are represented as median with interquartile range; whiskers indicate the minimum and maximum values (B, F, H, and I). p < 0.05 and ∗∗p < 0.01 by Mann-Whitney U test (B, I, and J).

References

    1. Jing X., Yang F., Shao C., Wei K., Xie M., Shen H., Shu Y. Role of hypoxia in cancer therapy by regulating the tumor microenvironment. Mol. Cancer. 2019;18:157. doi: 10.1186/s12943-019-1089-9. - DOI - PMC - PubMed
    1. Jayaprakash P., Vignali P.D.A., Delgoffe G.M., Curran M.A. Hypoxia Reduction Sensitizes Refractory Cancers to Immunotherapy. Annu. Rev. Med. 2022;73:251–265. doi: 10.1146/annurev-med-060619-022830. - DOI - PubMed
    1. McGettrick A.F., O'Neill L.A.J. The Role of HIF in Immunity and Inflammation. Cell Metab. 2020;32:524–536. doi: 10.1016/j.cmet.2020.08.002. - DOI - PubMed
    1. Wu Q., You L., Nepovimova E., Heger Z., Wu W., Kuca K., Adam V. Hypoxia-inducible factors: master regulators of hypoxic tumor immune escape. J. Hematol. Oncol. 2022;15:77. doi: 10.1186/s13045-022-01292-6. - DOI - PMC - PubMed
    1. Hsieh J.J., Purdue M.P., Signoretti S., Swanton C., Albiges L., Schmidinger M., Heng D.Y., Larkin J., Ficarra V. Renal cell carcinoma. Nat. Rev. Dis. Primers. 2017;3 doi: 10.1038/nrdp.2017.9. - DOI - PMC - PubMed

MeSH terms