. 2025 Sep-Oct;177(5):e70514.
doi: 10.1111/ppl.70514.

Genetic Insights Into Pathways Supporting Optimized Biological Nitrogen Fixation in Chickpea and Their Interaction With Disease Resistance Breeding

Affiliations

Genetic Insights Into Pathways Supporting Optimized Biological Nitrogen Fixation in Chickpea and Their Interaction With Disease Resistance Breeding

S L Bithell et al. Physiol Plant. 2025 Sep-Oct.

Abstract

In chickpea (Cicer arietinum), a globally important grain legume, improvements in yield stability are required to address food security and agricultural land loss. One approach is to improve both nutrient acquisition through symbiosis with rhizobial bacteria and biotic stress resistance. To support the simultaneous selection of multiple beneficial traits, we sought to identify quantitative trait loci (QTL) and genes linked to improved plant-microbe symbiosis both under symbiosis-promotive growth conditions and when pathogens are present. Our aims were to use the chickpea-Mesorhizobium rhizobial model to identify QTL associated with biological nitrogen fixation (BNF) and nutrient acquisition and understand factors promotive of sustained BNF under biotic stress through the impact of Phytophthora root rot (PRR) on BNF across chickpea genotypes on host gene expression. Using two chickpea × C. echinospermum recombinant inbred line (RIL) populations, we identified QTL associated with BNF and several associated with macro- and micro-nutrient status of chickpea. From within a set of the most PRR-resistant RIL (n = 70), we successfully identified RIL with both high PRR resistance and N sourced from BNF. In conditions of the tripartite (host:rhizobia:pathogen) interaction, while there was no consistent pathogen impact on the abundance of Mesorhizobium in nodules, PRR-resistant genotypes maintained a higher activity of their N-assimilation genes, while susceptible genotypes repressed these genes. This improved understanding of the genetic support of BNF in chickpea will allow selection for material that maintains higher BNF and is more disease resistant, which together may improve yield stability in chickpea.

Keywords: disease resistance; nitrogen fixation; quantitative trait loci identification.


Conflict of interest statement

The authors declare no conflicts of interest.

Figures
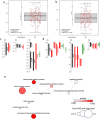
FIGURE 1
FIGURE 1
Chickpea genome exhibits specific quantitative trait loci (QTL) associated with nitrogen fixation and nodulation. Screening of nitrogen parameters, including (a) mean percentage nitrogen from fixation and (b) tissue nitrogen concentrations for PBA HatTrick and the recombinant inbred line (RIL) parents for the Yorker × C. echinospermum interspecific 9024 breeding line RIL. Means are based values from four replicates (n = 4). Error bars on PBA HatTrick and parents represent the standard error of the mean. (c) Position of quantitative trait loci (QTL) detected in Yorker × C. echinospermum backcross recombinant inbred line (RIL) population (black bars) for fixation and nutrient acquisition‐related trait. The vertical QTL bars represent the physical position (2 LOD drops from the QTL maximum likelihood value). Red colored bars represent the QTL identified for yield and phenology traits in this population by Bithell et al. (2024) and green bars represent the QTL identified for Phytophthora root rot resistance by Amalraj et al. (2019). (d) Position of quantitative trait loci (QTL) detected in Rupali × C. echinospermum backcross recombinant inbred line (RIL) population (black bars) for fixation and nutrient acquisition related trait. The vertical QTL bars represent the physical position (2 LOD drops from the QTL maximum likelihood value). Red colored bars represent the QTL identified for yield and phenology traits in this population by Bithell et al. (2024) and green bars represent the QTL identified for Phytophthora root rot resistance by Amalraj et al. (2019). (e) Gene ontology enrichment analysis for genes found within the QTL associated with N‐fixation. Nodes represent significantly enriched biological processes, with the size of the node proportional to the number of genes annotated with this term, color of nodes correlates to the p‐value of the enrichment, and the strength of association between nodes is annotated by the thickness of connecting lines.
FIGURE 2
FIGURE 2
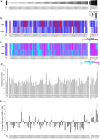
Genotype‐specific response in nitrogen fixation and nodulation exhibited by 70 recombinant inbred lines, RIL parents and eight check genotypes inoculated with M. ciceri in the presence and absence of P. medicaginis (+/−PRR). All genotypes are ordered as per their relative PRR susceptibility as denoted in (a), and are split into three sections: RIL parent genotypes, 70 RIL, eight check varieties; (b) percentage of N in chickpea shoot tips, (c) percentage of N derived from symbiosis in shoot tips, (d) nodules per gram of root (dry mass) in the absence of PRR (i.e., −PRR); (e) percent change in nodulation between +PRR and −PRR treatments. Treatments in a pot experiment with genotype means based on values from five replicates (n = 5), all bar charts plotted using standard error bars.
FIGURE 3
FIGURE 3
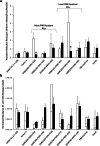
Chickpea lines show minimal impact of PRR on acetylene reduction and relative proportion of live M. ciceri in nodules. (a) Acetylene reduction by chickpea nodules and (b) normalized abundance of living M. ciceri in the nodules. White bars are the P. medicaginis absent (−PRR) condition and black bars are the P. medicaginis present (+PRR) * denotes a significant (p < 0.05) between the two treatments within a genotype with the Student's T‐test; n = 5.
FIGURE 4
FIGURE 4
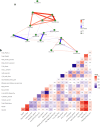
Relationships among plant growth and nitrogen‐related variables. (a) A correlation network showing significantly correlated variables. Each green node represents a variable and each edge indicates a statistically significant correlation (p < 0.05). Red edges denote positive correlations, while blue edges denote negative correlations, and the thickness and transparency of the edges reflect the absolute correlation strength. (b) Correlation matrix heatmap (lower triangle) shows the pairwise Pearson correlation coefficients of all the variables measured. The color scale indicates the correlation strength. Significance levels are indicated either by ** (p < 0.01) or * (p < 0.05).
FIGURE 5
FIGURE 5
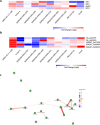
Chickpea PRR resistance level significantly correlated to N‐assimilation gene expression and indirectly correlated to N‐fixation. Change in expression of bacterial nitrogen fixation (a) and plant nitrogen assimilation‐related genes (n = 5); (b) in nodules of 10 chickpea genotypes is the presence of pathogen challenge (i.e., +PRR) compared to when it is absent (−PRR). Deeper blue coloration indicates a repression in gene expression during +PRR, while red indicates an increase in transcription under +PRR conditions (n = 5); (c) a correlation network illustrating significantly correlated variables (p < 0.05). Each green node corresponds to an individual variable, and each edge indicates a statistically significant correlation. Red edges denote positive correlations, whereas blue edges denote negative correlations. The thickness and transparency of each edge are scaled according to the absolute strength of the correlation. (c) Shows plant genes related to nitrogen metabolism, GOGAT = glutamate synthase, GS = glutamine synthetase.
FIGURE 6
FIGURE 6
Partial Mantel test showing how nitrogen‐related variables relate to the factors genotype and Phytophthora treatment. The partial Mantel's r statistic is represented by line width, and the color of the line indicates the statistical significance. In the upper triangle, each factor (Variety or Pathogen) is connected to the variables with Mantel lines, where line thickness reflects the Mantel's r (stronger associations are thicker) and line color corresponds to Mantel's p (e.g., orange for p < 0.01). Solid lines indicate positive associations, and dotted lines indicate negative associations. The lower triangle displays the Pearson correlation heatmap among the nitrogen‐related variables, with color intensity indicating correlation magnitude and asterisks denoting statistical significance (*** for p < 0.001, **p < 0.01, and * for p < 0.05).

References

    1. Abbo, S. , Redden R. J., and Yadav S. S.. 2007. “Utlization of Wild Relatives.” In Chickpea Breeding & Management, edited by Yadav S. S., Redden R. J., Chen W., and Sharma B., 338–354. CABI.
    1. Abi‐Ghanem, R. , Carpenter‐Boggs L., Smith J., and Vandemark G.. 2012. “Nitrogen Fixation by US and Middle Eastern Chickpeas With Commercial and Wild Middle Eastern Inocula.” International Scholarly Research Notices 5: 1–5.
    1. Alexa, A. , and Rahnenfuhrer J.. 2021. “topGO: Enrichment Analysis for Gene Ontology.” R Package Version 2.44.0.
    1. Aljabri, M. , and El‐Soda M.. 2024. “Genome‐Wide Association Mapping of Macronutrient Mineral Accumulation in Wheat (Triticum aestivum L.) Grain.” Plants 13: 3472. - PMC - PubMed
    1. Amalraj, A. , Baumann U., Hayes J. E., and Sutton T.. 2024. “Using RNA Sequencing to Unravel Molecular Changes Underlying the Defense Response in Chickpea Induced by Phytophthora medicaginis .” Physiologia Plantarum 176: e14412. - PubMed

LinkOut - more resources