. 2025 Sep 17;16(1):8287.
doi: 10.1038/s41467-025-63979-x.

RBM39 degrader invigorates innate immunity to eradicate neuroblastoma despite cancer cell plasticity

Affiliations

RBM39 degrader invigorates innate immunity to eradicate neuroblastoma despite cancer cell plasticity

Shivendra Singh et al. Nat Commun. .

Abstract

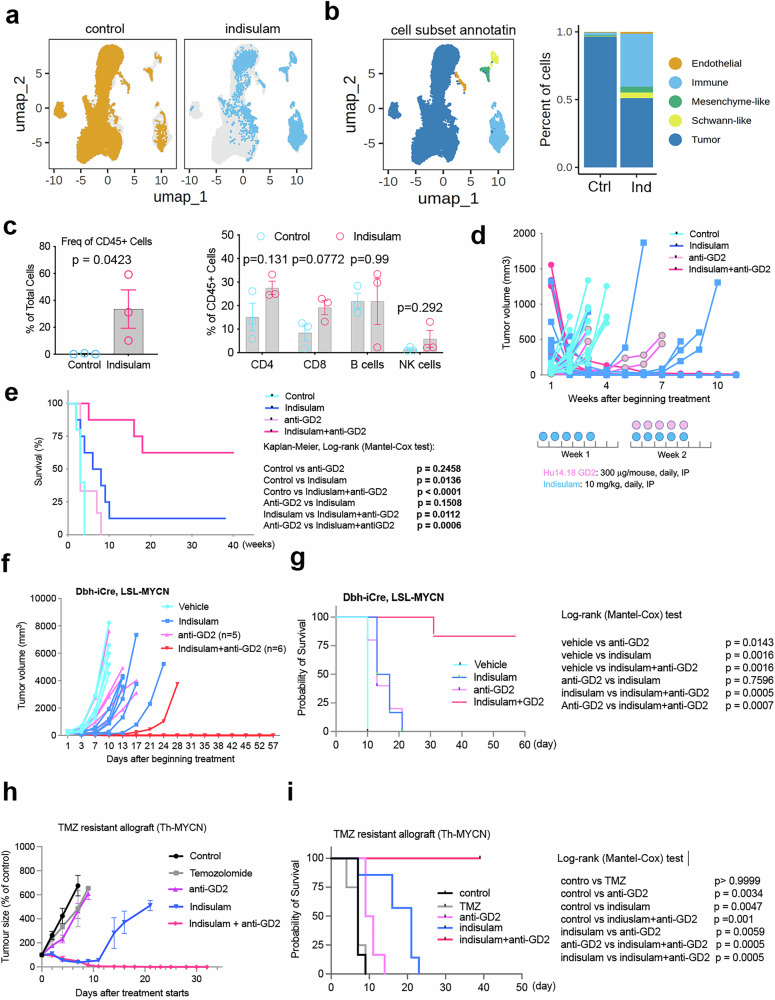
The cellular plasticity of neuroblastoma is defined by a mixture of two major cell states, adrenergic and mesenchymal, which may contribute to therapy resistance. However, how neuroblastoma cells switch cellular states during therapy remains largely unknown, and how to eradicate neuroblastoma regardless of its cell state is a clinical challenge. To better understand the cellular plasticity of neuroblastoma in chemoresistance, we define the transcriptomic and epigenetic map of adrenergic and mesenchymal types of neuroblastomas using human and murine models treated with indisulam, a selective RBM39 degrader. We show that cancer cells not only undergo a bidirectional switch between adrenergic and mesenchymal states, but also acquire additional cellular states, reminiscent of the developmental pliancy of neural crest cells. These cell state alterations are coupled with epigenetic reprogramming and dependency switching of cell state-specific transcription factors, epigenetic modifiers, and targetable kinases. Through targeting RNA splicing, indisulam induces an inflammatory tumor microenvironment and enhances the anticancer activity of natural killer cells. The combination of indisulam with anti-GD2 immunotherapy results in a durable, complete response in high-risk transgenic neuroblastoma models, providing an innovative, rational therapeutic approach to eradicate tumor cells regardless of their potential to switch cell states.


Conflict of interest statement

Competing interests: Jun Yang is a subject Editor of the British Journal of Cancer. Other authors declare no competing interests.

Figures

Fig. 1
Fig. 1. Indisulam resistance in transgenic MYCN/ALKF1178L mouse models is associated with lineage switch to cell states with MES and Schwan precursor cells.
a Tumor growth curve for MYCN/ALKF1178L mice treated with 25 mg/kg of indisulam. Blue indicates sustained complete response (biological replicates n = 3). Pink indicates indisulam resistance and relapse (biological replicates n = 2). b Ultrasound imaging of tumor relapse. Top panel shows the two-dimensional ultrasound images over time and the bottom panel shows the volume reconstructions. c GSEA plot analysis of naïve (biological replicates n = 2) vs relapsed tumors (biological replicates n = 2). The normalized RNA read counts are transformed to log2 counts per million reads (log2CPM) for GSEA analysis. Right y-axis =one-sided, nominal p-values. Left y-axis = false discovery rate (FDR) q values. X-axis = normalized enrichment score (NES). d GSEA shows “20q11 amplicon” gene set upregulated in indisulam-resistant tumors. Nominal p-value < 0.0001 calculated by one-sided Fisher’s exact test. e The normalized RNA-seq reads at Rbm39 gene locus by IGV program. f Western blot analysis for vehicle-treated tumors (biological replicates n = 3) and indisulam-resistant tumors (biological replicates n = 2). The experiment was done once. g Pearson correlation between gene copy number vs indisulam response from DepMAP data (www.depmap.org). p-value (left y-axis, two-sided) calculated using t-distribution based on the Pearson correlation coefficient (x-axis). The z-score calculated by permutation test. h Pearson correlation between gene expression vs indisulam response from DepMAP data (www.depmap.org). The p value is calculated using two-sided t-distribution. Y-axis = expression of RBM39 with log2TMP plus 1 (TPM + 1). X-axis = log2 fold change of indisulam in cell viability measurement. GSEA shows “neural stem cell” (i) and “NBL_MES” (j) gene sets significantly upregulated in resistant tumors. Nominal p value < 0.0001 calculated by one-sided Fisher’s exact test. k Heatmap shows the expression of Schwan cell progenitor (SCP) markers in naïve (biological replicates n = 2) vs. relapsed tumors (biological replicates n = 2). The Morpheus program is used to generate z-score-based interactive heatmap after log2-transformed expression data. l Sox10 labels the SCP cell population from the study. Source data are provided as a Source Data file.
Fig. 2
Fig. 2. Indisulam resistance is associated with cell state switch from ADRN to MES and melanocytic state in human MYCN-amplified neuroblastomas.
a Individual tumor volume for SJNB14 PDXs implanted in CB17/SCID mice undergoing repeated cycles (2 weeks as one cycle) of treatment with vehicle (n = 5) and 25 mg/kg indisulam (n = 5), 5 days on, two ways off. Note: relapsed tumors after the 4th cycle were re-implanted to new mice before the 5th cycle treatment due to the aging of the primary mice. GSEA shows the ADRN (b) and hypoxia (c) gene signatures are significantly downregulated in resistant tumors vs. naïve tumors, while the interferon (d) gene signature is significantly upregulated. Nominal p-values are calculated by one-sided Fisher’s exact test. e Heatmap showing that the expression changes of melanocytic markers, Wnt ligands, MES, and ADRN transcriptional factors in naïve (biological replicates n = 2) vs. resistant tumors (biological replicates n = 2). The z-score-based heatmap after log2-transformed expression is generated by using the SRplot program. f The expression of melanocytic markers and Wnt ligands in a human neuroblastoma cohort (TARGET study). The expression scale bar indicates z-score based heatmap after log2-transformed expression. g Log2 transformed RBM39 expression from normalized RNA-seq in naïve vs. resistant SJNB14 tumors (biological replicates n = 2). h Volcano plot shows the differential peaks of H3K27Ac in naïve vs. resistant tumors by CUT&Tag analysis. Y-axis = −log10 transformed p values, x-axis = log2 transformed fold changes. P-value is calculated by the Benjamini-Hochberg method. i IGV plots show the peak changes of at the loci of TWIST1, PHOX2B, and S100B. j GSEA shows the upregulation of H3K27Ac at the genomic loci of MES TFs. Nominal p-values are calculated by one-sided Fisher’s exact test. k GSEA shows the downregulation of H3K27Ac at the genomic loci of ADRN signature genes. Nominal p-values is calculated by one-sided Fisher’s exact test. Source data are provided as a Source Data file.
Fig. 3
Fig. 3. Indisulam resistance is associated with RBM39 upregulation and cell state switch from MES to ADRN in a C-MYC-overactive xenograft model.
a GSEA analysis of naïve (biological replicates n = 3) vs. relapsed tumors (biological replicates n = 3). Right y-axis indicates nominal p values (one-sided) and left y-axis indicates false discovery rate (FDR) q-values (one-sided with Benjamini-Hochberg method), and normalized enrichment score (NES) (x-axis). b-e GSEA shows “ADRN” and “neuronal system” gene sets. Nominal p values are calculated by one-sided Fisher’s exact test. f RBM39 and RBM23 expression in naïve (biological replicates n = 3) vs. resistant (biological replicates n = 3) SK-N-AS tumors. p values are calculated by two-sided Student t-test. g Volcano plot for differential peaks of ATAC-seq on or at nearby genes in resistant (biological replicates n = 4) vs naïve tumors (biological replicates n = 2). Y-axis = p values (two-sided, corrected by Benjamini-Hochberg method) transformed by -log10. X-axis = fold changes transformed by log2. Red =ADRN genes, Blue = MES genes. h Volcano plot for differential binding motifs of transcriptional factors. Y-axis indicates p values (two-proportion z-test) transformed by -log10 while x-axis indicates the fold changes of delta MD score. i Heatmap showing the motif displacement (MD) distribution of NFIA, ASCL1, SP2 and FOSL2, MD-score, and the number of this motif within 1.5 kb of an ATAC-seq peak naïve vs resistant tumors. j Volcano plot for differential peaks of H3K27Ac in naïve vs resistant tumors by CUT&Tag analysis. P value is two-sided, corrected by the Benjamini-Hochberg method. k GSEA analysis for genes with differential peaks of H3K27Ac in resistant (biological replicates n = 4) vs. naïve (biological replicates n = 2) tumors by CUT&Tag analysis. Blue indicates nominal P values (one-sided) and pink indicates false discovery rate (FDR) q values (two-sided, corrected by Benjamini-Hochberg method). l Heatmap indicates the binding motifs for transcriptional factors enriched in naïve, resistant and both based on Homer Motif analysis of H3K27Ac peaks. m IGV snapshots displaying the peaks in naïve vs resistant SK-N-AS cells by H3K27Ac CUT&Tag and ATAC-seq at RBM39 and RBM23 genomic loci. Source data are provided as a Source Data file.
Fig. 4
Fig. 4. Cell state alterations are coupled with a switch of dependency on epigenetics and lineage–specific transcription factors.
a Focused CRISPR library screening procedure using SK-N-AS cell lines derived from naïve and indisulam-resistant SK-N-AS tumor cells cultured for 3 weeks in the presence of absence of 250 nM of indisulam. b Dependency genes related to pre-mRNA splicing in naïve and resistant SK-N-AS cells with or without 250 nM of indisulam culture. c Ranked dependency genes encode transcriptional factors in naïve and resistant SK-N-AS cells with or without 250 nM of indisulam culture. Blue indicates MES TFs, and pink indicates ADRN TFs. P values (two-sided) generated by the MAGeCK-VISPR method. df Normalized counts of gRNAs for CDK9, PHOX2B and TBX2 in naïve and resistant SK-N-AS cells with or without 250 nM of indisulam culture (biological replicates, n = 4). p value calculated by the two-sided MAGeCK method. g Protein interaction network analysis (STRING: https://string-db.org) of epigenetic regulators that are selectively essential to naïve or indisulam-resistant tumors. h, i Normalized counts of gRNAs for PHF12 and ARID4B in naïve and resistant SK-N-AS cells with or without 250 nM of indisulam culture (biological replicates, n = 6). p-value calculated by the two-sided MAGeCK method. Source data are provided as a Source Data file.
Fig. 5
Fig. 5. CRISPR identification of targetable essential kinases leads to a more effective combination therapy consisting of indisulam and an ATR inhibitor.
a Human Kinase CRISPR library screening using SK-N-AS cell lines derived from naïve tumors and indisulam-resistant tumors in the presence of absence of 250 nM of indisulam. b Venn diagram showing the shared and cell-type-specific essential kinases. c Kaplan-Meier survival for SK-N-AS tumors treated with vehicle (n = 5), indisulam (n = 5), gartisertib (n = 5), or combination (n = 5). Indisulam is administered with 10 mg/kg, 5 days on, 2 days off, for 3 weeks, with an additional two weeks when tumors relapse with indisulam alone treatment. Gartisertib is administered with 10 mg/kg, once weekly. **p = 0.02, which is calculated by the Log-rank (Mantel-Cox) test. d Body weight monitoring over time for each individual mouse. Source data are provided as a Source Data file.
Fig. 6
Fig. 6. Cell state switch induced by indisulam treatment can lead to upregulation of GD2 expression through epigenetic reprogramming.
a Cartoon depicts the GD2 synthesis and related key enzymes. Cer, ceramide, N-acylsphingosine; Glc, glucose; Gal, galactose; GalNac, N-acetylgalactosamine; Neu5Ac, N-acetyl neuraminic acid. be Expression of the two key enzymes in GD2 synthesis in 4 different neuroblastoma models. P values are calculated by two-sided, Student t-test when biological replicates n = 3. f, g Snapshots of H3K27Ac CUT&Tag and ATAC-seq at B4GALNT1 and ST8SIA1 genomic loci using the IGV program, displaying the peaks in naïve vs resistant SK-N-AS cells. h Flow cytometry analysis of GD2 expression in naïve and indisulam-resistant SK-N-AS cells. Left, isotype IgG as control; right, anti-GD2 intensities. The experiment was done once. Source data are provided as a Source Data file.
Fig. 7
Fig. 7. Potent efficacy of indisulam in NK cell competent mice.
a Tumors derived from C-MYC transgenic neuroblastoma model implanted into immunodeficient NSG mice, T and B cell-deficient Rag2-/- mice and immune competent C57BL6 mice, with indicated therapeutic schedules. Graph generated by Biorender (www.biorender.com). b Individual tumor volume for each group treated with indisulam. NSG (n = 8), Rag2-/- (n = 7), C57BL/6 (n = 6). c Kaplan-Meier survival curve for each group of mice treated with indisulam, with indicated p values for comparisons of each group. P value is calculated by Log-rank (Mantel-Cox) test. d Individual tumor volume for SK-N-AS xenografts implanted into Rag2-/- mice treated with vehicle (n = 6). e Individual tumor volume for SK-N-AS xenografts implanted into Rag2-/- mice treated with 25 mg/kg of indisulam (n = 6), for 5 days on and two days off for two weeks, indicted by the blue arrow. f Percentage of IFNγ-producing NK cells in c-MYC tumors treated with vehicle (n = 3) and indisulam (n = 3) for 3 days, analyzed by flow cytometry. Data are presented as Mean +/- SEM. P value is calculated by two-sided, unpaired Student t-test. g Schematic diagram shows the co-culture of NK92 and SK-N-AS cells in a ratio of 3:1 with or without a 24-hour pretreatment with 150 nM of indisulam. The live SK-N-AS cells are pre-stained by Incucyte Caspase-3/7 Green before mixed with NK92 cells. The release of the DNA dye and fluorescent staining of the nuclear DNA serves as the indicator of apoptosis. h Real-time quantification of apoptosis of SK-N-AS cells measured by the Incucyte Caspase-3/7 Green. The y-axis indicates the caspase-3/7 activity (apoptosis) while the x-axis indicates the elapsed time of co-culture of NK92 and SK-N-AS cells (n = 4 per group). Data are presented as Mean +/- SEM. P values calculated by two-sided, Student t-test for pairwise comparisons at the 12 h timepoint. ***p < 0.0001. i Kaplan-Meier survival for neuroblastoma patients with high and low expression of NCR1 gene in SEQC cohort (GSE62564). P value calculated by Log-rank (Mantel-Cox) test. Source data are provided as a Source Data file.
Fig. 8
Fig. 8. Potent efficacy of indisulam in combination with anti-GD2 in immune competent mice.
a Uniform Manifold Approximation and Projection (UMAP) of integrated scRNA-seq data from controls (n = 2) and indisulam-treated (n = 1) samples from the Th-MYCN/ALKF1178L models. b UMAP highlights the major cell types (left) and the bar plot shows the proportions of different cell types in control and indisulam samples (right). c Left shows the percentage of immune cells (CD45) in tumors treated with vehicle (n = 3) and indisulam (n = 3) for 5 days, analyzed by flow cytometry. Right shows the percentage of different types of immune cells in tumors treated with vehicle and indisulam for 5 days, analyzed by flow cytometry. Data are presented as Mean +/− SEM. P value calculated with two-sided, unpaired t test. d Individual tumor volume for each group treated with vehicle (n = 11), indisulam (n = 8), anti-GD2 (n = 6), combination (n = 8). Th-MYCN/ALKF1178L mice were treated with the indicated doses and schedule. e The Kaplan-Meier survival for transgenic MYCN/ALKF1178L mice treated with vehicle, anti-GD2, indisulam, combination as shown in (d), with indicated p values (log-rank test) for comparisons of each group. f Individual Dbh-iCre;LSL-MYCN tumor volume treated with vehicle (n = 5), indisulam (n = 5), anti-GD2 (n = 5), combination (n = 5). The Dbh-iCre;LSL-MYCN syngeneic mice treated with 100 mg/kg of indisulam via tail vein injection, every 4 days with a total of 4 doses. The anti-GD2 mAb (300 μg/mouse) is given on the next day after indisulam treatment. g Kaplan-Meier survival for the Dbh-iCre; LSL-MYCN syngeneic mice as shown in (f), with indicated p values (log-rank test) for comparisons of each group. h Individual Th-MYCN tumor volume treated with vehicle (n = 6), temozolomide (TMZ, n = 4), indisulam (n = 6), anti-GD2 (n = 6), combination of indisulam and anti-GD2 (n = 6). The TMZ-resistant Th-MYCN syngeneic mice were treated with indisulam as d (10 mg/kg, 5 days on and 2 days off for 2 weeks), and anti-GD2 (15 μg/mouse, on day 1 and day 5), TMZ (6 mk/kg for 5 days). Data are presented as Mean +/− SEM. i Kaplan-Meier survival for the Th-MYCN syngeneic mice as shown in (h), with indicated p-values (log-rank test) for comparisons of each group. Source data are provided as a Source Data file.
Fig. 9
Fig. 9. Models for neuroblastoma cell plasticity and the working mechanism of indisulam.
a Schwann cell precursors from neural crest cells could differentiate to distinct lineages, including neuroblasts and chromaffin cells that are presumed to be cells of origin of neuroblastoma. NCC, neural crest cell. SCP, Schwann cell precursors. b Neuroblastoma cells have multiple cell states that are potentially able to interconvert. These cell states are determined by lineage–specific master TFs or CRC TFs. ADRN, adrenergic. MES, mesenchymal. Melano, melanocytic. c The mechanism of action of indisulam. d The anticancer mechanism for the combination of indisulam with anti-GD2 immunotherapy. Indisulam degrades RBM39 in neuroblastoma cells, leading to cell death due to splicing defects (top). Indisulam also directly activates NK cells, leading to NK cell-mediated killing (middle). At the same time, indisulam induced an inflamed state of neuroblastoma cells, causing immune cell infiltration. When GD2 immunotherapy is applied, NK cells elicit antibody-dependent cellular cytotoxicity (ADCC) to kill neuroblastoma cells (bottom). All three mechanisms together lead to a durable complete response.

Update of

References

    1. Jones, D. T. W. et al. Molecular characteristics and therapeutic vulnerabilities across paediatric solid tumours. Nat. Rev. Cancer19, 420–438 (2019). - PubMed
    1. Sweet-Cordero, E. A. & Biegel, J. A. The genomic landscape of pediatric cancers: Implications for diagnosis and treatment. Science363, 1170–1175 (2019). - PMC - PubMed
    1. Wierdl, M. et al. Targeting ALK in pediatric RMS does not induce antitumor activity in vivo. Cancer Chemother. Pharm.82, 251–263 (2018). - PMC - PubMed
    1. Li, S. Q. et al. Targeting wild-type and mutationally activated FGFR4 in rhabdomyosarcoma with the inhibitor ponatinib (AP24534). PLoS One8, e76551 (2013). - PMC - PubMed
    1. Miklja, Z. et al. Everolimus improves the efficacy of dasatinib in PDGFRalpha-driven glioma. J. Clin. Invest.130, 5313–5325 (2020). - PMC - PubMed

MeSH terms

Substances

LinkOut - more resources