. 2025 Sep 18;10(1):311.
doi: 10.1038/s41392-025-02411-8.

Reversion of aortic valve cells calcification by activation of Notch signalling via histone acetylation induction

Affiliations

Reversion of aortic valve cells calcification by activation of Notch signalling via histone acetylation induction

Gloria Garoffolo et al. Signal Transduct Target Ther. .

Abstract

Calcification of the aortic valve is a prevalent cardiovascular pathology in the aging population. Traditionally linked to inflammation, lipid accumulation, and risk conditions, this disease remains poorly understood, and effective treatments to halt its progression are not yet available. We hypothesized that calcification of the human valve interstitial cells (VICs) is associated with cellular senescence and alterations in the epigenetic setup, like in arteries. To verify this hypothesis, we examined the epigenetic marks (DNA methylation; Histones H3/H4 acetylation/methylation), the senescence and the calcification process in human VICs obtained from two distinct pathologic settings of the aortic valve (valve insufficiency and valve stenosis), and employed a mouse model of vascular/valve calcification, based on the administration of Vitamin D. Our findings revealed a link between the senescent phenotype of human VICs and calcification, characterized by increased DNA methylation and changes in histone epigenetic marks. To reverse the senescent/calcific VICs phenotype, we used Pentadecylidenemalonate-1b (SPV106), which activates KAT2B/pCAF histone acetyltransferase. In human VICs, SPV106 restored Histone acetylation marks, modified general chromatin accessibility and upregulated expression of Notch1, a potent inhibitor of valve calcification. The treatment also prevented the accumulation of calcific lesions in an ex vivo model of aortic valve calcification. In vivo treatment with SPV106 reduced calcification of the valve induced by administering Vitamin-D and positively preserved the valve motion compromised by calcification and the overall cardiac function. Based on these results, we propose the treatment with activators of histone acetylates as a viable option to prevent senescence/calcification of aortic VICs via restoration of correct chromatin acetylation, with concrete hopes to retard the progression of valve stenosis, a still largely unmet therapeutic need.


Conflict of interest statement

Competing interests: The authors declare no competing interests.

Figures

Fig. 1
Fig. 1
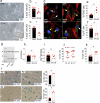
Assessment of aortic valve senescence and calcification in the region of the aortic valve (Ao-V) in control (a) and vitamin D-treated mice (b) by von Kossa staining and p21 immunohistochemistry. It is evident in panel b the presence of large calcifications in the aortic wall (Ao-W) and on the leaflets (Le), especially at the level of the commissures (Co). Note in panel (b) the presence of p21+ cells in the areas containing calcifications. c Quantification of nuclear-localized p21in the leaflets of vehicle and Vitamin D injected mice, as performed by image J. The nuclear staining of p21 was separated from the nuclear staining of Haematoxylin and quantified as number of p21+ nuclei in the leaflets (Le). Data are graphed as mean ± SE (individual data are represented by red circles), and statistically compared by unpaired t-test
Fig. 2
Fig. 2
Comparison of replicative senescence in iVICs vs. sVICs as demonstrated by the increase in the doubling time between p1 and p2 (a) and β-Gal staining cells at passage numbers (p) between 3 and 6 (bd). e sVICs also had an increased calcification potential compared to iVICs as determined by the assessment of intracellular calcium (normalized to cellular protein content), when cultured in a medium containing high calcium levels (cells all at p4). f, g Analysis of global DNA methylation/hydroxy-methylation in the two cell types showed an increased amount of methylated DNA (f) but not of 5’-hydroxymethylcytosine (g) (both expressed as percentage of total DNA) in sVICs compared to iVICs. h, i The methylation level of the C5 and C7 in ELOVL2 promoter CpG islands was assessed by pyrosequencing after bisulfite conversion indicating a higher heterogeneity in iVICs vs. sVICs. j, k Linear regression analysis of the C5/C7 methylation ELOVL2 promoter sequences in VICs from insufficient compared to stenotic valves (r2 and P values of the two regression analyses are indicated in each plot). lp Differences in the specific levels of selected Histones H3 and H4 methylation/acetylation marks in iVICS and sVICs, as detected by in-cell western analysis (representative images in insets). In each panel it is represented the quantification of each Histone modification normalized to the nuclear fluorescence intensity detected by DRAQ5 staining and representative images of the cells stained with each of the antibodies and DRAQ5 nuclear stain in the analysed culture wells. q Pathway-specific transcriptome arrays were used to assess the differential expression of transcripts involved in senescence, chromatin-remodelling and epigenetic regulation in iVIC and sVICs. The heatmap represents the results of an unsupervised clustering analysis of the differentially expressed mRNAs (genes listed in Supplementary Table 2). In all graphs, data are graphed as mean and SE (individual data are represented by red circles). Data were statistically compared by unpaired t-tests in plots (a, e, f, g, lp), and * indicate P < 0.05. Data in (b) were compared by 2-way ANOVA, using a Bonferroni post-hoc analysis of the comparison between sVICs and iVICs senescence at the indicated passage numbers (* indicate P < 0.05 in the post-hoc). Data in (h) and (i) were analysed with F-tests to assess the variance of the biological age in sVICs and iVICs (* indicate P < 0.05). Data in panels (j) and (k) are individually represented as pairs of % methylation for C5 and C7 hotspots in insufficient and stenotic VICs. In each plot, the areas in colour indicate the 95% confidence intervals of the best-fit data interpolation (dotted straight line). The n of biological replicates is represented by the number of dots overlapped to each of the histogram plots, each indicating an individual cell donor
Fig. 3
Fig. 3
Treatment with SPV106 reduces senescence and calcification of sVICs mediated by Histone acetylation. a Reduction of β-Gal in cells treated for 7days with SPV106. Control treatment was performed using the same dilution of DMSO (the diluent of SPV106). b, c Quantification of the β-Gal+ cells treated and untreated with SPV106 under normal (NC) or high calcium (HC) concentrations: in both cases the epigenetic drug reduced the level of cellular senescence. d PCNA (top) and p16 (bottom) immunofluorescence in DMSO and SPV106-treated sVICs. White and yellow arrows indicate, respectively, cells with cytoplasmic or nuclear localization of the two markers. Note the variation in the localization of the two antigens in control vs. SPV106-treated cells. Red fluorescence in all panel represents stress fibres as detected by phalloidin-TRITC staining. e, f Quantification of results indicated the effect of SPV106 in increasing the percentage of cells in active phases of the cell cycle (PCNA+) and a reduction of the nuclear expression of the senescence marker (p16+). g, h Western analysis and relative quantification of p21 senescence markers expression in DMSO and SPV106-treated cells. i Assessment of the sVICs normalized calcium concentration when cultured in the presence of calcification medium, showed a significant reduction in the presence of SPV106. j The effects of SPV106 on reduction of sVICs senescence was maintained for two passages (p5 → p6 and p6 → p7) after withdrawal of the drug. k Treatment of iVICs with Garcinol, an inhibitor of HAT, determined a significant elevation of the β-Gal+ cells in the culture, confirming the importance of histone acetylation activity for senescence process in human VICs. l Similar effects were obtained using ITSA, an HDAC activator. Interestingly, the effect of the drug was more potent on iVICs (graph on the bottom) than in sVICs (graph on the top). In all graphs, data are represented as mean ± SE. * indicate P < 0.05 by paired t-test. The n of biological replicates is represented by the number of dots overlapped to each of the histogram plots, each indicating an individual cell donor
Fig. 4
Fig. 4
Variation in the expression of epigenetic regulators in response to treatment of sVICs with SPV106. a Heatmap from an unsupervised clustering analysis of the genes significantly modulated by SPV106 in sVICs (gene listed in Supplementary Table 3) showing extensive expression changing of transcripts encoding for epigenetic modulatory and chromatin-associated factors caused by the drug. b, c Expression of Notch1 and the key genes (Runx2/Sox9) controlled by Notch pathway in sVICs (±SPV106 treatment, (b) and in sVICs vs. iVICs (c). In stenotic VICs, (black bars), high levels of Runx2 pro-osteogenic transcription factor correlated with low levels of Notch1 and Sox9, while in iVICs (white bars) the situation was opposite, with elevated expression levels of Notch1/Sox9 and low levels of Runx2 transcripts. Treatment of sVICs with SPV106 reverted the expression of these genes at a level similar to that observed in iVICs, consistent with a lower propensity to calcify. d, e The decrease of Runx2 by SPV106 was in effect also at a protein level as shown by Western analysis and the relative quantification. f Sox9 upregulation was also observed at protein level with an increase in nuclear localization, as quantified by integration of nuclear fluorescence (see graphs overlapped to individual nuclei). g SPV106 increases the overall level of lysine acetylation in chromatin and of NICD in the nuclei of the treated sVICs. The images on the top of the panel show the high resolution confocal microscopy images of the cells stained with anti-pan-acetyl-Lysine (red fluorescence) or anti-NICD (green fluorescence) antibodies (plus DAPI – blue fluorescence – as a staining of the nuclei), and the fluorescence profile of a typical control (top right) or SPV106-treated cell (bottom right; note the difference in the red and green fluorescence intensity in the CTRL vs. SPV106-treated cells). h, i Quantification of the fluorescence data, from which it emerges a positive effect of SPV106 on increase in acetylation of nuclear proteins and NICD nuclear accumulation. In all graphs data are represented as mean ± SE. * indicate P < 0.05 by paired t-test. The n of biological replicates is represented by the number of dots overlapped to each of the histogram plots, each indicating an individual cell donor
Fig. 5
Fig. 5
SPV106 restores at least in part the Histones H3/H4 epigenetic setup in sVICs. Panels ae show the levels of each histones H3/H4 modifications (normalized to the total cell number by DRAQ5 nuclear staining) in control sVICs and sVICs treated with SPV106, as detected by in-cell Western analysis. With the exception of the tri-methylation on the Lysine 27 on histone H3, SPV106 increased the histones H3/H4 acetylation and the tri-methylation on Lysine 20 on histone H3. f Heatmap representing the unsupervised clusterization of the genes with more open (red) or more closed (green) chromatin emerging from ATACseq of DMSO or SPV106-treated sVICs (normalized data in Online XLS file c and category of genomic sequences described in Supplementary Fig 11). g, h Bubble plot representation of Reactome Pathways encompassing genes with more open or more closed chromatin configuration, and therefore potentially more transcriptionally active or repressed, respectively. Pathways are vertically represented in order of decreasing significance (-Log P-value indicated along the x axis) and bubbles dimension is proportional to the amount (%) of the genes represented in each pathway with the indicated functional annotation. Note in (g) (encircled) the presence of 5 pathways with more open chromatin configuration related to Notch signalling. i Graphic representation of the reads distribution in the region of the Notch1 and Sox9 promoters as detected by ATACseq. Note the presence of peaks with a higher number of reads in the region close to the transcription start site (TSS) in a representative distribution in chromatin from DMSO vs. SPV106-treated cells. j Chromatin immunoprecipitation was performed using antibodies specific for human H4K16Ac or H4K20(me)3 followed by qPCR. The representation on the left shows the positioning of the primers on the Notch1, Sox9 and Runx2 gene promoters at -1000bp upstream of the TSS. The graph on the right shows the quantification and the statistical analysis of the enrichment experiment by qPCR. From these results, it is possible to conclude that H4K16Ac (but not H4K20me(3)) modification determines a significant increase of the chromatin accessibility in the Notch1 and Sox9 promoter, justifying the increased expression observed in SPV106-treated cells. The dotted bar in the graph indicates the relative enrichment of the chromatin in DMSO-treated cells equalized to 1 for a comparison with the level observed in SPV106-treated cells, represented by the bars in the histogram plots. k The activity of the Notch pathway in rescuing the senescent phenotype of sVICs was validated using DAPT, a specific inhibitor. As shown, DAPT inhibited the effect of SPV106 when added to cells in combination. l, m The treatment with SPV106 was finally validated by monitoring the transcriptional effect on Notch-reported transcriptional targets HES-5, HES-1, HEY-1 and MYC, as well as on secretion of SASP cytokines. In all graphs data are represented as mean ± SE. * indicate P < 0.05 by paired t-test. The n of biological replicates is represented by the number of dots overlapped to the histogram plots, each indicating an individual cell donor
Fig. 6
Fig. 6
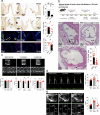
a Representative pictures of Alizarin Red, alkaline phosphatase (ALP) and Runx1/2/3 staining of mouse aortic valves cultured for one week in the MTCS under calcifying conditions in the presence of SPV106 or DMSO (control) showing the significant reduction in the number of calcified valves, the ALP-positive area and the percentage of RUNX1/2/3-expressing cells with SPV106 treatment. As shown in the bar graphs on the right, treatment with SPV106 reduced significantly the number of calcified valves and the percentage of cells expressing calcification markers compared to controls. Please refer to Supplementary Fig. 15 for a high magnification and an immunophenotype staining of cells of the valve region represented in the top left panel. b On the top of the panel the experimental scheme adopted to administer SPV106 to mice receiving high doses of Vitamin D is represented. After the initial administration of the Vit-D for three days, the mice were injected intraperitoneally with vehicle (DMSO) or SPV106 for three day before echo analyses and sacrifice (this image was realized with Biorender licensed to Centro Cardiologico Monzino, IRCCS). In the lower part of the panel are represented images of von Kossa staining of the aortic valves of the mice, in which it is evident the presence of large calcifications in the areas of the aortic wall (Ao-W) and the leaftets (Le), as indicated by arrows. SPV106 treated samples were free of large lesions, indicating the ability of the drug to reduce calcification. Quantification of the anti-calcific effect of SPV106 expressed as % of calcification areas in the control vs. treatment groups. c Echocardiogram sequences showing the opening/closing cycles of the heart in the Mock-treated, Vit-D/DMSO and Vit-D/SPV106 treated mice. As shown from the analysis of the aortic cusps separation (ACS) and the ejection fraction (EF), treatment with the drug reverted the detrimental effects of Vitamin D on valve motion and the overall function. Note in the histogram on the right that administration of the epigenetic drug prevented deterioration of the cardiac function as assessed by the pre- vs. the post-treatment indicated by the black and the open bars, respectively. d Analysis of time to peak (Tp), the time necessary to reach the max transvalvular flow at valve opening confirmed the restoration of valve motion by SPV106 compared to Vit-D/DMSO treatment. e Analysis of the echocardiographic aortic back scatter (AVBS) using a parasternal long-axis view. The valves are captured at diastole (valve closed). Note the difference between the echo sound in the MOCK and the Vit-D/SPV106-treated vs. the Vit-D/DMSO-treated animals. The AVBS quantification graph shows that treatment with SPV106 reduced valve calcification. * indicate P < 0.05 by Fisher exact test, unpaired/paired t-test or 1-way Anova with Bonferroni post-hoc. The n of biological replicates is represented by the number of dots overlapped to the histogram plots, each indicating an individual heart/animal
Fig. 7
Fig. 7
Proposed model of epigenetic-controlled senescence/calcification program of valve interstitial cells. The data presented in this study suggest that calcification of the aortic valve is associated to senescence of VICs due to decrease in histone acetylation and increase in histone methylation in chromatin. This situation can be reverted by SPV106, a drug with a genome-wide ability to restore histone acetylation, through upregulation of Notch-1 signalling and repression of osteogenic master genes (i.e. Runx-2). Other than inhibiting calcification, treatment with the drug also reduced the senescence level of the cells. This treatment could be amenable to establish treatment protocols to block/retard the progression of calcific disease in the human aortic valve based on KAT2B/pCAF activation. This image has been created with Servier Medical ART

References

    1. Small, A. et al. Biomarkers of calcific aortic valve disease. Arterioscler. Thromb. Vasc. Biol.37, 623–632 (2017). - PMC - PubMed
    1. Taylor, P. M., Batten, P., Brand, N. J., Thomas, P. S. & Yacoub, M. H. The cardiac valve interstitial cell. Int. J. Biochem. Cell Biol.35, 113–118 (2003). - PubMed
    1. Yip, C. Y., Chen, J. H., Zhao, R. & Simmons, C. A. Calcification by valve interstitial cells is regulated by the stiffness of the extracellular matrix. Arterioscler. Thromb. Vasc. Biol.29, 936–942 (2009). - PubMed
    1. Fisher, C. I., Chen, J. & Merryman, W. D. Calcific nodule morphogenesis by heart valve interstitial cells is strain dependent. Biomech. Model Mechanobiol.12, 5–17 (2013). - PMC - PubMed
    1. Bouchareb, R. et al. Mechanical strain induces the production of spheroid mineralized microparticles in the aortic valve through a RhoA/ROCK-dependent mechanism. J. Mol. Cell Cardiol.67, 49–59 (2014). - PubMed

MeSH terms

Supplementary concepts