. 2025 Oct;22(10):1262-1275.
doi: 10.1038/s41423-025-01343-1. Epub 2025 Sep 17.

Infiltrating macrophages replace Kupffer cells and play diverse roles in severe alcohol-associated hepatitis

Affiliations

Infiltrating macrophages replace Kupffer cells and play diverse roles in severe alcohol-associated hepatitis

Yang Wang et al. Cell Mol Immunol. 2025 Oct.

Abstract

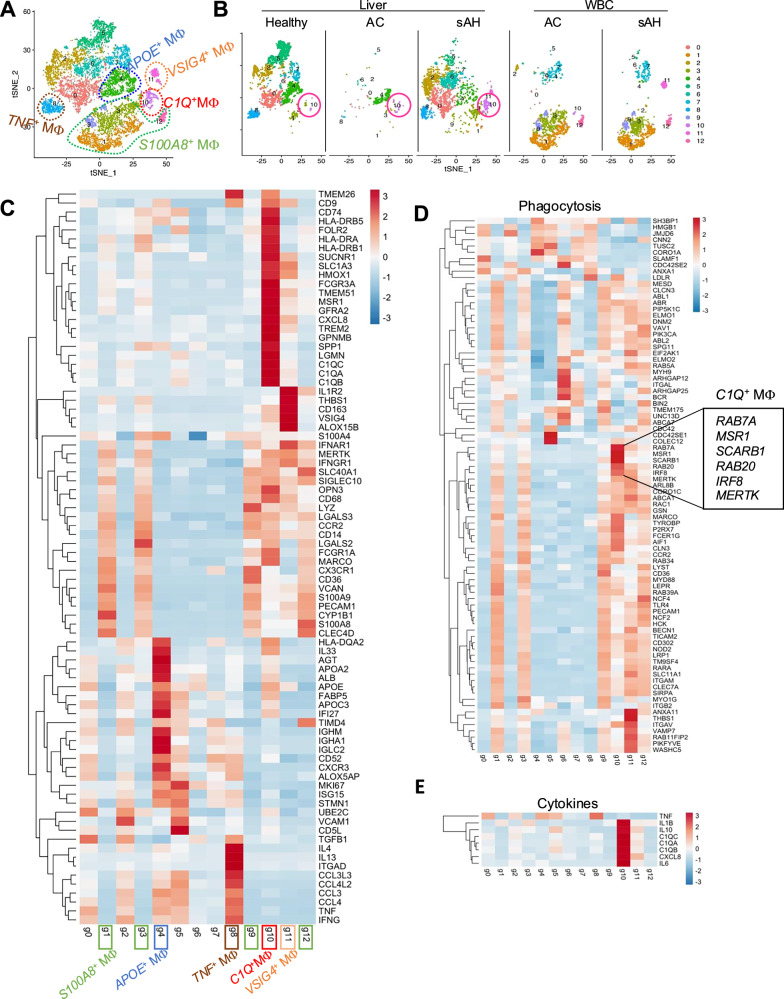
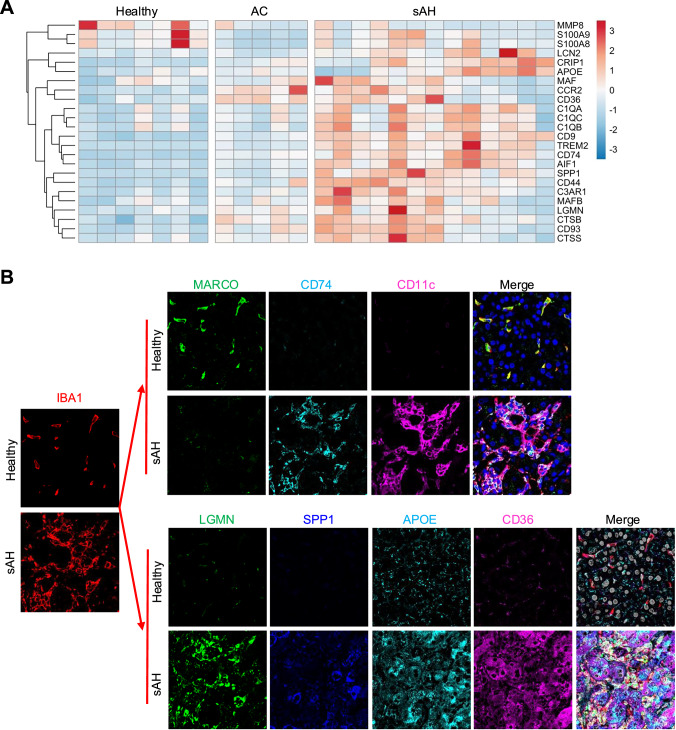
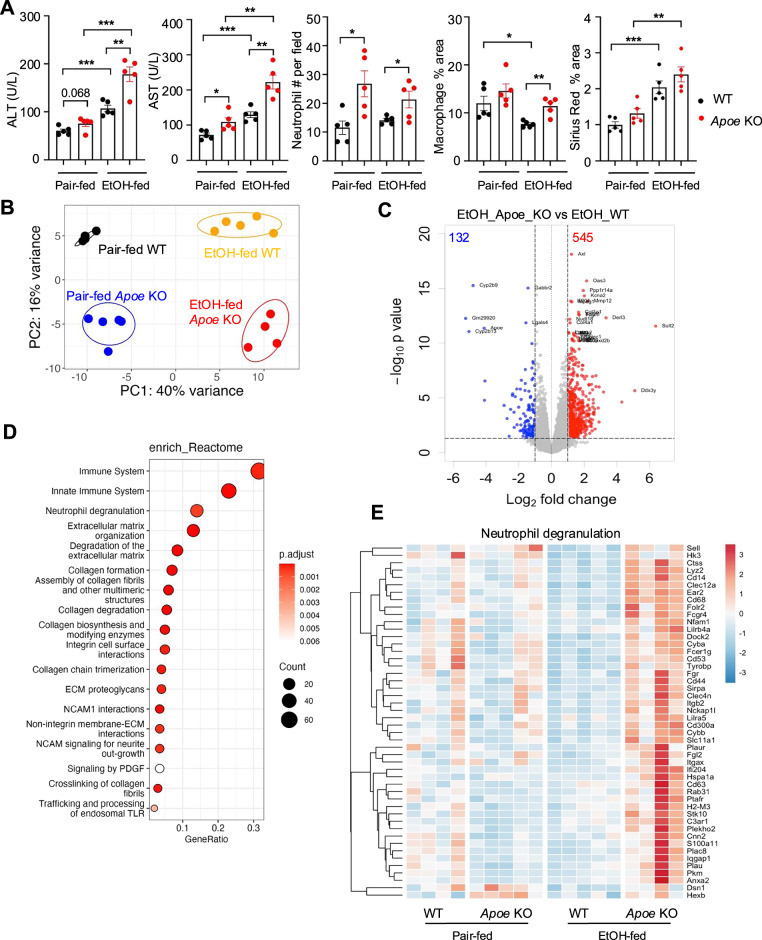
Patients with alcohol-associated cirrhosis (AC) may develop severe alcohol-associated hepatitis (sAH), a disease with high short-term mortality. Our previous studies demonstrated that sAH, but not AC livers, are infiltrated with a high number of self-sustaining IL-8+ neutrophils that likely drive the transition from AC to sAH. Monocyte-derived macrophages (MoMFs) also infiltrate the liver in sAH, but their roles remain largely obscure. In the present study, we characterized liver macrophages in human liver explants from sAH and AC patients. Our data revealed a marked reduction in Kupffer cells, whereas MoMFs were increased in sAH and AC. Single-cell RNA-Seq analyses revealed several populations in both AC and sAH, including C1Q+, S100A8+, APOE+, TNF+ and VSIG4+ macrophages, with sAH containing unique C1Q+ macrophages potentially playing a role in removing apoptotic neutrophils in sAH. C1Q+ macrophages also express many genes involved in phagocytosis and proinflammatory and anti-inflammatory functions, suggesting that C1Q+ macrophages have diverse functions in sAH. The roles of C1Q, S100A8, and APOE were further examined in experimental models of alcohol-induced liver injury. Our data revealed that C1q KO mice and macrophage-specific S100a8 KO mice presented similar alcohol-induced liver injury and hepatic neutrophil infiltration, while Apoe KO mice developed much more severe liver injury than did WT mice following chronic-plus-binge ethanol challenge. Taken together, sAH and AC are infiltrated with multiple populations of macrophages that perform diverse functions to drive chronic disease progression. Unique C1Q+ macrophages in sAH play a compensatory role in removing dead cells but may also promote inflammation in sAH.

Keywords: APOE; C1Q; Macrophages; Neutrophil apoptosis; S100A8.


Conflict of interest statement

Competing interests: The authors declare that they have no competing interests. Dr. Bin Gao is Associate Editor-in-Chief of Cellular & Molecular Immunology, but he has not been involved in the peer review or the decision-making of the article.

Figures

Fig. 1
Fig. 1
Kupffer cells are replaced by infiltrating macrophages in sAH. A Liver tissues from healthy controls (n = 9), alcohol-associated cirrhosis (AC) patients (n = 9), and alcohol-associated hepatitis (sAH) patients (n = 10) were analyzed via multiplex immunofluorescence staining for IBA1 (green) and MARCO (red). Representative immunofluorescence images are shown. Upper panel scale bars, 100 µm. Lower panel scale bars, 20 µm. B Quantification of IBA1⁺ Kupffer cells and macrophages as a proportion of total liver cells is shown (upper). The percentages of Kupffer cells and infiltrating macrophages among total IBA1⁺ cells were also quantified (lower). C Hepatic expression levels of Kupffer cell markers (MARCO, CD5L, and TIMD4) and infiltrating macrophage markers (TREM2, GPNMB, and SPP1) were analyzed via RNA-seq data from healthy controls (n = 7), AC patients (n = 5), and sAH patients (n = 13). Gene expression levels are presented as relative read counts. D Hepatic expression of Kupffer cell and infiltrating macrophage markers was analyzed via RNA-seq data (phs001807.v1. p1) from healthy controls (n = 10), early AHs (n = 12), sAH biopsies (n = 18), and sAH explants (n = 10). Gene expression levels are presented as transcripts per million. E Correlation analyses between MELD scores and Kupffer or infiltrating macrophage markers from RNA-seq data (phs001807.v1. p1) were performed. The data are presented as the means ± SEMs. Statistical significance was determined via one-way ANOVA followed by Tukey’s post hoc test for multiple comparisons. *P < 0.05, **P < 0.01, ***P < 0.001
Fig. 2
Fig. 2
scRNA-seq reveals macrophage heterogeneity in sAH. A Single-cell RNA sequencing analysis was performed on liver cells from 5 healthy controls, 3 AC patients, and 5 sAH patients, as well as peripheral white blood cells (WBCs) from 3 AC patients and 4 sAH patients. t-SNE plots showing the clustering of all the macrophage populations. B t-SNE plots showing macrophage clusters separated by patient group. C Heatmap illustrating the key signature genes of each macrophage subtype. D Heatmap displaying the expression of phagocytosis-related genes across macrophage subtypes. (E) Heatmap showing the expression of cytokine genes among all the macrophage subtypes
Fig. 3
Fig. 3
Verification of macrophage signature gene expression by bulk RNA-seq and multiplex immunofluorescence staining. A Bulk RNA-seq data from liver tissues of healthy controls and AC and sAH patients were analyzed. The heatmap displays macrophage signature genes in sAH patients compared with healthy controls and AC patients. B Liver tissues from healthy controls and sAH patients were subjected to multiplex immunofluorescence staining for IBA1, MARCO, CD74, and CD11c and LGMN, SPP1, APOE, and CD36
Fig. 4
Fig. 4
Bulk RNA-seq revealed differentially expressed genes in the livers of healthy controls and AC and sAH patients. A Bulk RNA-seq data of liver tissues from healthy controls and AC and sAH patients were analyzed. The PCA plot displays different gene expression patterns in healthy controls and AC and sAH patients. B Volcano plot showing differentially expressed genes in the livers of sAH patients and healthy controls. The x-axis indicates the log2-fold change (sAH patients vs. healthy controls), and the y-axis indicates the –log10 p value. The blue dots represent downregulated genes (log2[fold change] < −1, p < 0.05), and the red dots represent upregulated genes (log2[fold change] > 1, p < 0.05). C Heatmap showing the expression of neutrophil degranulation-related genes (upper panel), neutrophil apoptotic process-related genes (middle panel), and apoptotic cell clearance-related genes (lower panel) in the livers of healthy controls and AC and sAH patients
Fig. 5
Fig. 5
Accumulation of apoptotic neutrophils in sAH. A Liver tissues from sAH and AC patients were subjected to immunofluorescence staining of neutrophils (red) and DAPI (blue). Representative images (left) and the percentage of neutrophils among total liver cells (right) are shown. B Liver tissues from sAH and AC patients were subjected to TUNEL (brown) and MPO (pink) double staining. Representative images are shown. Scale bars, 100 µm. The quantification of TUNEL+ cells and TUNEL+MPO+ cells per field, and the percentage of TUNEL+MPO+ cells among the total number of MPO+ cells are shown. C Neutrophils were isolated from the fresh peripheral blood and liver of sAH patients and were immediately analyzed by staining with Zombie Violet and Annexin V via flow cytometry. The percentage of apoptotic neutrophils is shown on the right. D Spatial distribution of IBA1+ cells and MPO+ cells in liver tissues from healthy controls and AC and sAH patients (upper). The percentage of neutrophils located within 10 µm of a macrophage (lower left) and the average distance from the neutrophil to the closest macrophage (lower right) are shown. The values are presented as the means ± SEMs. *P < 0.05, **P < 0.01, ***P < 0.001, as determined by 2-tailed Student’s t test for comparing 2 groups (AC) or 1-way ANOVA followed by Tukey’s post hoc test for multiple groups (D)
Fig. 6
Fig. 6
Comparison of liver injury and neutrophil infiltration in WT, C1q KO, and macrophage-specific S100a8 KO mice in the EtOH-fed model. A WT mice and C1q KO mice were subjected to the chronic-plus-binge ethanol model. B WT mice and C1q KO mice were subjected to chronic-plus-binge ethanol and the Ad-Cxcl1 model. C WT, macrophage-specific S100a8 KO mice (S100a8f/fCx3cr1Cre), Kupffer cell-specific S100a8 KO (S100a8f/fClec4fCre), and mice with both Kupffer cell- and macrophage-specific S100a8 knockout (S100a8f/fClec4fCreCx3cr1Cre) were subjected to the chronic-plus-single binge model. D WT mice and macrophage-specific S100a8 KO mice (S100a8f/fCx3cr1Cre) were subjected to chronic-plus-binge ethanol and the Ad-Cxcl1 model. Serum ALT and AST levels were measured. Liver tissues were subjected to HE staining, IHC staining of neutrophils and macrophages, Sirius Red staining and Oil Red O staining. The results of the quantification of neutrophils, macrophages, and Sirius Red and Oil Red O staining are shown. The values are presented as the means ± SEMs. *P < 0.05, **P < 0.01, ***P < 0.001, as determined by 2-tailed Student’s t test for comparisons between 2 groups
Fig. 7
Fig. 7
Comparison of liver injury and neutrophil infiltration in WT and Apoe KO mice in the EtOH-feeding model. A WT mice and Apoe KO mice were subjected to the chronic-plus-single binge model. Serum ALT and AST levels were measured. Liver tissues were subjected to HE staining, IHC staining of neutrophils and macrophages, and Sirius Red staining. The quantification of neutrophils, macrophages, and Sirius Red is shown. B Liver tissues from WT and Apoe KO mice were subjected to bulk RNA-seq analysis. The PCA plot shows different gene expression patterns between pair-fed and EtOH-fed Apoe KO and WT mice. C Volcano plot displaying differentially expressed genes in the livers of EtOH-fed Apoe KO and WT mice. The x-axis represents the log2-fold change (Apoe KO vs. WT), and the y-axis represents the –log10 p value. The blue dots represent downregulated genes (log2[fold change] < −1, p < 0.05), and the red dots represent upregulated genes (log2[fold change] > 1, p < 0.05). D Reactome pathway analysis of differentially expressed genes in the livers of EtOH-fed Apoe KO and WT mice. E Heatmap showing the expression of neutrophil degranulation-related genes in the livers of Apoe KO and WT mice. The values are presented as the means ± SEMs (A, B). *P < 0.05, **P < 0.01, ***P < 0.001, as determined by a 2-tailed Student’s t test for comparing two groups
Fig. 8
Fig. 8
Schematic of the diverse functions of liver macrophages in severe alcohol-associated hepatitis. Heavy alcohol consumption damages hepatocytes, leading to the release of CCL2, which attracts numerous infiltrating monocyte-derived macrophages (MoMFs) to the injured liver to replace Kupffer cells. MoMFs include C1Q+ macrophages, APOE+ macrophages, TNF+ macrophages, VSIG4+ macrophages, and S100A8+ macrophages. C1Q+ macrophages are unique in sAH and express various groups of genes that likely play various roles in controlling AH disease progression (Created with Biorender.com)

References

    1. Mackowiak B, Fu Y, Maccioni L, Gao B. Alcohol-associated liver disease. J Clin Investig. 2024;134:e176345. - PMC - PubMed
    1. Bataller R, Arab JP, Shah VH. Alcohol-associated hepatitis. N Engl J Med. 2022;387:2436–48. - PubMed
    1. Feng D, Hwang S, Guillot A, Wang Y, Guan Y, Chen C, et al. Inflammation in alcohol-associated hepatitis: pathogenesis and therapeutic targets. Cell Mol Gastroenterol Hepatol. 2024;18:101352. - PMC - PubMed
    1. Gao B, Ahmad MF, Nagy LE, Tsukamoto H. Inflammatory pathways in alcoholic steatohepatitis. J Hepatol. 2019;70:249–59. - PMC - PubMed
    1. Vergis N, Patel V, Bogdanowicz K, Czyzewska-Khan J, Keshinro R, Fiorentino F, et al. IL-1 Signal inhibition in alcohol-related hepatitis: a randomized, double-blind, placebo-controlled trial of Canakinumab. Clin Gastroenterol Hepatol. 2024;23:797–807. - PubMed

MeSH terms

LinkOut - more resources