. 2025 Oct;646(8086):983-991.
doi: 10.1038/s41586-025-09522-w. Epub 2025 Sep 17.

CRISPR activation for SCN2A-related neurodevelopmental disorders

Affiliations

CRISPR activation for SCN2A-related neurodevelopmental disorders

Serena Tamura et al. Nature. 2025 Oct.

Abstract

Most neurodevelopmental disorders with single gene diagnoses act via haploinsufficiency, in which only one of the two gene copies is functional1. SCN2A haploinsufficiency is one of the most frequent causes of neurodevelopmental disorder, often presenting with autism spectrum disorder, intellectual disability and, in a subset of children, refractory epilepsy2. Here, using SCN2A haploinsufficiency as a proof-of-concept, we show that upregulation of the existing functional gene copy through CRISPR activation (CRISPRa) can rescue neurological-associated phenotypes in Scn2a haploinsufficient mice. We first show that restoring Scn2a expression in adolescent heterozygous Scn2a conditional knock-in mice rescues electrophysiological deficits associated with Scn2a haploinsufficiency (Scn2a+/-). Next, using an adeno-associated virus CRISPRa-based treatment in adolescent mice, we show that we can correct intrinsic and synaptic deficits in neocortical pyramidal cells, a major cell type that contributes to neurodevelopmental disorders and seizure aetiology in SCN2A haploinsufficiency. Furthermore, we find that systemic delivery of CRISPRa protects Scn2a+/- mice against chemoconvulsant-induced seizures. Finally, we also show that adeno-associated virus CRISPRa treatment rescues excitability in SCN2A haploinsufficient human stem-cell-derived neurons. Our results showcase the potential of this therapeutic approach to rescue SCN2A haploinsufficiency and demonstrates that rescue even at adolescent stages can ameliorate neurodevelopmental phenotypes.


Conflict of interest statement

Competing interests: N.M. is the cofounder and former board member and CSO of Regel Therapeutics, N.A. is the cofounder of Regel Therapeutics and both N.A. and K.J.B. are on the scientific advisory board of Regel Therapeutics. P.W.E.S. is a Program Director at Regel Therapeutics. N.M. and N.A. are the inventors on patent ‘Gene therapy for haploinsufficiency’ WO2018148256A9. N.A., K.J.B. and S.J.S. receive funding from BioMarin Pharmaceutical Incorporated. The other authors declare no competing interests.

Figures

Extended Data Figure 1:
Extended Data Figure 1:. Excitatory pyramidal neurons in the mPFC are GFP+ in Cre-negative Scn2a+/KI animals.
a. Coronal brain sections from P60 Scn2a+/KI mouse (Cre−) immunostained with anti-GFP and anti-parvalbumin (PV). b. Zoom of area highlighted by dashed box in panel a, with GFP and Parvalbumin channels separated then merged at bottom. Parv+ somata are circled in the GFP panel. c. Further zoom of region in layer 5b in panel b. Parv+ somata are circled as in panel c. d. Quantification of mean fluorescence intensify of GFP in PV-negative cells, PV-positive cells, and neuropil (area without somata as a measure of background fluorescence). Data are from 2 mice. Circles are mean GFP intensity values in ROIs of Parv− somata, Parv+ somata, or neighboring neuropil in single optical sections. Box plots are medians, quartiles, and 100% tails. n = 67 Parv− and 37 Parv+ cells analyzed; Parv− vs. Parv+: ****p < 0.0001. Parv− vs. neuropil: ****p < 0.0001. Holm-Šídák multiple comparisons test.
Extended Data Figure 2:
Extended Data Figure 2:. In vitro optimization of CRISPRa constructs in mouse Neuroblastoma-2A cells
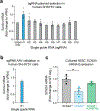
a. Fold change of Scn2a expression in Neuro-2a cells transfected with plasmids containing sgRNAs targeting the promoter of mouse Scn2a compared to a no-sgRNA VP64 control. Blue bars represent plasmids with largest increase in Scn2a expression. Circles are replicates, overlaid on mean ± SD. b. Fold change of Scn2a transduced with rAAV-DJ virus in Neuro-2a cells. Circles are replicates, overlaid on mean ± SD. c. Total animal weight at time of 8 mg/kg 4-AP administration (animals aged 69–119 days). Circles are animals. Box plots are medians, quartiles and 100% tails. d. qPCR analysis of dCas9 and mCherry mRNA within the mPFC of tail vein injected Scn2a+/+ + CRISPRa (light gray) and Scn2a+/− + CRISPRa (purple) versus uninjected controls Scn2a+/+ (dark gray) or Scn2a+/− (cyan). Injected animals with at least a 10-fold increase in expression levels of both dCas9 and mCherry to the average Scn2a+/+ uninjected controls were included in EEG datasets in Fig 3.
Extended Data Figure 3:
Extended Data Figure 3:. Scn2a-CRISPRa off-target analysis in in vitro cell lines
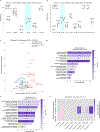
a. RNA-seq expression levels of Scn2a TAD-domain genes from Scn2a-rAAV-CRISPRa treated Neuro-2a cells compared to VP64-only. Circles are individual replicates, box plots are medians, quartiles and 100% tails. p-values noted above data. Wald-log test. b. RNA-seq expression levels of sodium channels from Scn2a-rAAV-CRISPRa treated Neuro-2a cells compared to VP64-only. Circles are individual replicates, box plots are medians, quartiles and 100% tails. p-values noted above data. Wald-log test. c. Volcano plot representing Log2 fold-change in expression levels for each gene. Wald-log test. P-values noted above each comparison. Grey dots represent no significant DEGs for CRISPRa, purple dots signify Scn2a and nearby genes, and orange dots denote upregulated genes. d. Gene ontology (GO) analysis showing enrichment of molecular functions. e. Gene ontology (GO) analysis showing enrichment of biological processes. f. Analysis of sgRNA sequence off-targeting using Cas-OFFinder.
Extended Data Figure 4:
Extended Data Figure 4:. Intrinsic electrophysiology of Scn2a+/KI and CRISPRa treated neurons.
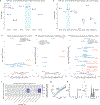
a. AP threshold from P57–85 Scn2a-rAAV-empty vector Scn2a+/+ (light gray) and Scn2a+/− (magenta) neurons, Scn2a-rAAV-CRISPRa treated Scn2a+/+ (dark gray) and Scn2a+/− (purple) neurons, and Scn2a+/KI Cre− (green) and Scn2a+/KI Cre+ (gray) neurons. Threshold of the first AP evoked by a near-rheobase current. Scn2a+/+ + empty: n = 17 cells; Scn2a+/− + empty: n = 27 cells; Scn2a+/+ + CRISPRa: n = 24 cells; Scn2a+/− + CRISPRa: n = 19 cells; Scn2a+/KI Cre−: n = 29 cells; Scn2a+/KI Cre+: n = 21 cells. No significant differences. Holm-Šídák multiple comparisons test. Circles are individual cells, box plots are medians, quartiles and 100% tails. b. Input resistance (MΩ). Scn2a+/+ + empty: n = 17 cells; Scn2a+/− + empty: n = 27 cells; Scn2a+/+ + CRISPRa: n = 17 cells; Scn2a+/− + CRISPRa: n = 11 cells; Scn2a+/KI Cre−: n = 26 cells; Scn2a+/KI Cre+: n = 19 cells. No significant differences. Holm-Šídák multiple comparisons test. Circles are individual cells, box plots are medians, quartiles and 100% tails. c. Rheobase current (pA) to generate first spike. Scn2a+/+ + empty: n = 16 cells; Scn2a+/− + empty: n = 27 cells; Scn2a+/+ + CRISPRa: n = 17 cells; Scn2a+/− + CRISPRa: n = 12 cells; Scn2a+/KI Cre−: n = 25 cells; Scn2a+/KI Cre+: n = 19 cells. No significant differences. Holm-Šídák multiple comparisons test. Circles are individual cells, box plots are medians, quartiles and 100% tails. d. APs per 300 ms stimulation epoch for each current amplitude. Left: Quantification of firing rate slope of data on Right. Scn2a+/+ + empty: n = 16 cells; Scn2a+/− + empty: n = 27 cells; Scn2a+/+ + CRISPRa: n = 17 cells; Scn2a+/− + CRISPRa: n = 12 cells; Scn2a+/KI Cre−: n = 25 cells; Scn2a+/KI Cre+: n = 19 cells. No significant differences. Holm-Šídák multiple comparisons test. Circles are individual cells, box plots are medians, quartiles and 100% tails.Right: Number of APs versus current amplitude injected. Circles and bars are mean ± SEM at each stimulus intensity.
Extended Data Figure 5:
Extended Data Figure 5:. Scn2a-CRISPRa off-target analysis in in vivo mouse neocortex
a. RNA-seq expression levels of Scn2a TAD-domain genes from Scn2a-rAAV-CRISPRa treated Neuro-2a cells compared to VP64-only. Circles are individual mice, box plots are medians, quartiles and 100% tails. b. RNA-seq expression levels of sodium channels from Scn2a-rAAV-CRISPRa treated Neuro-2a cells compared to VP64-only. Circles are individual mice, box plots are medians, quartiles and 100% tails. c. Volcano plot representing Log2 fold-change in expression levels for each gene for WT vs Scn2a+/− “Het”. Wald-log test. P-values noted above each comparison. Grey dots represent no significant DEGs for CRISPRa, purple dots signify Scn2a and nearby genes, and orange dots denote upregulated genes. d. Same as c, but for CRISPRa-treated Scn2a+/− “CRISPRa” vs WT. e. Same as c, but for CRISPRa-treated Scn2a+/− “CRISPRa” vs Scn2a+/− “Het”. f. Analysis of sgRNA sequence off-targeting using Cas-OFFinder. g. Data representation of NeuN-positive neuronal nuclei isolated from cortical tissue for FACS sorting. Representative FACS plots visualized with FlowJo V10 with percentage of parent gates for each population. Singlets were selected based on FSC-H versus FSC-A h. From singlets, DAPI-positive events were gated to identify nuclei. i. NeuN-positive neuronal nuclei were selected using an anti-NeuN antibody conjugated to Alexa Fluor 488.
Extended Data Figure 6:
Extended Data Figure 6:. CRISPRa expression persists through 16 months post-systemic injection
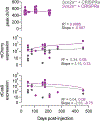
Peak AP dV/dt (top) at 30-, 56-, 107-, and 210-days following tail-vein injection of Scn2a-rAAV-CRISPRa-PHP.eB in Scn2a+/−mice (purple). Circles represent individual neurons. Lines are linear regression. qPCR of mCherry (middle) or dCas9 (bottom) mRNA from neocortical samples collected from tail-vein or retro-orbital Scn2a-rAAV-CRISPRa-PHP.eB injected Scn2a+/+ (gray) or Scn2a+/− mice (purple) across time. Circles represent single mice. Lines are linear regression.
Extended Data Figure 7:
Extended Data Figure 7:. Behavioral and EEG response to increasing doses of 4-AP in Scn2a+/− mice
a. Example PFC EEGs from animals receiving 8 and 15 mg/kg 4-AP. 4-AP administered at onset of all recordings. Dashed box denotes a tonic clonic seizure and subsequent mortality occurring with 15 mg/kg dosing in Scn2a+/− animal. EEG data within boxed area is shown at higher resolution on right. b. Survival curves for all WT and Scn2a+/− animals for 6, 8 and 15 mg/kg 4-AP. WT: black, Scn2a+/−: cyan.
Extended Data Figure 8:
Extended Data Figure 8:. In vitro optimization of CRISPRa constructs in human SH-SY5Ycells
a. Fold change of Scn2a expression in SH-SY5Y cells transfected with plasmids containing sgRNAs targeting the promoter of human Scn2a compared to a no sgRNA VP64 control. b. Fold change of Scn2a transduced with rAAV-DJ virus in human SH-SY5Y cells. c. SCN2A mRNA expression from SCN2A+/+ (black), SCN2A+/− (cyan), and SCN2A-rAAV-CRISPRa treated SCN2A+/− (purple) hESC-derived neurons normalized to wild type average. SCN2A+/+ vs. SCN2A+/−: *p = 0.03. Holm-Šídák multiple comparisons test. n = 3 replicates for all conditions. circles are individual replicates. Bars are mean ± SD.
Extended Data Figure 9:
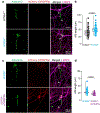
Extended Data Figure 9:. Axon initial segment structural plasticity occurs in SCN2A+/− neurons and is rescued by CRISPRa.
a. Representative images of SCN2A+/+ (black) and SCN2A+/− (cyan) human stem-cell-derived neurons immunostained with antibodies against ankyrin-G (green) and MAP2 (magenta). Arrowheads denote start and end points used to quantify AIS length. b. Quantification of AIS length. SCN2A+/+: n = 56 cells, 3 dishes. SCN2A+/−: n = 56 cells, 3 dishes. ****p < 0.0001. Mann-Whitney test. c. Representative images of SCN2A+/− neurons expressing Scn2a-rAAV-CRISPRa-mCherry (purple) and mCherry-negative internal SCN2A+/− controls (cyan). Immunostaining against ankyrin-G and MAP2. d. Quantification of AIS length. SCN2A+/−: n = 122 cells, 3 dishes. SCN2A+/− + CRISPRa: n = 23 cells, 3 dishes. ****p < 0.0001. Mann-Whitney test. Circles are individual AIS calculations. Box plots are medians, quartiles, and 100% tails.
Fig 1.
Fig 1.. Genetic rescue of Scn2a haploinsufficiency in adolescent mice rescues electrophysiological deficits.
a. Summary of Scn2a haploinsufficiency effects on mouse mPFC layer 5b pyramidal neurons (L5PNs). b. Strategy for genetic restoration of Scn2a in Scn2a+/KI conditional knock-in model. c. 2PLSM z-stack of layer 5 mPFC in acute slice from Scn2a+/KI mouse without Cre injection. Arrows highlight GFP-negative, presumptive interneurons. d. Schematic of rAAV-EF1α-Cre-mCherry injection into the mPFC of P30 Scn2a+/KI mice. Electrophysiological and imaging experiments in Scn2a+/KI and control mice were performed between P60–70. e. APs per 300 ms stimulation epoch across a range of current amplitudes in Scn2a+/KI Cre-negative (green) and Scn2a+/KI Cre positive (red) L5PN. f. Left: Representative phase-plane plots (dV/dt vs. voltage) of somatic APs across conditions. Right: Peak dV/dt of the first AP evoked by a near-rheobase current. n = 44 Scn2a+/+, 37 Scn2a+/−, 30 Scn2a+/KI Cre−, 21 Scn2a+/KI Cre+ cells. ****p < 0.0001, *p = 0.02, Holm-Šídák multiple comparisons test. g. Left: 2PLSM imaging of bAP-evoked Ca transients (doublet bursts) in L5PN apical dendrites (>400 μm from soma) across conditions. Right: Ca transient amplitude of the first of 5 bursts (top) and area under the curve (AUC) (bottom). n = 49 Scn2a+/+, 23 Scn2a+/−, 29 Scn2a+/KI Cre−, 26 Scn2a+/KI Cre+ imaging sites across ≥7 L5PNs per condition from ≥2 animals. ****p < 0.0001. Holm-Šídák multiple comparisons test. h. Left: AMPA and mixed AMPA/NMDA receptor-mediated EPSCs at −80 and +30 mV, respectively. NMDA receptor-mediated component measured 50 ms after stimulation (dotted line). Right: Quantification of AMPA:NMDA ratio. n = 8 Scn2a+/+, 9 Scn2a+/−, 8 Scn2a+/KI Cre−, 9 Scn2a+/KI Cre+ cells. *p = 0.02, **p = 0.004, ***p = 0.009, ****p = 0.002, Holm-Šídák multiple comparisons test. Circles are single cells (f, h) or single imaging sites (g); box plots are medians, quartiles, and 100% tails.
Fig. 2.
Fig. 2.. Intracranial Scn2a-rAAV-CRISPRa in mPFC rescues excitability deficits in Scn2a+/− neurons.
a. CRT design to rescue Scn2a haploinsufficiency. b. Local injection of Scn2a-rAAV-CRISPRa (viruses injected in brackets) and coronal section detailing injection site, stained for mCherry and DAPI. c. qPCR of Scn2a mRNA across conditions. n = 9 Scn2a+/+ + CRISPRa, 6 Scn2a+/+ + empty, 10 Scn2a+/− + CRISPRa, 5 Scn2a+/− + empty: 1.0 ± 0.06, n = 5 mice. **p = 0.0016; ***p = 0.0007. Mann-Whitney test. d. AP phase-plane plots CRT-treated and empty-treated Scn2a+/+ and Scn2a+/− mice. Populations also compared to interleaved, uninjected controls. n = 16 Scn2a+/+, 12 Scn2a+/−, 24 Scn2a+/++CRISPRa, 19 Scn2a+/−+CRISPRa: 17 Scn2a+/++empty, and 27 Scn2a+/−+empty cells. ****p < 0.0001. n.s., not significant. Holm-Šídák multiple comparisons test. e. AMPA:NMDA ratio, as in Fig. 1h, for Scn2a+/−+CRISPRa (mCherry+, purple, n=7) and Scn2a+/− (mCherry–, cyan, n=4) internal controls. Gray bar: 95% confidence interval of Scn2a+/+ control data from. **p = 0.006. Mann-Whitney Wilcoxon test. f. bAP-evoked Ca imaging, as in Fig. 1g, in L5PNs from P55–84 Scn2a+/+ (black, n=38 sites, 11 cells, 5 mice), Scn2a+/− (cyan, n = 40 sites, 11 cells, 5 mice), Scn2a+/− + CRISPRa (purple, n=18 sites, 5 cells, 5 mice), and Scn2a+/+ + CRISPRa (gray, n = 29 sites 8 cells, 8 mice). **p = 0.0002, ***p = 0.0004, ****p < 0.0001, Mixed-effect model, Holm-Šídák multiple comparisons test. Circles are animals (c), single cells (d-e) or imaging sites (f); box plots are medians, quartiles, and 100% tails.
Fig. 3.
Fig. 3.. Systemic CRT rescues electrophysiological deficits and is protective against chemoconvulsant-induced seizure.
a. Schematic of Scn2a-rAAV-CRISPRa-PHP.eB intravenous tail vein delivery. Viruses injected described in brackets. b. Sagittal brain section from P80 Scn2a+/−+CRISPRa mouse following tail vein injection of Scn2a-rAAV-CRISPRa-PHP.eB at P30, stained for mCherry and DAPI. c. Peak AP dV/dt from P82–241 Scn2a+/+ (black, n=44), Scn2a+/− (cyan, n=37), and tail vein Scn2a-rAAV-CRISPRa-PHP.eB injected Scn2a+/++CRISPRa (gray, n=23) and Scn2a+/−+CRISPRa (purple, n=20) L5PNs. ****p<0.0001, Holm-Šídák multiple comparisons test. d. AMPA:NMDA ratio from P79–85 Scn2a+/+ and Scn2a+/− uninjected controls (left) and P82–241 Scn2a-CRISPRa-PHP.eB treated Scn2a+/+ and Scn2a+/− mice (right). n = 7, 14, 11, 13 cells, respectively. *p<0.05. Holm-Šídák multiple comparisons test vs. Scn2a+/−. e. Left: Modeled distribution of NaV1.2 and NaV1.6 across axon initial segment (AIS), soma, and proximal apical dendrite. Middle: AP phase-plane plots with varying NaV1.2 plasma membrane densities. Right: Predicted peak AP dV/dt as a function of NaV1.2 expression levels. f. Empirical measurements of peak AP dV/dt in Scn2a+/+, Scn2a+/−, and Scn2a−/− L5PNs compared to Scn2a+/+ + CRISPRa. Scn2a+/+, Scn2a+/−, and Scn2a−/− values are from. Scn2a+/++CRISPRa are merged local and tail vein peak dV/dt values. Data placed at 175% of WT based on PCR upregulation (Fig. 2c). Scn2a+/+ vs. Scn2a+/++CRISPRa; p=0.5, Mann-Whitney test. g. EEG from screws placed above prefrontal cortex in naïve or CRISRPa-treated WT and Scn2a+/− mice receiving 8 mg/kg 4-AP at onset of recording. h. Expansion of grey bar area in g. Red marks denote automated identification of ictal-like activity. i. Ictal spikes, binned per 5 minutes, across groups. Bars and shading are mean±SEM. j. Events per animal at the peak of ictal event period. * p<0.03, ** p<0.004. Holm-Šídák multiple comparisons test. Circles are single cells (c, d, f) or animals (k); box plots are medians, quartiles, and 100% tails.
Fig. 4.
Fig. 4.. SCN2A-rAAV-CRISPRa rescues spiking properties of SCN2A+/− human embryonic stem cell-derived neurons.
a. Schematic of electrophysiological recording of CRISPRa-treated differentiated hESC-derived neurons. Cells were transduced at DIV 30, and experiments were performed at DIV 65–66. b. Differentiated SCN2A+/− hESC-derived neurons at DIV 65 immunostained with antibodies against the neuronal marker MAP2, the glial marker GFAP, and DAPI. c. APs generated from a range of current amplitudes (0–340 pA, 10 pA intervals, 300 ms) in DIV 65–66 SCN2A+/+ (black), SCN2A+/− (cyan), and SCN2A-rAAV-CRISPRa treated SCN2A+/− (purple) hESC-derived neurons. Arrows highlight spontaneous excitatory postsynaptic potentials (EPSPs) that occurred within recording epoch. d. Left: DIC image of SCN2A+/− hESC-derived neuron and recording electrode. Right: AP (spikes) per 300 ms stimulation epoch versus current injection amplitude. SCN2A+/+ vs. SCN2A+/−: ****p < 0.0001. SCN2A+/− vs. SCN2A+/− + CRISPRa ****p < 0.0001. Holm-Šídák multiple comparisons test. e. Representative phase-plane plots and quantification of peak dV/dt in SCN2A+/+, SCN2A+/−, and SCN2A-rAAV CRISPRa treated SCN2A+/− hESC-derived neurons. n = 18 SCN2A+/+, 18 SCN2A+/−, 13 SCN2A+/− + CRISPRa neurons. ** p = 0.0014, ***p = 0.0004, ****p < 0.0001, Holm-Šídák multiple comparisons test. Circles are single cells; box plots are medians, quartiles, and 100% tails.

References

    1. Karczewski KJ et al. The mutational constraint spectrum quantified from variation in 141,456 humans. Nature 581, 434–443 (2020). - PMC - PubMed
    1. Sanders SJ et al. Progress in Understanding and Treating SCN2A-Mediated Disorders. Trends Neurosci (2018) doi: 10.1016/j.tins.2018.03.011. - DOI - PMC - PubMed
    1. Maenner MJ et al. Prevalence of autism spectrum disorder among children aged 8 Years-Autism and developmental disabilities monitoring network, 11 Sites, United States, 2016. MMWR Surveillance Summaries (2020) doi: 10.15585/MMWR.SS6904A1. - DOI - PMC - PubMed
    1. Kaplanis J et al. Evidence for 28 genetic disorders discovered by combining healthcare and research data. Nature 586, 757–762 (2020). - PMC - PubMed
    1. Fu JM et al. Rare coding variation provides insight into the genetic architecture and phenotypic context of autism. Nat Genet 54, 1320–1331 (2022). - PMC - PubMed

MeSH terms

Substances