. 2025 Nov;647(8088):268-276.
doi: 10.1038/s41586-025-09535-5. Epub 2025 Sep 17.

Covariation MS uncovers a protein that controls cysteine catabolism

Affiliations

Covariation MS uncovers a protein that controls cysteine catabolism

Haopeng Xiao et al. Nature. 2025 Nov.

Abstract

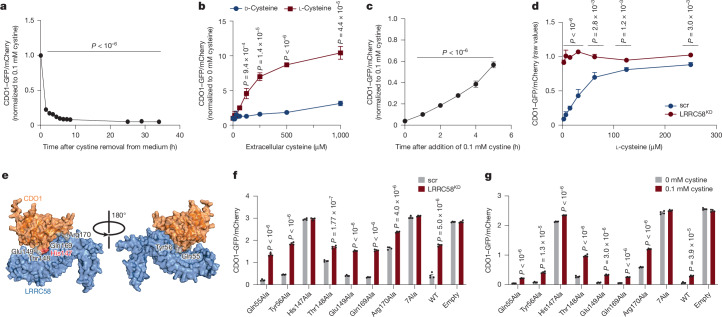
The regulation of metabolic processes by proteins is fundamental to biology and yet is incompletely understood. Here we develop a mass spectrometry (MS)-based approach that leverages genetic diversity to nominate functional relationships between 285 metabolites and 11,868 proteins in living tissues. This method recapitulates protein-metabolite functional relationships mediated by direct physical interactions and local metabolic pathway regulation while nominating 3,542 previously undescribed relationships. With this foundation, we identify a mechanism of regulation over liver cysteine utilization and cholesterol handling, regulated by the poorly characterized protein LRRC58. We show that LRRC58 is the substrate adaptor of an E3 ubiquitin ligase that mediates proteasomal degradation of CDO1, the rate-limiting enzyme of the catabolic shunt of cysteine to taurine1. Cysteine abundance regulates LRRC58-mediated CDO1 degradation, and depletion of LRRC58 is sufficient to stabilize CDO1 to drive consumption of cysteine to produce taurine. Taurine has a central role in cholesterol handling, promoting its excretion from the liver2, and we show that depletion of LRRC58 in hepatocytes increases cysteine flux to taurine and lowers hepatic cholesterol in mice. Uncovering the mechanism of LRRC58 control over cysteine catabolism exemplifies the utility of covariation MS to identify modes of protein regulation of metabolic processes.


Conflict of interest statement

Competing interests: E.T.C. is co-founder and equity holder of Matchpoint Therapeutics and Aevum Therapeutics. E.S.F. is a founder, scientific advisory board member and equity holder of Civetta Therapeutics, Proximity Therapeutics, Neomorph Inc. (serving on the board of directors), Stelexis Biosciences Inc., Anvia Therapeutics Inc. (serving on the board of directors) and CPD4 Inc. (serving on the board of directors). E.S.F. is also an equity holder and scientific advisory board member for Avilar Therapeutics, Photys Therapeutics and Ajax Therapeutics and an equity holder in Lighthorse Therapeutics. E.S.F. is a consultant to Novartis, EcoR1 capital, Odyssey and Deerfield. The Fischer laboratory receives or has received research funding from Deerfield, Novartis, Ajax, Interline, Bayer and Astellas. K.A.D. receives or has received consulting fees from Neomorph Inc. and Kronos Bio. E.T.C., H.X. and M.O. have filed patents on LRRC58. The other authors declare no competing interests.

Figures

Fig. 1
Fig. 1. Protein–metabolite covariation in the DO cohort recapitulates established biochemical reactions.
a, Breeding scheme and genetic diversity of the DO cohort. SNPs, single nucleotide polymorphisms. Created in BioRender. Xiao, H. (2025) https://BioRender.com/cluhh92. b, BAT and liver, two metabolically heterogenous tissues, were selected for deep proteomics and metabolomic profiling. The figure shows proteins and metabolites measured from BAT and liver of different genotypes of mice in this work alongside those from previous studies,,–,. n = 163 mice. c, Abundance correlation between individual proteins and metabolites in each tissue were filtered using the Benjamini–Hochberg (BH) procedure, and then used to recapitulate established biochemical reactions, pathways and transporter–metabolite relationships. Details in Methods. Padj, adjusted P value. d, Overview of Rhea edge recapitulation analysis. The entire Rhea reaction network mapped in MPCA is illustrated. Each metabolite–enzyme interaction is shown as an edge between a metabolite and a protein node. Edges between succinate and NAD+ and proteins are magnified. n = 163 mice. See Supplementary Table 3 for the underlying dataset. e, MPCA edges recapitulate relationships between succinate, NAD+ and mitochondrial electron transport chain proteins. Two-sided Pearson correlation test with Benjamini–Hochberg P-value correction. Error band represents the 95% confidence interval.
Fig. 2
Fig. 2. MPCA identifies LRRC58 as a negative regulator of hypotaurine and taurine production.
a, Schematic of machine learning based on LASSO regression to identify protein regulators of metabolites. Coeff., coefficient. Created in BioRender. Xiao, H. (2025) https://BioRender.com/lpjycc1. b, LASSO regression identified proteins that predict hypotaurine abundance in BAT. n = 163 mice. c, Correlation between CDO1 abundance and hypotaurine abundance, as well as correlation between LRRC58 abundance and hypotaurine abundance, in liver and BAT. Liver, n = 162 mice; BAT, n = 163 mice. d, Comparison of hypotaurine and taurine in scr and LRRC58KD (induced by siRNA A (LRRC58siA) or siRNA B (LRRC58siB)) Hep G2 cells. n = 4 cell replicates. Data replotted from Extended Data Fig. 6g. e, Comparison of hypotaurine and taurine in wild-type (WT) and LRRC58OE Hep G2 cells. n = 4 cell replicates. Underlying data replotted from Extended Data Fig. 6i. f, Comparison of 13C315N1-l-cysteine abundance in scramble and LRRC58siA primary hepatocytes following 30 min incubation with 200 µM 13C615N2-labelled l-cystine. n = 6 cell replicates. g, Comparison of 13C215N1-hypotaurine and 13C215N1-taurine abundance in scr and LRRC58siA primary hepatocytes following 30 min incubation with 200 µM 13C615N2-labelled l-cystine. n = 6 cell replicates. Two-tailed Student’s t-test for pairwise comparisons (dg). Data are mean ± s.e.m.; error band in c represents the 95% confidence interval.
Fig. 3
Fig. 3. LRRC58 is a substrate adaptor for an E3 ligase that targets CDO1 for degradation.
a, Proteomics analysis comparing scr to LRRC58siA (left) and LRRC58siB (right) primary brown adipocytes. LRRC58siB, n = 3; other groups cell replicates, n = 4 cell replicates. b, Comparison of CDO1 abundance in scr, LRRC58siA and LRRC58siB primary brown adipocytes. LRRC58siB, n = 3 cell replicates; other groups, n = 4 cell replicates. Data replotted from a. c, Proteomics analysis comparing scr to LRRC58siA and LRRC58siB primary hepatocytes. n = 5 cell replicates. d, Comparison of CDO1 abundance in scr, LRRC58siA and LRRC58siB primary hepatocytes. n = 5 cell replicates. Data replotted from c. e, Proteomics analysis comparing WT to LRRC58OE Hep G2 cells. n = 4 cell replicates. f, Comparison of CDO1 abundance in WT (scr) and LRRC58OE Hep G2 cells. n = 4 cell replicates. Data replotted from e. g, Flag immunoprecipitation (IP) followed by western blotting from Hep G2 cells expressing Flag-tagged LRRC58. n = 3 cell replicates. h, Top, size-exclusion chromatography (SEC) of CRL5–LRRC58 complex with or without CDO1. Bottom, fractions across each peak were analysed by SDS–PAGE and Coomassie staining. SEC was repeated three times with similar results. i, TR-FRET assessment of complex formation between CDO1 and eGFP–LRRC58–ELOB–ELOC (top) and displacement of eGFP–LRRC58 by unlabelled LRRC58–ELOB–ELOC (bottom). j, AlphaFold modelling of the cullin–RING E3–ligase complex involving RBX2, CUL5, ELOB, ELOC, LRRC58 and CDO1. ELOB/C, ELOB–ELOC complex. Created in BioRender. Xiao, H. (2025) https://BioRender.com/ajl3ub6. k, Predicted aligned error plot of the CDO1–CRL5–LRRC58 interfaces. l, Time course of ubiquitylation of CDO1 by CRL5–LRRC58 with all reaction components (ATP, UBA1, UBE2D3, CRL5–LRRC58 and CDO1). Experiments were repeated three times with similar results. m, Ubiquitylation of CDO1 by CRL5–LRRC58 at endpoint (10 min) with individual components removed. Experiments were repeated three times with similar results. Two-tailed Student’s t-test for pairwise comparisons (af). Data are mean ± s.e.m.
Fig. 4
Fig. 4. Regulation of LRRC58–CDO1 by cellular cysteine abundance.
a, Post-translational stability of CDO1 reporter over time following switch from standard medium (0.1 mM cystine) to medium without cystine. Data are normalized to standard medium. t = 0, n = 10 cell replicates; other time points, n = 5 cell replicates. Statistical comparison is to t = 0. b, Post-translational stability of CDO1 following exposure to media with indicated levels of d-cysteine and l-cysteine for 24 h. Data are normalized to cells maintained in medium without cystine. No-cystine control, n = 8; other treatments, n = 4. Statistical comparison is between d-cysteine and l-cysteine. c, Reporter cells were cystine-depleted for 24 h, then changed back to normal 0.1 mM cystine medium for the indicated length of time. GFP/mCherry ratio is normalized to cells that were maintained in 0.1 mM cystine. n = 4 cell replicates. Statistical comparison is to t = 0. d, Concentration-dependent effect of cysteine on post-translational stability of CDO1 in LRRC58KD or scr cells. n = 4 cell replicates. Statistical comparison is between LRRC58KD and scr cells at each cysteine concentration. e, AlphaFold predicted structure of the interaction between LRRC58 and CDO1, with interface residues labelled. f, GFP/mCherry ratio in LRRC58KD and scr Hep G2 cells expressing CDO1 mutant reporters. n = 4 cell replicates. g, GFP/mCherry ratio in Hep G2 cells expressing CDO1 mutant reporters treated with 0.1 mM cystine or cystine-restricted. n = 4 cell replicates. Two-tailed Student’s t-test for pairwise comparisons. Data are mean ± s.d.
Fig. 5
Fig. 5. Depletion of LRRC58 stabilizes CDO1 and regulates hepatic cholesterol and fatty acid metabolism.
ac, Proteomics analysis (a) and LRRC58 (b) and CDO1 (c) abundance in the liver of WT and LRRC58KD mice. Tissue specificity of LRRC58 knockdown is shown in Extended Data Fig. 9b,c. LRRC58KD, n = 8 male mice; scr, n = 7 male mice. Number of mice was limited by the throughput of a tandem mass tag (TMT) plex for proteomics. d, Hepatic cholesterol levels in WT and LRRC58KD mice. LRRC58KD, n = 12 male mice; scr, n = 11 male mice. e, Hepatic cysteine levels in WT and LRRC58KD mice. LRRC58KD, n = 12 male mice; scr, n = 11 male mice. f, 13C215N1-taurine abundance in liver of scr and LRRC58KD mice following intravenous administration of 13C615N2-labelled l-cystine for 30 min. LRRC58KD, n = 9 male mice; scr, n = 9 male mice. g, Hepatic total bile acid (BA) levels in WT and LRRC58KD mice. LRRC58KD, n = 12 male mice; scr, n = 11 male mice. h, Biliary cholesterol levels in WT and LRRC58KD mice. LRRC58KD, n = 12 male mice; scr, n = 9 male mice (gallbladder extraction failed for 2 mice). i, Hepatic triacylglyceride (TG) levels in WT and LRRC58KD mice. LRRC58KD, n = 11 male mice; scr, n = 11 male mice. j, Hepatic abundance of fatty acyl-carnitines in WT and LRRC58KD mice. LRRC58KD, n = 12 male mice; scr, n = 11 male mice. k, Hepatic cholesterol levels measured in DO mice livers with highest (top 8%) LRRC58 abundance compared with lowest (bottom 8%) LRRC58 abundance. Two-tailed Student’s t-test for pairwise comparisons (ak). Data are mean ± s.e.m. Source Data
Extended Data Fig. 1
Extended Data Fig. 1. MPCA technical quality evaluation and recapitulation of RHEA reactions.
(a) Sample preparation workflow for DO proteomics. Created in BioRender. Xiao, H. (2025) https://BioRender.com/c8oe3gt. (b) PCA plots showing samples from repeated proteomics measurements in BAT, colored by sample ID and measurement batch. (c) PCA plots showing samples from repeated proteomics measurements in liver, colored by sample ID and measurement batch. (d) Overview of relative metabolite abundance (log2 sample-bridge ratio) in both BAT and liver of all samples measured in this study. Mock samples were the same as pools, which were spiked in every ~50 runs in the sequence to assess instrument performance (see Methods for details). The center of the boxplot is median, the box bounds show the 25th to 75th percentile interquartile range (IQR), and the minimum and maximum values are 1.5 times the IQR. n = 163 mice. (e) The proteome depth in MPCA compared to previous deep mouse BAT and liver proteomics reports,,,. (f) Proteomics and metabolomics data completeness in BAT and liver. (g) DO cohort exhibit higher protein abundance variation proteome-wide in BAT and liver compared to isogenic cohorts. C57BL/6 data obtained from Yu et al.. (h) DO cohort exhibited higher metabolite abundance variation in BAT and liver compared to isogenic cohorts. BAT C57BL/6 data obtained from Jung et al., liver C57BL/6 data obtained from Xiao et al.. (i) Enzyme-substrate and enzyme-product edges generated from RHEA. (j) Ancestry analysis (see Methods for details). All metabolites were annotated by the following Chemical Entities of Biological Interest (ChEBI) IDs: the ChEBI IDs of the metabolite itself; the ChEBI IDs of its conjugate acids and/or bases; the ChEBI IDs of its salt adducts; the ChEBI IDs of the metabolite with different charge states; and ChEBI IDs of chemicals that have the same chemical formula and structure but named differently. Both primary and secondary ChEBI IDs were extracted. These IDs were then used for ancestry mapping using the ancestry mapping table provided by ChEBI, in order to match a subset of entries in databases that do not use IDs at the bottom of the ChEBI hierarchy. The first 6 levels of IDs in the ChEBI hierarchy were not used for ancestry mapping due to the ambiguous nature. This analysis was to prepare metabolites for mapping onto established databases, as ChEBI IDs are universal metabolite identifiers for most databases. (k) MPCA edges recapitulate 27% of all RHEA edges involving molecules measured in MPCA. (l) Recapitulation of established biochemical reactions using significant metabolite-protein correlations in BAT and liver. (m) MPCA recapitulation of RHEA reaction 15565 and 67440, deacylation of N-acetyl-L-methionine. n = 163 mice. (n) MPCA recapitulation of RHEA reaction 24388, dephosphorylation of uridine and its subsequent conversion to uracil. RHEA reaction 16825/27650 were indirectly recapitulated. n = 163 mice. (One-sided Fisher’s exact test in l, two-sided Pearson correlation test with Benjamini-Hochberg p value correction in m, n; error bands in m and n represent 95% confidence interval.).
Extended Data Fig. 2
Extended Data Fig. 2. MPCA edges recapitulate metabolite-transporter relationships.
(a) Metabolite-transporter relationship as a form of metabolite-protein co-regulation. (b) MPCA edges recapitulate 26% of all protein-metabolite edges in the transporter classification database (TCDB) involving molecules measured in MPCA. (c) Visualization of TCDB transporter-metabolite relationships recapitulated by MPCA edges. (d) Examples of TCDB transporter-metabolite relationships recapitulated by MPCA edges. (e) Pairwise correlations between glucose and HK1, HK2, HK3, SLC2A1, SLC2A3, and SLC2A4. (f) Pairwise correlations between ornithine and OAT, OTC, SLC22A15, and SLC7A2. (g) Shared and unique protein-metabolite edges in BAT and liver. (h) The average number of TCDB transporters each metabolite has. All- all metabolites; TCDB mapped- metabolites that have their TCDB transporters mapped in MPCA; TCDB-unmapped- metabolites that did not have their TCDB transporters mapped in MPCA.
Extended Data Fig. 3
Extended Data Fig. 3. Analysis of factors that underlie significant protein-metabolite correlations in MPCA.
(a) Correlation between the number of significant correlations between each MPA metabolite with proteins and the degree of variation that this metabolite exhibited in the cohort. (b) Correlation between the number of significant RHEA edges and the number of total RHEA edges of a metabolite in MPCA. (c) Enrichment of mitochondrial proteins, metabolite enzymes, and kinases among protein nodes of all MPA edges in BAT. (d) Enrichment of mitochondrial proteins, metabolite enzymes, and kinases among protein nodes of all MPCA edges in liver. (e) Pathway-level regulation as a form of metabolite-protein functional co-regulation. (f) MPCA edges recapitulated 33% of all protein-metabolite edges in Reactome involving molecules measured in MPCA. (g) Recapitulation of established metabolite-protein relationships in Reactome pathways using significant metabolite-protein correlations in BAT and liver. (h) Correlation between the abundance of TCA cycle intermediary metabolites succinate, α-ketoglutarate, citrate/isocitrate, fumarate, malate, as well as co-factor NAD+, with TCA cycle enzymes. (i) Glucose abundance negatively correlated with the abundance of glycolysis enzymes. (One-sided Fisher’s exact test in c, d, and g, P values were not adjusted).
Extended Data Fig. 4
Extended Data Fig. 4. Statistical properties of pairwise correlations in MPCA.
(a) Linking accessory proteins and metabolites of known Reactome pathways. Red nodes, known members of established networks; blue nodes, neighboring proteins or metabolites; orange node, the protein or metabolite to test; gray nodes, all other proteins and metabolites in MPCA. (b) Reactome pathways and newly identified accessory proteins in BAT. (c) Reactome pathways and newly identified accessory proteins in liver. (d) TCA cycle with an accessory metabolite in BAT. (e) Glutathione synthesis and recycling pathway with accessory members in liver. (f) Fold enrichment over random selection of MPCA pairwise correlations recapitulating physical interactions in RHEA and TCDB. MPCA correlations were filtered to contain proteins and metabolites existing in RHEA and TCDB. (g) Rank of metabolites measured in MPCA based on the number of protein-metabolite intractions in RHEA and TCDB. (h) Fold enrichment over random selection of MPCA edges involving ADP, NAD, and AMP recapitulating physical interactions in RHEA and TCDB, compared to all other edges. (i) Schematic of “hop” analysis to examine physical interactions and non-specific interactions underlying protein-metabolite correlations in MPCA. (j) The number of protein-metabolite edges included in each “hop”, 1-hop means physical interactions. The percentage annotates proportion of all possible protein-metabolite edges. (k) Fold enrichment over random selection of MPCA edges recapitulating physical interactions in RHEA and TCDB, compared to non-specific interactions introduced from the “hop” analysis. Fold enrichment normalized to 2-hop. (l) Fold enrichment over random selection of MPCA edges recapitulating physical interactions in RHEA and TCDB, compared to non-specific interactions introduced from the “hop” analysis. Fold enrichment normalized to 3-hop. (m) ROC curves of pairwise correlation analysis (gray), LASSO analysis (red, referring to Fig. 2a), and null distribution (black). AUC- area under the curve. (n) PR curves of pairwise correlation analysis (gray), LASSO analysis (red, referring to Fig. 2a). AP- average precision. (One-sided Fisher’s exact test with Benjamini-Hochberg p value correction in d,e).
Extended Data Fig. 5
Extended Data Fig. 5. Statistical properties of LASSO analysis in MPCA.
(a) Evaluation of LASSO associations with global FDR q < 0.05. P-values were calculated by performing ordinary least squares (OLS) on those selected variables from LASSO, and p-values were computed from the OLS model using a two-sided t-test. FDR values were calculated by adjusting P-values with the Benjamini-Hochberg procedure. FDR q < 0.05 was considered significant. (b) Number and percentage of LASSO associations in BAT and liver that reached global FDR q < 0.05. (c) Enrichment over random selection of significant LASSO associations in BAT and liver in recapitulating physical interactions between proteins and metabolites in RHEA and TCDB. (d) Top1 LASSO predictors of metabolites with literature evidence in liver. (e) Top1 LASSO predictors of metabolites with literature evidence in BAT. (f) Extreme outliers in LASSO analysis identified in BAT. (g) Extreme outliers in LASSO analysis identified in liver. (h) LASSO Coefficient of the CDO1-hypotaurine edge. (i) LASSO Coefficient of the TYMP-thymine edge. (j) LASSO Coefficient of the PCY2-CTP-ethanolamine edge. (k) Percent of extreme outliers in BAT and liver with literature evidence. (l) Extreme outlier edges involving CML1, ACY3, and acetylated amino acids. (m) Validation score of metabolites in MPCA. For each metabolite, LASSO edges with literature evidence in RHEA, TCDB, and Reactome were counted. This was then used to linearly scale, in each tissue, to a score from 1–10 based on the number of recapitulated LASSO edges all the other metabolites have. The score from both tissues were then summed up to produce an overall validation score for each metabolite. (n) Annotation of putative function of LASSO protein predictors of metabolites. LASSO hits for each metabolite were mapped onto CORUM and BioPlex. If a newfound LASSO protein predictor of a metabolite physically interacts with a protein known to regulate this metabolite via a known RHEA, TCDB, or Reactome network, then the LASSO hit was listed as potentially regulating the metabolite through the known network (Supplementary Table 5c). (o) Annotation of LASSO protein predictors of metabolites based on whether the proteins were known to be metabolic enzymes, transporters, and mitochondrial proteins. (p) Top 10 proteins in BAT and liver that predicted the highest number of metabolites. (OLS modeling for selected LASSO variables and two-sided t-test to calculate P values. P values adjusted by the Benjamini-Hochberg procedure in a, d, e, h-j, l).
Extended Data Fig. 6
Extended Data Fig. 6. Genetic manipulation of LRRC58 in the context of hypotaurine-taurine pathway.
(a) Correlation between hypotaurine abundance calculated from LASSO prediction and hypotaurine abundance measured in BAT. n = 163 mice. (b) LASSO regression to predict hypotaurine abundance in the liver. CDO1- cysteine dioxygenase type 1; CSAD - cysteine sulfinic acid decarboxylase; FMO1- flavin containing monooxygenase 1. LRRC58 was not included in liver analysis due to its low abundance leading to 59 missing values out of 163 samples in total. Hypotaurine measurement was missing in the liver of one mouse. n = 162 mice. (c) Correlation between hypotaurine abundance calculated from LASSO prediction and hypotaurine abundance measured in liver. n = 162 mice. (d) Protein abundance of LRRC58 in scramble (scr) compared to LRRC58 siRNA A (LRRC58siA) and siRNA B (LRRC58siB)-treated primary brown adipocytes. n = 4 cell replicates for scr and LRRC58siA; n = 3 cell replicates for LRRC58siB. Data replotted from Fig. 3a. (e) Left: metabolite abundance profiling comparing scramble (scr) to LRRC58 siRNA A (LRRC58siA)-treated primary brown adipocytes. n = 4 cell replicates. Right: metabolite abundance profiling comparing scramble (scr) to LRRC58 siRNA B (LRRC58siB)-treated primary brown adipocytes. n = 4 cell replicates. (f) Transcript abundance of Lrrc58 in scramble (scr) compared to LRRC58siA and LRRC58siB-treated primary hepatocytes. n = 3 cell replicates. (g) Left: metabolite abundance profiling comparing scramble (scr) to LRRC58 siRNA A (LRRC58siA)-treated primary hepatocytes. n = 4 cell replicates. Left: metabolite abundance profiling comparing scramble (scr) to LRRC58 siRNA B (LRRC58siB)-treated primary hepatocytes. n = 4 cell replicates. (h) Protein abundance of LRRC58 in wild type (WT) compared LRRC58 overexpression (LRRC58OE) in Hep G2. n = 4 cell replicates. Data replotted from Fig. 3e. (i) Metabolite abundance profiling comparing wildtype (WT) to LRRC58 overexpression (LRRC58OE) Hep G2 cells. n = 4 cell replicates. (j) Transcript abundance of Lrrc58 in scramble (scr) compared to LRRC58 siRNA A (LRRC58siA)-treated primary hepatocytes for the tracing experiments. n = 3 cell replicates. (k) Schematic of tracing cysteine metabolism to taurine in scramble (scr) and LRRC58KD primary hepatocytes. Cells were treated for 30 min with 200 µM 13C615N2-labeled L-cystine. 13C315N1-L-cysteine, 13C215N1-hypotaurine, and 13C215N1-taurine are the expected major forms of isotope-labeled downstream metabolites in the hypotaurine-taurine pathway. (l) Transcript abundance of Lrrc58 and CDO1 in scramble (scr) compared to LRRC58siA, CDO1siA, and LRRC58siA + CDO1siA -treated primary hepatocytes. n = 4 cell replicates. (m) Hypotaurine, taurine and L-cysteine abundance in scramble (scr) compared to LRRC58siA, CDO1siA, and LRRC58siA + CDO1siA -treated primary hepatocytes. n = 6 cell replicates. (n, o) AP-MS of CDO1 and CUL5 from BioPlex 3.0. CompPASS plus score ranges from 0-1, and a score of 1 represents the highest confidence for identification of a physical interactor. Normalized weighted D (NWD) score takes account of the selectivity of the interaction. A higher NWD score indicates higher selectivity of the interaction. LRRC58 was identified in only 5 out of all 10,128 experiments in BioPlex 3.0. n = 2 technical replicates. (p) AP-MS of LRRC58 in LRRC58 overexpression (LRRC58OE) Hep G2 cells (see Methods). Protein abundance presented by summed MS1 peak area. n = 4 cell replicates for LRRC58OE. n = 1 cell replicate for background control. (q) Interactions between LRRC58, CDO1, CUL5, ELOB, and ELOC based on literature evidence and experimental data. (two-sided Pearson correlation test in a with no multiple comparison adjustment; two-tailed Student’s t-test for pairwise comparisons in d-j, l, and m with no multiple comparison adjustment. P < 0.05 considered significant). Data presented as mean ± s.e.m., error band in a and c represent 95% confidence interval.
Extended Data Fig. 7
Extended Data Fig. 7. LRRC58 regulates CDO1 protein abundance.
(a) Alphafold-Multimer modeling of direct physical interaction interface between CDO1 and LRRC58. The predicted local distance difference test (pLDDT) was used to examine the confidence of prediction. High pLDDT scores indicate high confidence of the amino acid residue structure. A score over 90 represents the highest confidence level; a score between 70–90 represents residues well-modeled with good backbone prediction; a score between 50–70 is of lower confidence and should be treated with caution; and score of lower than 50 indicates a low confidence prediction. (b) Predicted aligned error (PAE) plot of the interfaces between LRRC58 and CDO1. (c) CDO1 protein abundance in wildtype (WT), LRRC58 overexpression (LRRC58OE), scramble (scr), and LRRC58 knockdown (LRRC58KD) in Hep G2 cells. Representative blot from n = 3 cell replicate experiments shown. (d) Transcript abundance of Lrrc58 in scramble (scr) compared to LRRC58 siRNA-treated primary hepatocytes for western blot analysis in panel e. n = 3 cell replicates. (e) Abundance of CDO1 protein in response to LRRC58 depletion in primary hepatocytes. Representative blot from n = 3 cell replicate experiments shown. (f) Time course of CDO1 protein abundance in response to inhibition of the proteasome with MG132 in primary hepatocytes. Representative blot from n = 3 cell replicate experiments shown. (g) Time course of CDO1 protein abundance in response to inhibition of the proteasome with Bortezomib in primary hepatocytes. Representative blot from n = 3 cell replicate experiments shown. (h) Time course of CDO1 protein abundance in response to NEDD8-activating enzyme (NAE) inhibition with MLN4924 in scramble (scr) and LRRC58 knockdown (LRRC58KD) primary hepatocytes. n = 2 cell replicates. (i) Time course of CDO1 protein abundance in response to MLN-4924 in primary hepatocytes. Representative blot from n = 3 cell replicate experiments shown. (j) Time course of CDO1 protein abundance in response to scramble (scr) and LRRC58 knockdown (LRRC58KD) primary hepatocytes. n = 2 cell replicates. (k) Time course of CDO1 protein abundance in response to inhibition of autophagy with chloroquine in primary hepatocytes. Representative blot from n = 3 cell replicate experiments shown. (l) Time course of CDO1 protein abundance in response to inhibition of protein synthesis with cycloheximide in scramble (scr) and LRRC58 knockdown (LRRC58KD) primary hepatocytes. n = 2 cell replicates. (m) Co-evolving partners of Cdo1 gene based on clades, which represent unbroken lines of evolutionary descent. A -log10 transformed CladeOScope score of 0 represents the top co-evolving gene partner. (n) Co-evolving partners of Lrrc58 gene based on clades, which represent unbroken lines of evolutionary descent. A -log10 transformed CladeOScope score of 0 represents the top co-evolving gene partner. (two-tailed Student’s t-test for pairwise comparisons in d). Data presented as mean ± s.e.m.
Extended Data Fig. 8
Extended Data Fig. 8. Cysteine is a signal regulating LRRC58-mediated CDO1 degradation.
(a) Schema of CDO1 post-translational stability reporter including PGK promoter, CDO1-GFP fusion, internal ribosome entry sequence (IRES) and mCherry for transcriptional normalization. (b) Post-translational stability of CDO1 reporter in Hep G2 cells following transfection with siRNA targeting LRRC58 or scramble control (left) or overexpression of LRRC58 (right). n = 3 cell replicates. (c,e) Post-translational stability of CDO1 reporter in Hep G2 cells cultured in media without cystine and with the following compounds added for 26 h. n = 3 cell replicates except n = 6 for 0 mM cystine. Data are normalized to media without cystine. (d,f) Post-translational stability of CDO1 reporter in Hep G2 cells cultured in media with 0.1 mM cystine (equivalent to 0.2 mM cysteine; except the positive control without cystine) and with the following compounds added for 26 h. n = 6 for 0 and 0.2 mM cystine and n = 3 for other treatments. Data are normalized to 0.1 mM cystine media without further treatment. (g) Post-translational stability of the CDO1-GFP reporter or an empty vector (GFP-only) reporter after exposure to media with 0.1 mM cystine supplementation (equivalent to 0.2 mM cysteine), or media without cystine for 24 h. Data for each reporter are normalized to the 0.1 mM condition. n = 3 cell replicates. (h) Comparison of CDO1 abundance in primary hepatocytes cultured under cystine control (0.1 mM, equivalent to 0.2 mM cysteine), 0 mM cystine, or cystine supplementation (0.2 mM, equivalent to 0.4 mM cysteine). n = 7 (Control), n = 5 (0 mM cystine), and n = 3 (0.2 mM cystine) cell replicates. (i) Transcript abundance of Lrrc58 and Cdo1 in primary hepatocytes cultured under cystine control (0.1 mM, equivalent to 0.2 mM cysteine), 0 mM cystine, or cystine supplementation (0.2 mM, equivalent to 0.4 mM cysteine,). n = 3 (Control), n = 3 (0 mM cystine), and n = 3 (0.2 mM cystine) cell replicates. (j) CDO1-GFP/mCherry ratio of WT and 7Ala-CDO1 GFP fusions in media lacking cystine. n = 4 cell replicates. (k) Alphafold predicted structure of interaction between LRRC58 (blue), ELOB (white), and ELOC (tan). The putative ELOB-binding domain containing residues 256–291 of LRRC58 is teal. (l) Co-IP of FLAG-LRRC58 (WT) and FLAG-LRRC58∆256-291 expressed in Hep G2 cells. Immunoblots of CUL5, ELOB, ELOC, FLAG and vinculin are shown for the IP and input. Results are representative of 3 independent experiments. (m) CDO1-GFP/mCherry ratio of LRRC58WT and LRRC58∆256-291 expressing Hep G2 cells under cysteine restriction. n = 4 cell replicates. Statistics relative to untransduced. (two-tailed Student’s t-test for pairwise comparisons in b-j. b (left), c-h, and j were corrected with Bonferroni Dunn test). Data presented as mean ± s.e.m.
Extended Data Fig. 9
Extended Data Fig. 9. Proteomic and metabolomic changes in response to LRRC58 depletion in mouse liver.
(a) Scheme for investigating liver cysteine, cholesterol, total triglycerides (TG), and bile acid levels in response to liver-specific LRRC58KD in vivo. Created in BioRender. Xiao, H. (2025) https://BioRender.com/zub3s1i. (b) Transcript abundance of LRRC58 in scramble (scr) compared to LRRC58KD in the liver. n = 11 male mice, LRRC58KD n = 12 male mice. (c) Transcript abundance of LRRC58 in scramble (scr) compared to LRRC58KD in other tissues. n = 4 male mice. (d, e) Hepatic taurine and hypotaurine abundance in scramble (scr) compared to LRRC58KD mice. Scramble (scr) n = 11 male mice, LRRC58KD n = 12 male mice. (f) Schema of stable isotope tracing using labeled 13C615N2 -cystine to evaluate taurine flux in vivo following liver-specific LRRC58KD. Created in BioRender. Xiao, H. (2025) https://BioRender.com/1yuzp7v. (g) Transcript abundance of Lrrc58 in scramble (scr) compared to LRRC58KD in the liver of mice used for L-cystine (13C6 15N2) tracing experiments. n = 9 male mice, LRRC58KD n = 10 male mice. (h) Abundance of fatty acid species in the liver of scramble (scr) compared to LRRC58KD mice. Scramble (scr) n = 11 male mice, LRRC58KD n = 12 male mice. (i) Comparison of taurochenodeoxycholic acid, tauro-beta-muricholic acid, and taurocholic acid abundance in scramble (SCR) compared to LRRC58KD, and LRRC58KD + CDO1KD primary hepatocytes. n = 6 cell. (j) Cholesterol levels in scramble (scr) compared to LRRC58KD, and LRRC58KD + CDO1KD primary hepatocytes. n = 4 cell. (two-tailed Student’s t-test for pairwise comparisons in b-e & g-j). Data presented as mean ± s.e.m. Source Data
Extended Data Fig. 10
Extended Data Fig. 10. Proteomic and metabolomic consequences of natural variation in LRRC58 abundance in DO mice.
(a) Liver protein abundance comparing DO mice with the bottom 10% LRRC58 abundance to those with top 10% LRRC58 abundance. n = 12 mice bottom 10%; n = 11 mice top 10%. (b) Gene ontology biological processes enriched in mice with bottom 10% LRRC58 abundance. (c) Gene ontology biological processes enriched in mice with top 10% LRRC58 abundance. (d) Disease networks enriched in mice with top 10% LRRC58 expression. (e) Single nucleotide polymorphisms of Lrrc58 in DO founder strains with C57BL/6j as the reference. (f) Single nucleotide polymorphisms of Cdo1 in DO founder strains with C57BL/6j as the reference. (two-tailed Student’s t-test for pairwise comparisons in a; one-sided Fisher’s exact test in b-d).

References

    1. Stipanuk, M. H., Dominy, J. E. Jr, Lee, J. I. & Coloso, R. M. Mammalian cysteine metabolism: new insights into regulation of cysteine metabolism. J. Nutr.136, 1652S–1659S (2006). - PubMed
    1. Hofmann, A. F. The continuing importance of bile acids in liver and intestinal disease. Arch. Intern. Med.159, 2647–2658 (1999). - PubMed
    1. Chubukov, V., Gerosa, L., Kochanowski, K. & Sauer, U. Coordination of microbial metabolism. Nat. Rev. Microbiol.12, 327–340 (2014). - PubMed
    1. Ljungdahl, P. O. & Daignan-Fornier, B. Regulation of amino acid, nucleotide, and phosphate metabolism in Saccharomyces cerevisiae. Genetics190, 885–929 (2012). - PMC - PubMed
    1. Hicks, K. G. et al. Protein–metabolite interactomics of carbohydrate metabolism reveal regulation of lactate dehydrogenase. Science379, 996–1003 (2023). - PMC - PubMed

LinkOut - more resources