. 2025 Nov;647(8088):257-267.
doi: 10.1038/s41586-025-09503-z. Epub 2025 Sep 17.

Basal cell of origin resolves neuroendocrine-tuft lineage plasticity in cancer

Affiliations

Basal cell of origin resolves neuroendocrine-tuft lineage plasticity in cancer

Abbie S Ireland et al. Nature. 2025 Nov.

Abstract

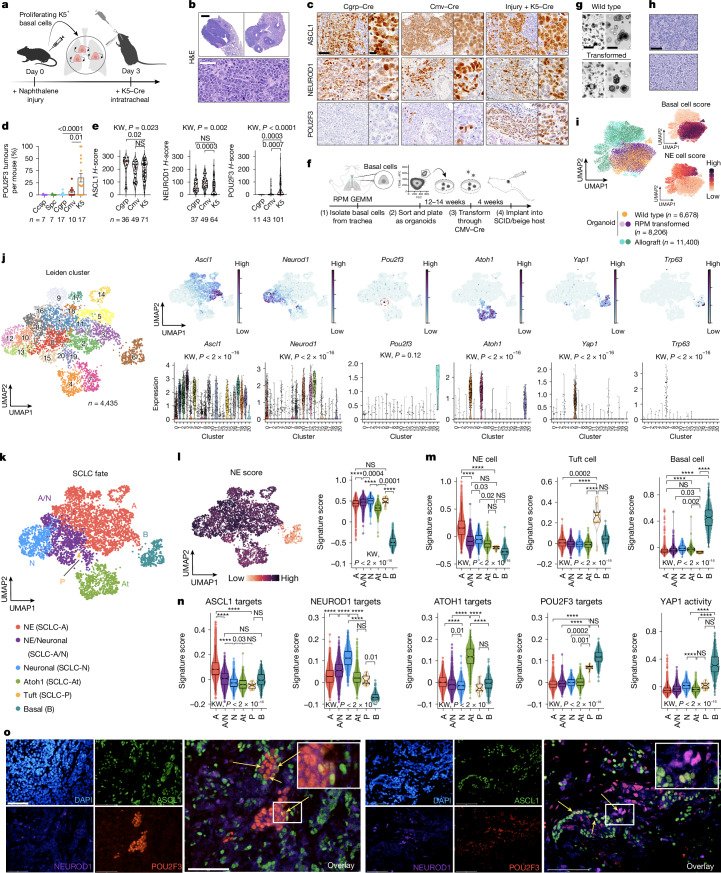
Neuroendocrine and tuft cells are rare chemosensory epithelial lineages defined by the expression of ASCL1 and POU2F3 transcription factors, respectively. Neuroendocrine cancers, including small cell lung cancer (SCLC), frequently display tuft-like subsets, a feature linked to poor patient outcomes1-9. The mechanisms driving neuroendocrine-tuft tumour heterogeneity and the origins of tuft-like cancers are unknown. Using multiple genetically engineered animal models of SCLC, we demonstrate that a basal cell of origin (but not the accepted neuroendocrine origin) generates neuroendocrine-tuft-like tumours that highly recapitulate human SCLC. Single-cell clonal analyses of basal-derived SCLC further uncovered unexpected transcriptional states, including an Atoh1+ state, and lineage trajectories underlying neuroendocrine-tuft plasticity. Uniquely in basal cells, the introduction of genetic alterations enriched in human tuft-like SCLC, including high MYC, PTEN loss and ASCL1 suppression, cooperates to promote tuft-like tumours. Transcriptomics of 944 human SCLCs revealed a basal-like subset and a tuft-ionocyte-like state that altogether demonstrate notable conservation between cancer states and normal basal cell injury response mechanisms10-13. Together, these data indicate that the basal cell is a probable origin for SCLC and other neuroendocrine-tuft cancers that can explain neuroendocrine-tuft heterogeneity, offering new insights for targeting lineage plasticity.


Conflict of interest statement

Competing interests: T.G.O. has a patent related to SCLC subtypes (US12188095-B2), a sponsored research agreement with Auron Therapeutics, has consulted for Nuage Therapeutics and Light Horse Therapeutics and served on the Scientific Advisory Board (SAB) for Lung Cancer Research Foundation and as a consulting editor for Cancer Research and Genes & Development. C.M.R. has consulted regarding oncology drug development with AbbVie, Amgen, AstraZeneca, Boehringer Ingelheim and Jazz, and receives licencing fees for DLL3-directed therapies. He serves on the SABs of Auron Therapeutics, DISCO, EARLI and Harpoon Therapeutics. A.D. serves on SABs for Jazz, AstraZeneca and Amgen. A.E. reports employment and stock options with Caris Life Sciences. J.M.C. has consulted for Sonata Therapeutics. A.T. received grants to the NCI from EMD Serono Research and Development, AstraZeneca, Gilead Sciences and ProLynx. J.C.M. has consulted for IQVIA, Genome Insights, Incyte, Novotech, Red Arrow Therapeutics, Pfizer, Vilya, Replimune and Iovance, and received honoraria from and advised for Caris Life Sciences. D.R.T. is on the SAB of Vrise Therapeutics. S.P. has consulted for Amgen, Bristol Myers Squibb, Daiichi Sankyo, Johnson & Johnson, Novocure, OncoHost and Takeda Pharmaceuticals. The other authors declare no competing interests. Diversity, equity, ethics, and inclusion: We included sex balance in the selection of human and non-human participants. One or more authors of this paper self-identify as people from sexual and gender minorities.

Figures

Fig. 1
Fig. 1. Basal cells permit SCLC subtype diversity.
a, Schematic of SCLC induction in RPM GEMMs with basal-specific Cre. b, RPM K5–Cre tumour haematoxylin and eosin (H&E): whole lobes (top) and tumour morphology (bottom). c, Immunohistochemistry for indicated proteins in RPM tumours from indicated Ad–Cre. K5–Cre mice pretreated with naphthalene injury. d, POU2F3+ tumours (H-score above 50) per lung per mouse (n indicated) by Ad–Cre. One-way analysis of variance (ANOVA) with post hoc Tukey’s P values shown. Error bars = mean ± s.e.m. e, H-score quantification of RPM tumours for indicated markers by Ad–Cre. Tumour number indicated; n = 4–18 mice per group. f, Schematic of RPM basal organoid and allograft generation. g, Bright-field images of RPM organoids pre- (wild type) and post-CMV–Cre (transformed). h, H&E of RPM allografts with classic (top) or variant (bottom) histology. i, scRNA-seq UMAP from wild type (n = 1) and RPM basal organoids (n = 2) and the resulting RPM allografts (n = 2 independent experiments) with basal versus NE cell signature enrichment. Cell number analysed per sample is indicated. j, Left, Leiden clusters in UMAP of downsampled RPM allografts (n = 2 independent experiments; n = 4,435 cells; Supplementary Table 1). Right, expression of indicated genes in UMAP (top) and by Leiden clusters (bottom). Red circle, Pou2f3+ cluster 20. k, UMAP in j annotated by SCLC fate. ln, UMAP in j of NE score (l) and violin plots of NE score (l), NE/tuft/basal cell signatures (m) and ChIP–seq targets and YAP1 activity by SCLC fate (n) (Supplementary Table 2). o, Co-immunofluorescence for DAPI (nuclei) and indicated proteins in RPM allografts. Yellow arrows mark co-expressing cells. Violin plots show median and upper/lower quartiles. Unless otherwise noted, statistics are Kruskal–Wallis (KW) tests with post hoc uncorrected (e) or Bonferroni-corrected (ln) Dunn’s pairwise comparisons. ****P < 2 × 10−16; NS, not significant (P > 0.05); other P values indicated. Scale bars: 1 mm (b, top), 50 μm (b, bottom, c,h), 10 μm (c, insets), 650 μm (g, left), 275 μm (g, right), 75 μm (o). Schematics in a and f were created using BioRender (https://biorender.com). Source data
Fig. 2
Fig. 2. ASCL1 loss promotes POU2F3 tuft-like SCLC.
a, H&E of RPMA allograft tumours from SCID/beige mice showing SCLC (top) or NSCLC (bottom) histology. b, Immunohistochemistry (left) and H-score quantification (right) of indicated proteins in RPM (SCLC only) and RPMA (SCLC-dominant or NSCLC-dominant; more than 50% area); n = 8–13 first-passage tumours from n = 4–10 mice per genotype. One-way ANOVA with post hoc Fisher’s least significant difference (LSD) pairwise comparisons. Error bars, mean ± s.d. c, Immunoblot of RPM (n = 2) versus RPMA allografts (n = 3 tumours); HSP90, loading control. For gel source data, see Supplementary Fig. 1. d, Co-immunofluorescence for DAPI (nuclei) and indicated proteins in RPMA allografts. Merge, NEUROD1 and POU2F3. e, scRNA-seq UMAP from RPM (n = 3 tumours in n = 3 samples) and RPMA allografts (n = 3 pooled tumours in n = 1 sample) with cell number indicated. f, UMAP in e annotated by Leiden cluster (Supplementary Table 3); percentage of total cells per sample per cluster (right). g, Dot plot of indicated marker genes grouped by cluster in f; dot colour, expression; dot size, percentage-expressing. Pie charts show RPM and RPMA proportions per cluster. h, UMAP in e coloured by SCLC fate (left); percentage of cells per sample per fate (right). i, UMAP in e by NE score (left); violin plots by fate or genotype (right). j, UMAPs in e and violin plots (insets) for ChIP targets or activity scores. Two-sided Wilcoxon rank-sum tests. k, UMAPs in e and violin plots for normal NE, tuft and basal cell signatures by fate. l, Violin plots of SCLC archetype signatures by fate (Supplementary Table 2). Violin plots show median ± quartiles. Unless otherwise stated, statistics are by Kruskal–Wallis tests with post hoc Dunn’s and Bonferroni correction for pairwise comparisons. ****P < 0.0001; NS (P > 0.05); other exact P values indicated. Max, maximum; Mes., mesenchymal; Min, minimum; Prolif., proliferating. Scale bars, 50 μm (a,b), 75 μm (d). Source data
Fig. 3
Fig. 3. Lineage tracing reveals SCLC trajectories.
a, Schematic of CellTagging in RPM and RPMA basal organoids and allografts. CellTagged organoids (pre-Cre and post-Cre) were collected for scRNA-seq at implant time; n = 1 RPMA, n = 1 RPM (pre-Cre) and n = 2 RPM (post-Cre) tumours (representing independent experimental replicates) were sequenced for clonal analyses. b, Fluorescence images of transformed CellTagged RPM organoids (similar results obtained in n = 4 independent CellTagging experiments). c, ForceAtlas2 (FA) map of RPM and RPMA tumours (from Fig. 2f,h) by Leiden cluster per genotype (top, Supplementary Table 3) or fate (bottom). d, Leiden cluster frequencies per clone. Each bar represents one clone. Clonal patterns, genotype and CellTag method are shown on the x axis. Individual clones are shown in Extended Data Fig. 6b,c and CellTag annotations in Supplementary Table 4. e, ForceAtlas2 maps of main RPM and RPMA clonal patterns in d. f, ForceAtlas2 maps of main clonal patterns in e, annotated by SCLC fate in c. g, ForceAtlas2 map coloured by pseudotime (start = basal-enriched cluster 17). h, ForceAtlas2 maps of main clonal patterns in e, annotated by pseudotime in g and fate in c. Straight arrows denote state transitions; circular arrows denote self-renewal within a fate. i, CellRank plots of fate probabilities in RPM and RPMA tumour cells in c, annotated by SCLC fate (left) or Leiden cluster (right). Cells arranged inside the circle according to fate probability, with fate-biased cells next to their corresponding edge and naive cells in the middle. j, CellRank-predicted expression trends of putative driver genes (Supplementary Table 5), plotted along pseudotime trajectories from basal to indicated fates/Leiden clusters. Scale bars: 650 μm (b, left), 275 μm (b, right). Schematic in a was created using BioRender (https://biorender.com).
Fig. 4
Fig. 4. PTEN loss and MYC cooperate to drive SCLC-P.
a, Expression of POU2F3 or ASCL1 (log2[TPM + 1]) and MYC or PTEN copy number (log2 ratio) in n = 112 human SCLC tumours grouped by POU2F3 status (n = 96 low; n = 16 high). Data were from ref. . The median (dashed red) and quartiles (dotted lines) are shown. Two-tailed Mann–Whitney U-test with the exact P values indicated. b, Schematic of RPM and RPMA basal organoid/allograft generation with Pten loss. c, Immunohistochemistry images (left) and H-score quantification (right) of RPM and RPMA allografts (including multi-passage) with LCV2–sgControl or sgPten. Ctrl, parental + sgControl. All tumours are SCLC-dominant (50% or more), except the NSCLC-dominant (only from RPMA) on the far right of the bar graph. A total of 10–17 tumours quantified from n = 5–12 mice per genotype. One-way ANOVA with post hoc Fisher’s LSD multiple comparisons. Error bars, mean ± s.d. d, Linear regression of pAKT versus POU2F3 H-scores in RPM (n = 13) and RPMA (n = 13) allografts. Control, parental + sgControl. The goodness of fit (R2) and P value are shown. e, Schematic of SCLC induction in RPP GEMMs through K5–Cre. f, Immunohistochemistry for SCLC subtype markers in RPP tumours grouped by Ad–Cre. K5–Cre mice pretreated with naphthalene ‘injury’. g, POU2F3 H-scores in RPM versus RPP tumours by indicated Ad–Cre. Exact tumour number indicated from n = 4–18 mice per group. Median, red bar; quartiles, solid lines. Statistics are by Kruskal–Wallis test with post hoc Dunn’s pairwise comparisons. h, Immunohistochemistry on serial K5–Cre RPP tumour sections for indicated proteins in high-MYC, medium-MYC and low-MYC regions. i, Linear regression of MYC versus POU2F3 H-scores in n = 21 tumours from n = 4 K5–Cre RPP mice; R2 and P value are shown. ****P < 0.0001; NS (P > 0.05); other exact P values are indicated. Scale bars: 50 µm unless stated (c,f,h) and 10 µm (f, insets). Schematics in b and e were created using BioRender (https://biorender.com). Source data
Fig. 5
Fig. 5. Inflammatory basal state of human SCLC.
a, Heat map of bulk RNA sequencing (RNA-seq) expression in n = 944 human SCLC biopsies (Supplementary Table 8) for indicated genes or signatures, grouped by subtype and ordered by basal signature score. b, As in a, with YAP1 subtype included. c, Spearman correlation matrix of genes and gene signatures in n = 944 SCLC tumours, including TIP genes and mouse (M) and human (H) ionocyte (iono) signatures (Supplementary Table 2). Yellow box highlights tuft/iono correlations. d, Expression of human SCLC subtype signatures (from data in a and Supplementary Table 7) in RPM/RPMA basal-derived tumours (from Fig. 2e) by UMAP or in violin plots grouped by SCLC fate. e, Pearson correlation matrix comparing enrichment scores of human SCLC subtype signatures (from four independent datasets: Caris, Liu et al., George et al. and Lissa et al.), normal lung cell type signatures (basal, tuft and NE) and ChIP–seq target signatures (A, N or P_targets) in RPM/RPMA tumour data (from Fig. 2e). f, GSEA for ‘antigen presentation’ and ‘T cell inflamed’ signatures per indicated SCLC subtype versus ‘all’ other subtypes (data from a). NES and P values were determined using Kolmogorov–Smirnov and permutation testing. g, Expression of ‘antigen presentation’ and ‘inflamed’ human SCLC signatures, in RPM and RPMA tumours (from Fig. 2e) by UMAP or in violin plots grouped by fate. h, Expression of therapeutic targets in RPM/RPMA tumours (from Fig. 2e) by UMAP or in violin plots grouped by fate. i, Graphical abstract: Waddington landscapes depict SCLC fate trajectories from NE (left) versus basal (right) origins. SCLC-Y from NE origins are transcriptionally similar to A/N cells from basal origins and are therefore omitted. The arrow thickness reflects frequency of trajectories in RPM GEMM. MYC, PTEN and ASCL1 concentrations vary by fate. All violin plots show median and upper/lower quartiles. Statistics are by Kruskall–Wallis tests and post hoc Dunn’s pairwise comparisons with Bonferroni correction. ****P < 0.0001; NS (P > 0.05); other exact P values indicated. NES, normalized enrichment score. Schematic in i was created using BioRender (https://biorender.com).
Extended Data Fig. 1
Extended Data Fig. 1. POU2F3+ tumours exhibit intratumoural subtype heterogeneity indicative of plasticity. Related to Fig. 1.
a, Representative IHC staining on human SCLC biopsies for given markers with sample name indicated. One row = one tumour. Scale bar, 25 μm. b, Venn diagram depicting number of human SCLC biopsies (n = 119 total) staining positive for ASCL1, NEUROD1, POU2F3, or lacking all markers (“Subtype-Neg”). c, Representative co-immunofluorescence (co-IF) staining on human SCLC biopsies (n = 28 total) for DAPI (nuclei, blue), ASCL1 (yellow), NEUROD1 (purple) or POU2F3 (green). Individual channels (top) and an overlay without DAPI (bottom) are shown. Scale bars, 50 μm. Yellow arrows indicate colocalization of markers. d, Representative co-IF staining on patient-derived-xenografts (n = 2 distinct models) for DAPI (nuclei, blue), ASCL1 (green), NEUROD1 (purple) or POU2F3 (red). Individual channels (left) and an overlay without DAPI (right) are shown. Yellow arrows and insets (a-b) emphasize co-expressing cells (bottom). Scale bars, 75 μm. e, Co-IF staining of tracheal and lung epithelium pre-(Day 0) and post-naphthalene (Day 3, 5, 10) for indicated markers. DAPI marks nuclei (blue), P63 and KRT5 (basal), CCSP (club), and KRT13 (hillock). K5-Cre was not administered to these mice, but the timepoint of typical K5-Cre administration in autochthonous GEMMs is indicated for ease of interpretation of cell types present at the biologically-relevant timepoint for tumour experiments. Scale bars, 10 µm. f, Quantification of positive cells per mm of epithelium in the trachea or lung epithelium, with dashed line at Day 3 (timepoint K5-Cre is typically administered in autochthonous GEMMs), showing the frequency of cells present at the theoretical time of K5-Cre administration. Statistics performed on frequency values from n = 12–58 regions of tracheal epithelium or n = 13–50 regions of lung epithelium per timepoint. Error represents mean +/- SEM. Quantification of n = ~4–12 total mm lung or n = ~13–51 total mm tracheal epithelium per timepoint per stain from n = 1–2 mice at Day 0, n = 2 mice at Day 1.5, n = 2 mice at Day 2, n = 4 mice at Day 3, n = 2 mice at Day 5, and n = 2 mice at Day 10. Source data
Extended Data Fig. 2
Extended Data Fig. 2. Basal cells give rise to SCLC with expansive subtype heterogeneity. Related to Fig. 1 and Supplementary Tables 1 and 2.
a, Survival of RPM mice infected with indicated Ad-Cre viruses. Mouse numbers in figure. Mantel-Cox log-rank test vs. K5-Cre + naphthalene (purple); exact p-values in figure. b, IHC images for indicated proteins from in situ (3–5 wks post-infection) or invasive (> 6 weeks post-infection) RPM K5-Cre tumours. Invasive tumours are most often negative for basal markers (middle row), but rare tumours have sporadic basal marker expression (bottom row). Representative of tumours from n = 10 mice. c, POU2F3 IHC H-scores by airway location and Ad-Cre virus. Each dot = 1 tumour. Kruskal-Wallis with post-hoc Dunn’s test (p-values in figure). N = 11 Cgrp, 43 Cmv, 101 K5-Cre tumours quantified (as in Fig. 1e), but split by airway location. Error represents mean ± SD. d, YAP1 IHC in RPM tumours by indicated Ad-Cre viruses (left) and H-score quantification (right). Median (red bar) and quartiles (dotted liness) indicated. KWwith post-hoc Dunn’s multiple comparisons (exact p-values in figure). Number of tumours quantified indicated on figure. e, Co-immunofluorescent (co-IF) staining for DAPI (nuclei, blue), ASCL1 (green), NEUROD1 (purple), or POU2F3 (red) in RPM K5-Cre tumours, representative of n = 5 mice. Tumour regions outlined with dashed white line. Yellow arrows indicate co-expressing cells. Scale bars, 75 μm. f, Quantification of co-expression by immunofluorescence staining for SCLC subtype markers ASCL1 (A), NEUROD1 (N), or POU2F3 (P) from n = 10 K5-Cre-initiated RPM tumours from n = 5 mice, where tumours have 1 or >1 subtype-defining transcription factor(s) (TF) detected (left). Student’s unpaired two-tailed t-test. Box and whiskers represent min, median, and max values. Percent of RPM tumour cells co-expressing the indicated subtype markers (right). One-way ANOVA with post-hoc Tukey’s. Exact p-values in figure. Each dot represents one field of a tumour. Error, mean with SEM. g, UMAP of scRNA-seq from RPM tumours: NE-derived (Cgrp-Cre, purple, n = 6 mice, 7 tumours) vs basal-derived (K5-Cre, orange, n = 2 mice, 4 tumours). Cells coloured by sample on right with number of cells analyzed indicated. h, UMAP (top) and violin plots (bottom) of selected gene expression in Cgrp- vs K5-Cre–derived tumour cells. Each dot is one cell. Two-sided Wilcoxon rank sum tests. Exact p-values indicated in figure. i, UMAP in (g) annotated by Leiden cluster (left) (Supplementary Table 1). Proportion of cells from Cgrp- vs K5-Cre tumours per Leiden cluster, as % of all cells per sample (right). j,m, Signature scores in tumour cells from (g): j, ChIP-seq targets, k, NE score, l, SCLC archetypes, or m, human SCLC subtype-specific signatures. Yellow/red diamond = mean. Two-sided Wilcoxon rank sum tests. Exact p-values indicated in figure. See Supplementary Table 2 for gene signatures. n, Stacked bar graph depicting percent of Leiden clusters as in (i) dominated by Cgrp- (purple) vs. K5-Cre (orange) initiated RPM tumour cells (left). Dot plot of top 10 differentially-expressed marker genes per Leiden cluster (Supplementary Table 1) (right). o, Violin plots of SCLC-A2 archetype or basal- or luminal-hillock signatures by Leiden cluster as in (i). Red diamond =mean. KW tests (p-value indicated on figure) and post-hoc Dunn’s with Bonferroni correction; ****p < 2e-16, other exact p-values in figure. Scale bars, 50 μm unless otherwise noted. Source data
Extended Data Fig. 3
Extended Data Fig. 3. Basal-derived GEMM organoids maintain basal identity in vitro. Related to Figs. 1 and 2.
a, Representative flow cytometry data from tracheal basal cells analyzed with a live/dead marker, ITGA6, indicated basal markers (KRT5, NGFR), and/or hillock marker (KRT13). Gating strategy includes progressive gating on cell size, singlets, and live cells (top row), followed by analysis of ITGA6 on Y-axis and indicated control (no primary) or basal marker on X-axis. Percentage of total live cells indicated in each quadrant. Quantification in upper right indicates the percentage of ITGA6+ cells specifically that co-express another basal or hillock marker based on mean fluorescence of that marker relative to all live cells. b, Recombination PCR for RPM basal organoids for indicated alleles pre- and post-treatment with TAT-Cre or Ad-CMV-Cre at two concentrations (2.5e7 or 5e7 pfu). *Organoids subject to spinoculation with CMV-Cre virus. Red font = condition selected for subsequent allografting. For gel source data, see Supplementary Fig. 1. c, Co-immunofluorescence staining (Co-IF) of wildtype “WT” basal organoids (collected within ~2 weeks of CMV-Cre transformation) and CMV-Cre-transformed basal-derived organoids (RPM, RPR2, RPMA) for DAPI (nuclei, blue), KI67 (proliferation, orange), and ASCL1 (NE, green). Positive controls (bottom panel) are an RPR2 SCLC lung tumour. Quantification via CellProfiler of KI67 positivity per organoid per genotype (bottom). Number of organoids quantified is labeled. One-way ANOVA with post-hoc Tukey’s correction. Exact p-values in figure. Error is mean ± SD. d, Co-IF of WT basal organoids and CMV-Cre-transformed basal-derived organoids (RPM, RPR2, RPMA): Left panel) DAPI (nuclei, blue), NEUROD1 (neuronal, green), P63 (basal, yellow) and KRT8 (luminal basal, red). Positive control (+) for NEUROD1 is a murine olfactory neuroblastoma tumour and for basal markers is a murine squamous lung tumour. Right panel) DAPI (nuclei, blue), FOXJ1 (ciliated, purple), CCSP (SCGB1A1, club, green) and KRT8 (luminal basal, red). Positive control (+) control for FOXJ1 and CCSP is airway from a normal mouse lung, and for KRT8 is a murine squamous lung tumour. e, Co-IF of WT basal organoids and CMV-Cre-transformed basal-derived organoids (RPM, RPR2, RPMA) for DAPI (nuclei, blue) and POU2F3 (tuft, green). Positive control (+) is a murine olfactory neuroblastoma tumour. f, Co-IF staining of WT basal organoids and RPM basal-derived organoids for DAPI (nuclei) or indicated basal markers. Positive control is murine squamous lung tumour (+). All co-IF scale bars, 150 μm. Staining results in (c-f) are representative of organoids collected from three or more independent experiments per genotype, all with similar results.
Extended Data Fig. 4
Extended Data Fig. 4. Basal-derived GEMM organoids give rise to neuroendocrine, neuronal, and tuft-like SCLC in vivo. Related to Fig. 1 and Supplementary Tables 1 and 2.
a, UMAP of scRNA-seq data from wildtype (orange, n = 1 sample) and transformed RPM basal organoids (purple, n = 2 independent samples) (left) and by Leiden cluster (right) (Supplementary Table 1), as in Fig. 1i. Number of cells analyzed in figure. b, Dot plot expression of indicated marker genes in wildtype (WT) versus transformed RPM organoids, grouped by Leiden cluster as in (a). c, UMAP of RPM organoids pre- (wildtype = “WT”) and post-CMV-Cre (“RPM”) by cell cycle phase. Proportion of cells in each phase (“frequency”), represented as % of cells per sample (right). d, UMAP as in Fig. 1i of RPM organoids pre- (“WT”) and post-CMV-Cre (“RPM”) and RPM basal allograft tumour (“Allo”) by cell cycle phase (left). Proportion of cells in each phase (“frequency”), represented as % of cells per sample (right). e, Dot plot of indicated marker genes in RPM basal allograft tumours by Leiden cluster (from Fig. 1j) (Supplementary Table 1). f, Violin plot with expression of SCLC archetype signatures where A = ASCL1, A2 = ASCL1-A2, N = NEUROD1, and P = POU2F3 (Supplementary Table 2) in RPM allograft tumour cells by Leiden cluster (from Fig. 1j). Kruskal-Wallis (KW) test (p-value in figure). g, Recombination PCR for RPR2 basal organoids for indicated alleles pre- (“None”) and post-treatment with TAT-Cre or Ad-CMV-Cre at two concentrations (2.5e7 or 5e7 pfu). *Organoids subject to spinoculation with CMV-Cre virus. Red font = condition for subsequent allografting. For gel source data, see Supplementary Fig. 1. h, Representative H&E and IHC of RPR2 basal-derived allograft tumours for indicated SCLC subtype markers (left) with H-score quantification compared to RPM basal allograft tumours (right). N = 6 RPR2 tumours per stain and n = 11 (ASCL1, POU2F3) and 8 (NEUROD1) RPM tumours quantified. Median (black line) and quartiles (dotted black lines) indicated. Scale bar, 50 μm. Welch’s two-tailed t-test. Exact p-values in figure. i, UMAP of scRNA-seq from basal-organoid-derived RPM (turquoise, n = 2) and RPR2 (maroon, n = 1 independent samples) allografts; number of cells analyzed per genotype indicated (left). UMAP and corresponding violin plots with expression of indicated SCLC subtype markers and Myc family oncogenes (right). Yellow diamond=mean expression. j, UMAP in (i) by Leiden cluster (Supplementary Table 1) (left). Proportion of cells from RPM vs RPR2 allograft tumours per Leiden cluster, as % of all cells per sample (right). k, UMAP of scRNA-seq data in (i) by NE score (left). Violin plot of NE score in RPM vs RPR2 basal allograft tumour cells, compared to Cluster 8 in (j) (right) with median and quartiles indicated. KW test with post-hoc Dunn’s (Bonferroni correction) (p-values in figure). l, UMAP of SCLC fate in RPM allograft tumours (from Fig. 1k) compared to location of RPR2 tumour cells (maroon) as in (i). m, Violin plots of SCLC archetype signatures or (n) ChIP target genes signatures (Supplementary Table 2) in RPM vs RPR2 basal allograft samples from scRNA-seq in (i). Unless otherwise noted, statistics are two-sided Wilcoxon rank-sum tests; **** p < 2.2e-16 and other exact p-values in figure. Source data
Extended Data Fig. 5
Extended Data Fig. 5. ASCL1 loss promotes POU2F3+ tuft-like SCLC. Related to Fig. 2 and Supplementary Table 3.
a, Recombination PCR for RPMA basal organoids for indicated alleles pre- (None) and post-treatment with TAT-Cre recombinase or Ad-CMV-Cre at two concentrations (2.5e7 or 5e7 pfu). *Organoids subject to spinoculation with CMV-Cre virus. Red font indicates condition used for subsequent allografting. For gel source data, see Supplementary Fig. 1. b, Quantification of tumour volume (mm^3) over time (weeks) in RPM (purple) vs RPMA (orange) basal allografts. Number of tumours quantified are indicated in legend. No suffix=Passage 1 (solid line), p2/p3= Passage 2 or 3 (dashed line). Red “X” indicates censored animals due to early tumour ulceration. c, Bar charts indicating fraction of Ascl1, Neurod1, or Pou2f3-high cells (count expression >0.01) in RPM vs RPMA basal-organoid-derived allografts from scRNA-seq data in Fig. 2e. Red=Positive = “High”; Blue=Negative = “Low”. d, Representative IHC images from RPM and RPMA basal-organoid-derived tumours for indicated markers (left). H-score quantification for indicated proteins (right) in RPM (SCLC only) and RPMA (SCLC- and NSCLC-dominant tumours, >50% of tumour region). Each dot represents one tumour. Only first-passage tumours included. For each marker, n = 11 RPM and 12 RPMA (n = 7 SCLC, n = 5 NSCLC) tumours quantified per genotype from n = 7 RPM and n = 9 RPMA mice. One-way ANOVA with post-hoc Fisher’s LSD pairwise comparisons (exact p-values in figure). Error bars = mean ± s.d. Scale bar, 50 μm. e, Expression of indicated genes in UMAP in RPM and RPMA basal allograft tumours (scRNA-seq data from Fig. 2e) (top), and corresponding violin plots by Leiden cluster (assigned in Fig. 2f) (bottom). Kruskal-Wallis (KW) test (p-value indicated in figure). f, Expression of indicated Neuroendocrine, Neuronal, Mesenchymal/Stem, Basal, SCLC-A2 archetype, Tuft, Ionocyte, Tuft-Ionocyte-Progenitor (TIP), Hillock basal, and SCLC-Atoh1 markers in UMAP of RPM and RPMA basal-derived allograft tumours (from scRNA-seq in Fig. 2e). Source data
Extended Data Fig. 6
Extended Data Fig. 6. Lineage-tracing reveals distinct SCLC evolutionary trajectories. Related to Fig. 3 and Supplementary Tables 4 and 5.
a, UMAP (left) and FA projection (right) of scRNA-seq data from RPM and RPMA basal-organoid derived allograft tumours (from Fig. 3a), coloured by individual sample with method of CellTagging indicated. b, FA projection of individual CellTag clones from RPM basal allograft tumours, coloured by in vivo clonal dynamic “Pattern”, identified in Fig. 3d. See Supplementary Table 4. c, FA projection of individual CellTag clones from RPMA basal allograft tumours, coloured by in vivo clonal dynamic “Pattern”, identified in Fig. 3d. See Supplementary Table 4. d, Expression of indicated SLC subtype or fate markers in RPM and RPMA basal allograft tumour cells in FA map (from scRNA-seq data in Fig. 3c). e, Top: FA map by Leiden cluster of RPM and RPMA basal allograft tumour cells (from Fig. 3c) (left) with corresponding CellRank-predicted terminal states (middle) and assigned SCLC fate with added annotations defining phenotypic variation within SL clusters (right). Predicted CellRank trajectories had an assigned start of Cluster 17, the ‘Basal’ cluster. Bottom: Violin plots by Leiden cluster of SCLC-A2 archetype and Luminal and Basal hillock signatures used to inform SL phenotypic variation. f, CellRank trajectory-specific expression trends of putative drivers (Supplementary Table 5).
Extended Data Fig. 7
Extended Data Fig. 7. Initial basal state of RPM organoids does not determine clonal dynamics. Related to Fig. 3 and Supplementary Tables 2 and 6.
a, UMAP of basal organoid cells from wild-type (WT) organoids pre-Cre, or “CellTag Pre-Cre” RPM/RPMA organoids following transformation with CMV-Cre, with samples collected for scRNA-seq ~4 weeks after the time of Cre administration as in Fig. 3a. b, UMAP annotated by Leiden cluster and genotype corresponding to samples in (a) (Supplementary Table 6). c, Expression of signatures associated with normal lung cell types (e.g., ciliated, neuroendocrine, ionocyte/tuft) or various basal states in UMAP as in (a). Basal state signatures derived from Goldfarbmuren et al., Nat Comm, 2020 and Lin et al., Nature, 2024 (see Supplementary Table 6). d, UMAP as in (a) annotated by assigned basal state and genotype. e, CellTagged clones include those only from “CellTag Pre-Cre” organoids, as described in Fig. 3a, that were present and matching in both transformed organoids and subsequent allografts. Each bar represents one individual clone [comprising between 5–178 cells (RPM) or 6-1,241 cells (RPMA)] with assigned basal state as in (d). The corresponding in vivo clonal pattern (from Fig. 3d) that in vitro clones yield is annotated on the x-axis. f, The location and pattern of in vitro clones in UMAP as in (a) (top row), annotated by basal state, do not differ significantly from each other, but give rise to distinct in vivo RPM patterns 1, 2, and 5 (bottom row).
Extended Data Fig. 8
Extended Data Fig. 8. PTEN loss promotes POU2F3 in basal-derived SCLC. Related to Fig. 4.
a, T7 endonuclease assay on transformed RPM and RPMA basal organoids after lentiviral infection of LCV2 with sgCtrl or sgPten. Expected products of digestion with editing are 671 and 239 bp. b, Immunoblot of pAKT (Ser473) and total AKT with HSP90 as loading control on transformed RPM and RPMA basal organoids with LCV2-sgCtrl or -sgPten. c, Quantification of tumour volume (mm^3) over time (weeks) in RPM (top) and RPMA (bottom) sgCtrl (passage 1=orange, solid; passage 2=green, dashed), and sgPten (passage 1=blue, solid; passage 2=purple, dashed, passage 3=purple, dotted), basal organoid allografts. Exact number of tumours quantified indicated in figure. d, IHC of RPM and RPMA basal-organoid-derived tumours infected with LCV2-sgControl (sgCtrl) or sgPten for indicated markers (left). H-score quantification for indicated proteins (right) in RPM and RPMA “Ctrl” (parental and sgCtrl-infected tumours, orange) and “sgPten” tumours (purple) with SCLC-dominant histopathology (> 50% of tumour region analyzed is SCLC). Quantification of NSCLC-dominant tumours (only in RPMA) included on far right (both “Control” and “sgPten” tumours). Exact number of tumours quantified from n = 5–6 mice per genotype indicated in figure. Multi-passage tumours included. e, Representative H&E and IHC for indicated markers in RPM and RPMA sgCtrl and sgPten tumours with SCLC histopathology versus regions of NSCLC histology including adenocarcinoma (Adeno), adeno-squamous carcinoma (Adeno-squamous), or Squamous differentiation. H-score quantification for indicated proteins (right) in RPM and RPMA “Ctrl” (parental and sgControl-infected tumours, orange) and “sgPten” tumours (purple) with SCLC-dominant histopathology (> 50% of tumour region analyzed). Quantification of NSCLC-dominant tumours (only found in RPMA) included on the far right (both “Control” and “sgPten” tumours). Exact number of tumours quantified from n = 2–6 mice per genotype indicated in figure. Multi-passage tumours included. f, Stacked bar chart has average proportions of indicated histopathologies in individual RPM and RPMA control or sgPten-tumours. Exact number of tumours analyzed indicated above bars. Error bars, mean ± SEM. Histopathologies determined via analysis of H&E and NKX2-1, P63, KRT5, and SCLC subtype marker staining. LCNEC is large-cell neuroendocrine carcinoma. For gel source data for (a,b), see Supplementary Fig. 1. All scale bars, 50 μm. All statistical tests are one-way ANOVA tests with Fisher’s LSD multiple comparisons; **** p < 0.0001, ns=not significant= p > 0.05, and other exact p-values indicated in figure. Source data
Extended Data Fig. 9
Extended Data Fig. 9. PTEN loss and MYC cooperate to drive POU2F3+ SCLC. Related to Fig. 4.
a, Survival of RPP and RPM mice treated with naphthalene + K5-Cre three days later versus RPP mice infected with Cgrp-Cre. Number of mice indicated in the figure. Mantel-Cox log-rank test with exact p-values in figure. b, H-score quantification of ASCL1 (top) and NEUROD1 (bottom) in RPP GEMM tumours initiated by indicated Ad-Cre viruses. Each dot is one tumour. Exact tumour number quantified from n = 5–10 mice per group in figure. Error, mean +/- SD. c, Bar graph depicting H-score for POU2F3 IHC from RPP lung tumours grouped by location in the airways and cell type-specific Ad-Cre virus. Each dot represents one tumour. Exact tumour number quantified from n = 4–18 mice/group in figure. Error, mean +/- SD. d, Immunoblot analysis of human SCLC cell line, H1048, for indicated markers after LCV2 infection with non-targeting control (sgNTC) or sgPTEN sgRNAs with HSP90 as a loading control. e, Immunoblot analysis of H1048 for indicated markers in parental cells versus cells with ectopic myristoylated-AKT (myrAKT) with HSP90 as a loading control. For gel source data for (d,e), see Supplementary Fig. 1. Unless otherwise noted, statistics represent Kruskal-Wallis (KW) tests (p-value indicated on figures). If KW was significant, post-hoc Dunn’s pairwise comparisons were performed (exact p-value on figures with ns=not significant=p > 0.05). Source data
Extended Data Fig. 10
Extended Data Fig. 10. Human SCLC harbours a basal-like subset. Related to Fig. 5 and Supplementary Tables 2, 7, and 8.
a, Spearman correlation matrix of individual genes or gene signature correlations by bulk RNA-seq in n = 944 human SCLC biopsies (see Supplementary Table 2 for gene signatures). b, Heatmap with expression of SCLC subtype markers via bulk RNA-seq in n = 107 human tumours from Liu et al., Cancer Cell, 2024 (top). Tumours are annotated by published NMF groups, and sorted from left to right on “Basal score” expression (mean expression of n = 41 basal fate-related genes). Expression of indicated basal markers captured by proteomic profiling of the same n = 107 tumours are included to assess correlation of “Basal score” signature at the mRNA level with protein expression of basal markers. Individual rows are scaled from 0 to 1 with legends included in figure (right). c, Heatmap with expression by bulk RNA-seq of normal tuft, ionocyte, and tuft-ionocyte-progenitor (“TIP”) marker genes or gene signatures in n = 944 human SCLC biopsies, sorted left to right by expression of POU2F3. Samples are annotated by classified SCLC subtypes (including the 5-group and 6-group classifications as in Fig. 5a,b). d, Gene set enrichment analysis (GSEA) of normal neuroendocrine (NE), tuft, basal, and ionocyte cell signatures (Supplementary Table 2) in each human SCLC subtype (A, N, P or Y) versus “All” other subtypes in the real-world bulk RNA-seq dataset. Normalized enrichment score (NES) and p-values determined by Kolmogorov-Smirnov and permutation testing are shown. e, Expression of ionocyte signatures derived from mouse (M) or human (H) scRNA-seq studies (Supplementary Table 2) applied to RPM and RPMA basal allograft tumour cells (from Fig. 2e) in UMAP (top) or by SCLC fate in violin plots (bottom). Box-whisker overlays on violin plots indicate median and upper and lower quartile. Kruskal-Wallis (KW) tests (p-value in figure) with post-hoc Dunn’s multiple comparison tests (****p <  0.0001, ns=not significant=p > 0.05, and other exact p-values in figure).
Extended Data Fig. 11
Extended Data Fig. 11. A subset of basal cells targeted by K5-Cre express KRT13 hillock cell marker. Related to Fig. 1.
a-d, Representative tdTom+ cells in naphthalene-injured airway epithelium from Ai9 reporter mice at 3–7 days post-K5-Cre administration stained for indicated basal (KRT5, P63) or hillock (KRT13) markers (upper insets). Bottom panel is merged high magnification co-IF from white box inset indicated in top panel. a, Arrows indicate co-expressing cells in the tracheal epithelium. b, Arrows indicate co-expressing cells in the lung epithelium. c, Arrow indicates tdTom+ cells lacking KRT13 (left) or co-expressing KRT13 in a KRT13+ “hillock” structure (right) in the tracheal epithelium. d, Arrows indicate co-expressing cells in the lung epithelium. e, Percent of tdTom+ cells in the trachea vs lung airway vs total (all airway epithelium) co-expressing or within two cells distance from KRT5 (green), P63 (purple), or KRT13 (turquoise) cells. Quantification reflects all detected tdTom+ cells in mouse airways 3–7 days post K5-Cre administration (n = 4 mice, 160 tdTom+ cells were analyzed for KRT13/tdTom co-stain; n = 90 tdTom+ cells were analyzed for KRT5/P63/tdTom co-stain). Scale bars, 50 µm. Source data

Update of

References

    1. Koh, J. et al. Molecular classification of extrapulmonary neuroendocrine carcinomas with emphasis on POU2F3-positive tuft cell carcinoma. Am. J. Surg. Pathol.47, 183–193 (2023). - PMC - PubMed
    1. Chen, C. C. et al. Temporal evolution reveals bifurcated lineages in aggressive neuroendocrine small cell prostate cancer trans-differentiation. Cancer Cell41, 2066–2082 (2023). - PMC - PubMed
    1. Finlay, J. B. et al. Olfactory neuroblastoma mimics molecular heterogeneity and lineage trajectories of small-cell lung cancer. Cancer Cell42, 1086–1105 (2024). - PMC - PubMed
    1. Akbulut, D. et al. Differential NEUROD1, ASCL1, and POU2F3 expression defines molecular subsets of bladder small cell/neuroendocrine carcinoma with prognostic implications. Mod. Pathol.37, 100557 (2024). - PMC - PubMed
    1. Huang, Y. H. et al. POU2F3 is a master regulator of a tuft cell-like variant of small cell lung cancer. Genes Dev.32, 915–928 (2018). - PMC - PubMed

MeSH terms

Substances