. 2025 Aug 16;15(17):9159-9178.
doi: 10.7150/thno.117725. eCollection 2025.

A strategy targeting ferroptosis for mitochondrial reprogramming and intervertebral disc degeneration therapy

Affiliations

A strategy targeting ferroptosis for mitochondrial reprogramming and intervertebral disc degeneration therapy

Tianyi Wu et al. Theranostics. .

Abstract

Background: Intervertebral disc degeneration (IVDD) is a leading cause of low back pain, yet current therapies fail to reverse the degenerative process or restore disc function. Ferroptosis, a form of iron-dependent cell death characterized by lipid peroxidation, has been implicated in IVDD progression. Methods: We synthesized Deferoxamine mesylate (DFOM)-loaded cerium oxide nanoparticles (DFOM@CeO2) as a novel ferroptosis-targeting therapeutic. Results: DFOM@CeO2 exhibited dual functionality by scavenging reactive oxygen species (ROS) and chelating excess iron, thereby protecting nucleus pulposus (NP) cells from ferroptosis and extracellular matrix (ECM) degradation. DFOM@CeO2 demonstrated strong antioxidant capacity, effectively reducing iron accumulation and lipid peroxidation, and restoring glutathione peroxidase 4 (GPX4) expression in NP cells. Furthermore, DFOM@CeO2 improved mitochondrial respiratory chain function, reduce mitochondrial ROS production and prevent mitochondrial dysfunction. In a rat model of IVDD, DFOM@CeO2 significantly preserved disc height, reduced ECM degradation, and demonstrated superior therapeutic efficacy compared with DFOM or CeO2 alone. Transcriptome analysis revealed that DFOM@CeO2 modulates key ferroptosis-related genes and promotes mitochondrial reprogramming. Conclusions: These findings highlight DFOM@CeO2 as a promising therapeutic strategy for IVDD, targeting both ferroptosis and mitochondrial dysfunction.

Keywords: ROS scavenging; ceria nanoparticles; deferoxamine mesylate; ferroptosis; intervertebral disc degeneration.


Conflict of interest statement

Competing Interests: The authors have declared that no competing interest exists.

Figures

Scheme 1
Scheme 1
Schematic diagram of the mechanism of DFOM@CeO2 nanoparticles to maintain microenvironmental iron homeostasis and inhibit lipid peroxidation as a therapeutic strategy for IVDD.
Figure 1
Figure 1
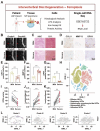
Accumulation of iron ion concentration and ferroptosis in the nucleus pulposus of patients with intervertebral disc degeneration. (A) Schematic representation of nucleus pulposus tissue obtained from a human and tested for subsequent processing. (B) MR images of patients with Pfirrmann grade II-V disc degeneration. Mild group: Grade II-III, Severe: Grade IV-V. (C) Hematoxylin-eosin (H&E) and Safranin O-fast Green (S.O.) staining of different degenerated groups. Scale bar: 50 μm. (D) Immunohistochemical analysis of COLII, MMP13, and Gpx4 staining in patient discs. Scale bar: 50 μm. (E-G) Quantitative analysis of COLII-positive cells, MMP13-positive cells, and GPX4-positive cells. (H) UMAP visualization of human nucleus pulposus cells revealed five distinct clusters through unsupervised clustering. Each dot represents an individual cell, with colors indicating the different cell clusters. (I-K) Levels of GPX4 activity, LPO, and iron ions in human nucleus pulposus tissues. (L) GPX4 immunohistochemical detection results in the nucleus pulposus tissues from different degeneration groups.
Figure 2
Figure 2
Synthesis and characterization evaluation of DFOM@CeO2 nanoparticles and DFOM@CeO2 inhibits ferroptosis in NPCs in vitro. (A) Schematic of the preparation of DFOM@CeO2. (B) Transmission electron microscopy images of CeO2. Scale bar: 10 nm. (C) UV-vis absorbance spectra of ABTS+• after incubation with different concentrations of CeO2 nanoparticles (n = 3). (D) Lipid peroxidation levels were detected by immunofluorescence staining for BODIPYTM in NPCs. Scale bar: 50 μm. (E) Western blot of GPX4 in NPCs. (F) Immunofluorescence staining was used to analyze the expression of GPX4 in Scale bar: 50 μm. (n = 3). (G) Quantitative analysis of BODIPYTM staining immunofluorescence (n = 3). (H) Quantitative analysis of GPX4 immunofluorescence staining (n = 3). (I) Intracellular Fe2+ levels were measured by flow cytometry using FerroOrange. (J) Quantitative analysis of intracellular Fe2+ levels (n = 3). (K) Western blot analysis and quantification of GPX4 in NPCs. (n = 3).
Figure 3
Figure 3
DFOM@CeO2 modulates ROS production through the mitochondrial respiratory chain in NPCs. (A) Schematic diagram of TBHP increasing intracellular ROS levels by inhibiting the mitochondrial respiratory chain. (B) Western blot analysis of NDUFB8, SDHB, UQCRC2, MTCO1, and ATP5A1 in NPCs. (n = 3). (C) TEM analysis of mitochondria in NPCs. Scale bar: 100 μm. (n = 3). (D) Quantitative analysis of intracellular ROS levels (n = 3). (E) Quantitative analysis of JC-1 staining (n = 3). (F) Mitochondria membrane potential of NPCs in different groups after JC-1 staining. JC-1 aggregate: green, JC-1 monomer: red. Scale bar: 50 μm. (G) Quantitative analysis of MitoSOX staining (n = 3). (H, J-K, M-N) Western blot quantification of NDUFB8, SDHB, UQCRC2, MTCO1, and ATP5A1 in NPCs. (n = 3). (I) Mitosox staining was used to analyze the amount of ROS produced by the mitochondria. Scale bar: 50 μm. (n = 3). (L) Intracellular ROS levels were measured by flow cytometry using DCFH-DA.
Figure 4
Figure 4
DFOM@CeO2 reverses extracellular matrix degeneration in NPCs. (A) Immunofluorescence staining was used to analyze the expression of COLII in NPCs treated with TBHP, TBHP+DFOM, TBHP+CeO2, or TBHP+ DFOM@CeO2. Scale bar: 50 μm (n = 3). (B) Quantitative analysis of COLII staining immunofluorescence. (C) Quantitative analysis of MMP3 staining immunofluorescence. (D) Immunofluorescence staining was used to analyze the expression of MMP3 in NPCs treated with TBHP, TBHP+DFOM, TBHP+CeO2, or TBHP+DFOM@CeO2. Scale bar: 50 μm (n = 3). (E) RT-qPCR results showing the mRNA expressions of Acan, Col2a1, Mmp13, Sox9, Adamts5 and Mmp3 in NPCs treated with or without TBHP, TBHP+DFOM, TBHP+CeO2, or TBHP+ DFOM@CeO2 (n = 3). (F) Alcian blue staining of NPCs cultured after treatment with TBHP, TBHP+DFOM, TBHP+CeO2, or TBHP+ DFOM@CeO2. (G) Western blot analysis of ACAN, COLII, MMP13, SOX9, ADAMTS5, and MMP3 in NPCs (n = 3). (H) Schematic diagram of the homeostasis mechanism of ROS clearance and lipid peroxidation downregulation while mitochondrial homeostasis and extracellular matrix restoration.
Figure 5
Figure 5
DFOM@CeO2 effectively treats intervertebral disc degeneration in vivo. (A) Schematic diagram of the animal experiment. (B) X ray images of the IVDs of the rat tail in the five groups (Sham, IVDD, IVDD+DFOM, IVDD+CeO2, and IVDD+DFOM@CeO2) at the 4th and 8th weeks. Yellow arrows: puncture sites. (C) MR images of the IVDs of the rat tail in the five groups (Sham, IVDD, IVDD+DFOM, IVDD+CeO2, and IVDD+DFOM@CeO2) at the 4th and 8th weeks. Yellow arrows: puncture sites. (D-E) Hematoxylin-eosin (H&E) and Safranin O-fast green (S.O.) staining of the five groups at the 4th and 8th weeks. Scale bar: 500 μm. (F-H) Immunohistochemical analysis of COLII, MMP13, and GPX4 staining of the rat tail in the five groups (Sham, IVDD, IVDD+DFOM, IVDD+CeO2, and IVDD+DFOM@CeO2) at the 4th and 8th weeks. Scale bar: 50 μm. Scale bar: 50 μm. (I) Pfirrmann grade of the IVDs of the rat tail in five groups at the 4th and 8th weeks. (J) Intervertebral heights of the IVDs of the rat tail in the five groups at the 4th and 8th weeks. (K) Histological grade scores of Hematoxylin-eosin (H&E) staining of the IVDs at the 4th and 8th weeks. (L) Quantitative analysis of GPX4-positive cells in the five groups at the 4th and 8th weeks (n = 5).
Figure 6
Figure 6
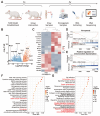
Transcriptome analysis reveals DFOM@CeO2's protective mechanisms and pathway enrichment in vivo. (A) Schematic diagram of sample sequencing from an animal model of IVDD. (B) Volcano plots of differentially expressed genes after sequencing. (C) Heat maps of ferroptosis-related gene expression, extracellular matrix-related gene expression, and mitochondria respiratory chain-related gene expression. (D) Ferroptosis GSEA enrichment analysis based on KEGG datasets. (E) Positive regulation of mitochondrial depolarization GSEA enrichment analysis based on GO datasets. (F) KEGG enrichment analysis of signaling pathways. (G) GO enrichment analysis of signaling pathways.

References

    1. GBD 2021 Diseases and Injuries Collaborators. Global incidence, prevalence, years lived with disability (YLDs), disability-adjusted life-years (DALYs), and healthy life expectancy (HALE) for 371 diseases and injuries in 204 countries and territories and 811 subnational locations, 1990-2021: a systematic analysis for the Global Burden of Disease Study 2021. Lancet. 2024;403:2133–61. - PMC - PubMed
    1. Cieza A, Causey K, Kamenov K, Hanson SW, Chatterji S, Vos T. Global estimates of the need for rehabilitation based on the Global Burden of Disease study 2019: a systematic analysis for the Global Burden of Disease Study 2019. Lancet. 2021;396:2006–17. - PMC - PubMed
    1. Binch ALA, Fitzgerald JC, Growney EA, Barry F. Cell-based strategies for IVD repair: clinical progress and translational obstacles. Nat Rev Rheumatol. 2021;17:158–75. - PubMed
    1. Genedy HH, Humbert P, Laoulaou B, Le Moal B, Fusellier M, Passirani C. et al. MicroRNA-targeting nanomedicines for the treatment of intervertebral disc degeneration. Adv Drug Deliv Rev. 2024;207:115214. - PubMed
    1. Swahn H, Mertens J, Olmer M, Myers K, Mondala TS, Natarajan P. et al. Shared and Compartment-Specific Processes in Nucleus Pulposus and Annulus Fibrosus During Intervertebral Disc Degeneration. Adv Sci (Weinh) 2024;11:e2309032. - PMC - PubMed

MeSH terms

LinkOut - more resources