. 2025 Aug 16;15(17):9221-9239.
doi: 10.7150/thno.115746. eCollection 2025.

Neutrophil extracellular traps induce endothelial damage and exacerbate vasospasm in traumatic brain injury

Affiliations

Neutrophil extracellular traps induce endothelial damage and exacerbate vasospasm in traumatic brain injury

Jinchao Wang et al. Theranostics. .

Abstract

Cerebral vasospasm (CVS) critically exacerbates secondary brain injury following traumatic brain injury (TBI). Understanding the underlying mechanisms is essential for developing targeted interventions. Methods: We developed a comprehensive murine multimodal imaging platform to evaluate CVS cerebral perfusion, and blood-brain barrier (BBB) integrity, integrating in vivo multiphoton microscopy, magnetic resonance angiography, carotid Doppler ultrasound, and laser speckle contrast imaging with molecular assays and functional assessments. Additionally, we comprehensively analyze single-cell RNA (TBI vs Sham) and bulk-RNA data (NETs-treated vs Control), delineating NETs-driven endothelial injury signatures. Finally, we explored the roles of PAD4-/-, TLR4 inhibition and TREM1 blockade in blocking NETs-induced endothelial injury and CVS, validating key therapeutic targets. Results: Our findings reveal that neutrophil extracellular traps (NETs) stimulate endothelial cells, promoting intracellular accumulation of TREM1, which forms a stable complex with NF-κB. This complex synergistically amplifies TLR4-mediated inflammatory responses, constituting a novel mechanism by which NETs aggravate endothelial injury and vasospasm after TBI. Preclinical interventions aimed at inhibiting NET formation or blocking TREM1 signaling significantly reduced neuroinflammation, cerebral edema, and CVS. Conclusions: These findings identify TREM1 as a promising therapeutic target and illuminate a NET-driven crosstalk between vascular dysfunction and inflammatory cascades in the context of TBI, offering novel translational insights for mitigating secondary brain injury.

Keywords: Endothelial dysfunction; Neutrophil extracellular traps; TREM1; Traumatic brain injury; Vascular spasm.


Conflict of interest statement

Competing Interests: The authors have declared that no competing interest exists.

Figures

Figure 1
Figure 1
Multimodal imaging assessment of CVS and BBB alterations following TBI. (A to C) In vivo multiphoton microscopy images showing capillary perfusion in the contralateral hemisphere of the injured brain (n = 6/group) and diameters of 20 randomly selected capillaries per group (n = 6 mice/group), using FITC-dextran (MW = 2000 kDa) for capillary perfusion imaging. Bar = 100 µm. (D) Representative images of blood flow velocity measurements in the mouse carotid artery via ultrasound. (E to H) Quantitative Doppler ultrasound analysis of blood flow velocity, including PSV and EDV in the affected RCCA and RICA (n = 6/group). (I) MRI schematic showing the middle cerebral artery's starting segment and the internal carotid artery's terminal segment in mice, red highlights indicate injury sites in TBI models. (J to M) MRI-based measurements of intracranial vessel diameters in the affected ICA terminal segment, contralateral ICA terminal segment, affected MCA starting segment, and contralateral MCA starting segment (n = 6/group). (N to P) Representative images of CBF obtained through laser speckle measurements at 1 and 3 days post-TBI, along with quantitative analysis of traumatic injury and contralateral continuous CBF changes (n = 6/group). (Q) In vivo representative multiphoton microscopy images showing FITC-dextran (MW = 40 kDa, green) leakage in cortical vessels at Day-1 and Day-3post-TBI and in sham mice (n = 6/group). Bar = 100 µm. (R) Quantification of fluorescence intensity changes before and after TBI and sham treatment in the same vessels. Data are presented as mean ± standard deviation (S.D.) and analyzed by one-way or repeated measures analysis of variance (ANOVA) with Bonferroni's multiple comparison test as appropriate. *p < 0.05, **p < 0.01, ***p < 0.001.
Figure 2
Figure 2
NETs deficiency alleviates CVS following TBI. (A to D) Western blot analysis and densitometric quantification of PAD4, H3cit, H3, and ET-1 expression in the injured cortex at various time points post-TBI compared to sham mice. (E and F) Western blot analysis and densitometric quantification of ET-1 expression in PAD4-/- versus WT mice at multiple time points post-TBI, with sham-operated controls included for both genotypes. GAPDH served as the loading control. (G to I) Multiphoton microscopy images showing the quantification of perfused cortical capillaries (n = 6/group) and the diameters of randomly selected capillaries (n = 20/group) for capillary perfusion imaging in the hemisphere contralateral to the injury site. FITC-dextran (MW = 2000 kDa). Bar = 100 µm. (J to M) Quantitative ultrasound Doppler analysis of blood flow velocity, including PSV and EDV in the RCCA and RICA on the injured side. (n = 6/group). (N to Q) MRI analysis of intracranial vessel diameters in the affected ICA terminal segment, contralateral ICA terminal segment, affected MCA starting segment, and contralateral MCA starting segment (n = 6/group). (R to T) Representative laser speckle imaging of CBF at Day-3 post-TBI with quantitative analysis of continuous CBF changes in the injured and contralateral hemispheres (n = 6/group). (U) Representative multiphoton microscopy images showing leakage of FITC-dextran (MW = 40 kDa, green) in cortical vessels on day 3 post-TBI and in sham mice (n = 6/group). Bar = 100 µm. (V) Quantification of fluorescence intensity changes before and after TBI and sham treatment in the same vessels. (n = 6/group). Data are presented as mean ± S.D. and analyzed by one-way or repeated measures ANOVA with Bonferroni's multiple comparison test as appropriate. *p < 0.05, **p < 0.01, ***p < 0.001.
Figure 3
Figure 3
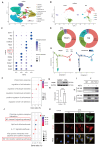
NETs stimulate TREM1 expression and its interaction with the TLR/NF-κB pathway in endothelial cells. (A) UMAP visualization of the expression differences in 124,595 single cells from injured and control mice, annotated by cell type based on established lineage markers. (B) Endothelial cells were extracted from the total cell population, followed by re-clustering and UMAP visualization, and separated into Sham and TBI groups. (C) Dot plot showing the expression of selected marker genes across different endothelial cell subpopulations. (D) Proportions of each endothelial cell population within different experimental groups. (E) Visualization of the results from pseudotime analysis of endothelial cells. (F) Visualization of the enrichment analysis of differentially expressed genes in the third endothelial cell cluster. (G and H) Western blot analysis and densitometric quantification were performed to evaluate the expression levels of TREM1 and GAPDH in patient samples. Data analyzed by unpaired t-test. (n = 6/group). (I) Co-IP results examining the physical association between NF-κB p65 and TREM1 in endothelial cells after NETs stimulation. (J) RNA-Seq analysis of injured cortical tissue from TBI mice, with functional enrichment of genes most strongly associated with TREM1 expression. (K) Representative images of double immunofluorescence staining for NF-κB (red) and TREM1 (green) in endothelial cells following different treatments. Nuclei were stained with DAPI (blue). (n = 6/group). Scale bar = 20 µm. Data are presented as mean ± S.D. and analyzed by one-way ANOVA with Bonferroni's multiple comparison test. *p < 0.05, **p < 0.01, ***p < 0.001.
Figure 4
Figure 4
NETs inhibition modulates inflammatory and tight junction protein expression in the TBI. (A) KEGG pathway enrichment analysis of differentially expressed genes from RNA-Seq of NETs-treated and vehicle-treated HUVECs. (B to G) Western blot analysis and densitometric quantification were performed to measure the expression levels of TLR4, NLRP3, P-NF-κB, TREM1, ET-1 and GAPDH in the damaged cortex of TBI or sham group mice. (n = 6/group). (H to M) Representative images of double immunofluorescence staining for P-NF-κB (red), NLRP3 (red), or ZO-1 (red) and CD31 (green), along with quantitative analysis of mean fluorescence intensity, in the cortical injury sites of mice on day 3 post-TBI following different treatments. Nuclei were stained with DAPI (blue). White scale bar = 50 µm. Red scale bar = 20 µm. (n = 6/group). (N to Q) Western blot analysis and densitometric quantification were performed to measure the expression levels of ICAM-1, Occludin, Claudin-5, and GAPDH in the cortical injury sites of mice on day 3 post-TBI following different treatments. (n = 6/group). Data are presented as mean ± S.D. and analyzed by one-way ANOVA with Bonferroni's multiple comparison test. *p < 0.05, **p < 0.01, ***p < 0.001.
Figure 5
Figure 5
Inhibition of TREM1 and TLR4 ameliorates TBI-induced endothelial dysfunction. (A to D) Western blot analysis and densitometric quantification of NLRP3, P-NF-κB, ET-1, and GAPDH in the cortical injury sites of mice on Day-3 post-TBI following different treatments. (n = 6/group). (E to J) Representative images of double immunofluorescence staining for P-NF-κB (red), NLRP3 (red), or ZO-1 (red) and CD31 (green), along with quantitative analysis of mean fluorescence intensity, in the cortical injury sites of mice on Day-3 post-TBI following different treatments. Nuclei were stained with DAPI (blue). White scale bar = 50 µm. Red scale bar = 20 µm. (n = 6/group). (K to N) Western blot analysis and densitometric quantification were performed to measure the expression levels of ICAM-1, Occludin, Claudin-5, and GAPDH in the cortical injury sites of mice on Day-3 post-TBI following different treatments. (n = 6/group). Data is presented as mean ± S.D. and analyzed by one-way ANOVA with Bonferroni's multiple comparison test. *p < 0.05, **p < 0.01, ***p < 0.001.
Figure 6
Figure 6
In vitro validation of TLR4/TREM1 targeting in NETs-induced endothelial dysfunction. (A to D) Western blot analysis and densitometric quantification of NLRP3, P-NF-κB, ET-1, and GAPDH expression in endothelial cells under different treatment conditions. (n = 6/group). (E to H) Representative immunofluorescence images of NLRP3 (red) and ZO-1 (red)in endothelial cells under different conditions, with quantitative analysis of mean fluorescence intensity. Nuclei were stained with DAPI (blue). Scale bar = 50 µm. (n = 6/group). (I to L) Western blot analysis and densitometric quantification were performed to measure the expression levels of ICAM-1, Occludin, Claudin-5, and GAPDH in endothelial cells treated under different conditions. (n = 6/group). (M) In vitro HUVEC experiments were conducted to assess cell viability using the Cell Counting Kit-8 (CCK-8) assay (n = 6/group). (N) The culture media were also collected to quantify NO levels using a commercially available kit (n = 6/group). (O) Endothelial permeability was assessed by measuring the transendothelial leakage of FITC-dextran (70 kDa; n = 4/group). (P) Measurement of intracellular reactive oxygen species (ROS) levels in treated HUVECs (n = 6/group). (Q and R) Vascular ring tension assay generating concentration-response curves to phenylephrine (Phe) and acetylcholine (Ach) in carotid arteries from mice under different treatment conditions. Data are presented as mean ± S.D. and analyzed by one-way ANOVA or Two-way ANOVA with Bonferroni's multiple comparison test. *p < 0.05, **p < 0.01, ***p < 0.001.
Figure 7
Figure 7
Targeting TREM1 and TLR4 improves CVS and functional outcomes after TBI in vivo. (A to C) Multiphoton microscopy images showing capillary perfusion in the contralateral hemisphere of the injured brain (n = 6/group), with quantification of diameters from 20 capillaries per group (n=6 mice/group), using FITC-dextran (MW = 2000 kDa). Bar = 100 µm. (D, E) MRI analysis of intracranial vessel diameters in the affected ICA terminal segment, affected MCA starting segment (n = 6/group). (F to I) Quantitative Doppler ultrasound analysis of blood flow velocity, including PSV and EDV in the affected RCCA and RICA (n = 6/group). (J to L) Representative laser speckle imaging of CBF at Day-3 post-TBI, with quantitative analysis of continuous CBF changes in both the injured and contralateral hemispheres (n = 6/group). (M) Representative multiphoton microscopy images showing leakage of FITC-dextran (MW = 40 kDa, green) in cortical vessels on Day-3 post-TBI and in sham mice (n = 6/group). Bar = 100 µm. (N) Quantification of fluorescence intensity changes in the same vessels before and after TBI or sham treatment. (n = 6/group). Data are presented as mean ± S.D. and analyzed by one-way ANOVA with Bonferroni's multiple comparison test. *p < 0.05, **p < 0.01, ***p < 0.001.

References

    1. Dewan MC, Rattani A, Gupta S, Baticulon RE, Hung Y-C, Punchak M. et al. Estimating the global incidence of traumatic brain injury. J Neurosurg. 2019;130:1080–97. - PubMed
    1. Jiang J-Y, Gao G-Y, Feng J-F, Mao Q, Chen L-G, Yang X-F. et al. Traumatic brain injury in China. Lancet Neurol. 2019;18:286–95. - PubMed
    1. Maas AIR, Menon DK, Adelson PD, Andelic N, Bell MJ, Belli A. et al. Traumatic brain injury: integrated approaches to improve prevention, clinical care, and research. Lancet Neurol. 2017;16:987–1048. - PubMed
    1. Bramlett HM, Dietrich WD. Long-Term Consequences of Traumatic Brain Injury: Current Status of Potential Mechanisms of Injury and Neurological Outcomes. J Neurotraum. 2015;32:1834–48. - PMC - PubMed
    1. Jha RM, Kochanek PM. A Precision Medicine Approach to Cerebral Edema and Intracranial Hypertension after Severe Traumatic Brain Injury: Quo Vadis? Curr Neurol Neurosci. 2018. 18. - PMC - PubMed

MeSH terms

Substances